Nifty 50 Analysis: Will US IT Crash Drag Us Down?Hi everyone! In this video, I break down the Nifty 50 daily chart using Elliott Wave logic.
We are hitting a major hurdle at the 100-DMA, but there is a big twist tonight.
In the US market,Accenture (ACN) is down -17%, dragging down Indian ADRs like Infosys (-8%) and Wipro (-6%). Will this global IT shock drag Nifty under our critical 23,862.25 support level tomorrow, or will other sectors hold the line? Let'ss look at the key levels to watch.
Disclaimer: This post is for educational purpose
Elliott Wave
XAUUSD: Rising channel supports bullish trend.Gold is trading inside a clear rising channel, and the current price action shows that buyers are still defending the short-term recovery structure. From Kelly’s view, the market is building a new Elliott Wave sequence, with the latest pullback looking more like a healthy correction than a full bearish reversal.
The key idea is simple: as long as price holds above the trend-following buy zone, the bullish wave structure remains valid.
⟡ Market structure
Gold has recovered strongly from the lo
Bank of Maharashtra Shares Stay Strong: ₹107.5 Emerges as Key TPLong-term bullish structure remains intact
Bank of Maharashtra is trading in a long-term bullish trend.
Wave (3) ended near ₹71 after reaching the 2.618 Fibonacci extension of Wave (1).
Wave (4) completed an ABC correction and found support near ₹44 .
The stock is currently progressing in Wave (5) , indicating the possibility of further upside.
Immediate resistance is seen around ₹95–96 , while the next major target is near ₹107.5 .
Bank of Maharashtra remains in a long-term
Motilal Oswal: Record Revenue Meets Shrinking VolumeAs a major financial services and broking firm, Motilal Oswal often acts as a mirror for the broader stock market. When trading activity peaks and retail investors rush in, these businesses scale up rapidly. Let us break down what the latest data and long-term charts are telling us, without any hype or bias.
The Technical Chart: A Late-Stage Pause
On the long-term monthly chart, the stock is in a clear, multi-year upward trend. It is currently moving through what looks like a late-stage struc
Cipla (2H): Corrective Channel and Critical Support LevelsCipla has been cooling off after a strong upward move. On the 2-hour chart, this pullback is contained within a well-defined downward parallel channel. Looking at the chart data objectively helps pinpoint where the key structural inflection levels sit.
The Primary Wave Count: A Controlled Pullback
The chart tracks a completed 5-wave upward structure that started from the structural low of 1,165.70 and peaked at 1,444.50 .
Wave 1 and Wave 2 formed the early base near 1,203.20 .
Wave 3
XAUUSD: Corrective Wave C ongoingGold is moving into a corrective phase after the previous strong upside expansion. From Kelly’s view, the current structure suggests that the market is now developing wave C, even though wave B spent a long time consolidating near the upper range.
The key idea is simple: as long as price stays below the short-term trendline and the 4,330–4,340 sell zone, selling pressure still has the cleaner structure.
⟡ Market structure
Gold pushed strongly higher from the lower base and completed a clear u
Arrow Genentech ready for double ??Disclaimer : This view is only for educational purpose and it's not buying or selling recommendation. Consult your financial advisor for stock market related investment. Stock market gains are subject to market risk's, hence invest with accepting stock market risk's.
I am not responsible for your profits and losses.
1] Arrow Genentech completed one complete Elliot wave cycle on monthly timeframe and it's moving for next cycle (3rd Wave)
2] In impulse wave, wave-5 was extended wave and when Wa
NIFTY Can reach to 25500 in coming monthsDisclaimer : This view is only for educational purpose and it's not buying or selling recommendation. Consult your financial advisor for stock market related investment. Stock market gains are subject to market risk's, hence invest with accepting stock market risk's.
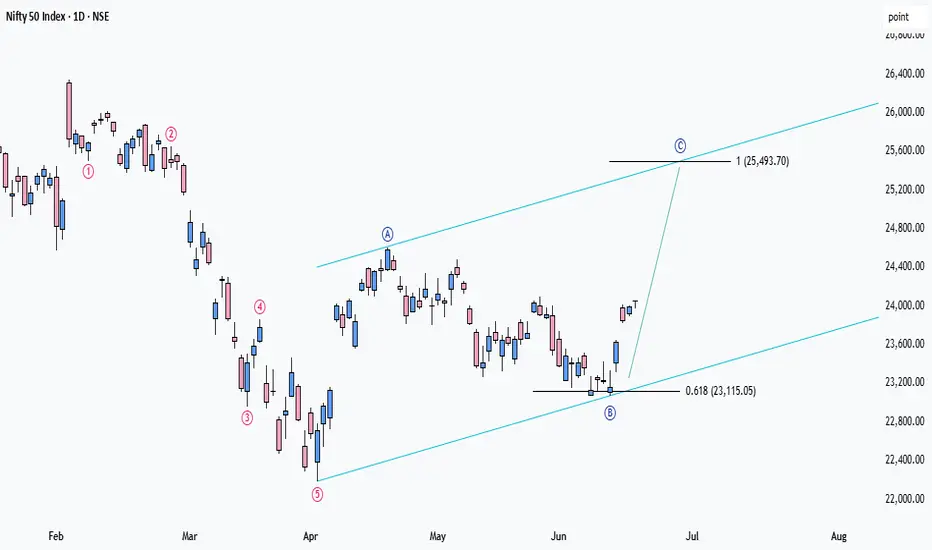
I am not responsible for your profits and losses.
Nifty 50 can reach to 25500 in coming months.
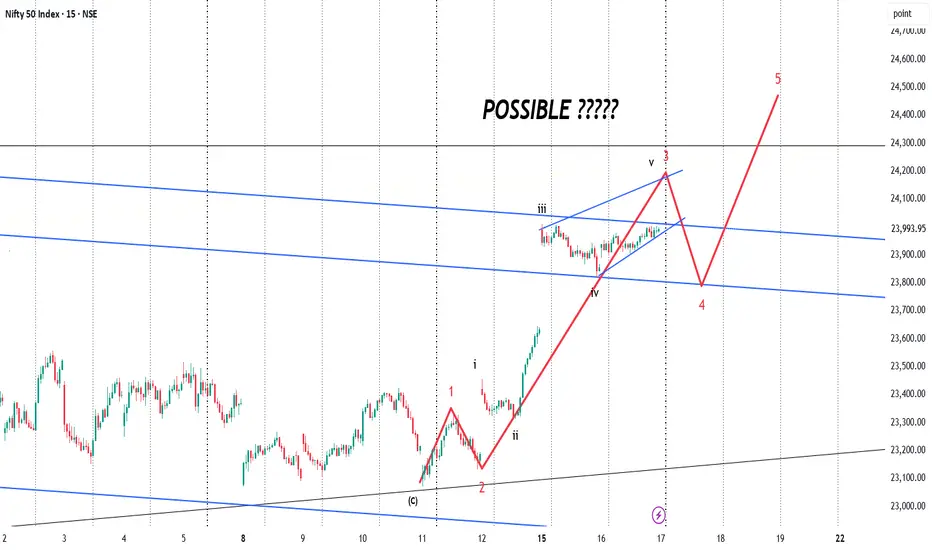
Nifty Possible Movement - Exact structure to unfold on fridayNIFTY 50 | Elliott Wave Outlook (15M)
NIFTY appears to be unfolding a bullish Elliott Wave impulse structure after completing a corrective Wave (C) near major trendline support. The current price action suggests Waves 1 and 2 are complete, with Wave 3 potentially extending toward the upper channel resistance around 24,200.
A healthy Wave 4 pullback could retest the breakout zone near 23,800 before the final Wave 5 advance targets the 24,450–24,500 region. Price is also approaching a key descen
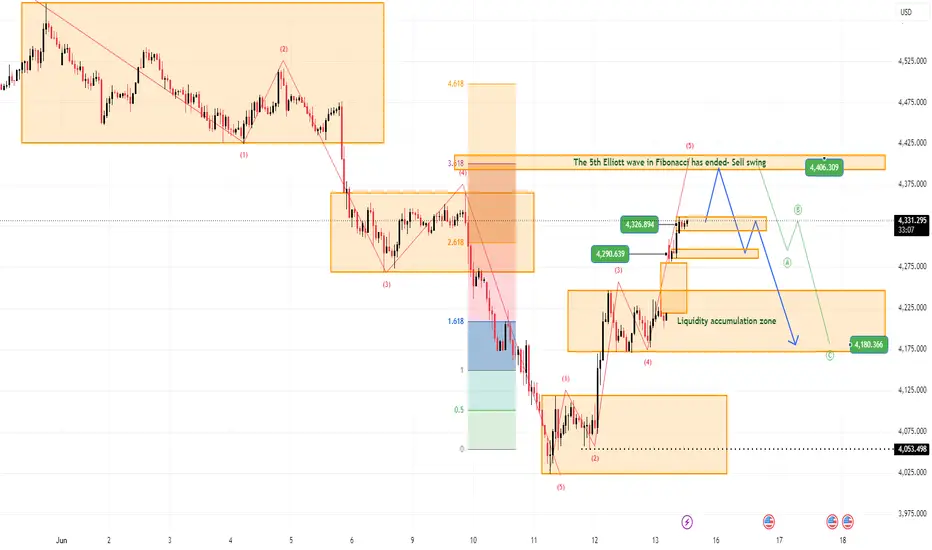
XAUUSD: Wave 5 Hits Fibonacci Sell ZoneGold is pushing into an important resistance area after a strong recovery from the lower liquidity base around 4,053. From Kelly’s view, the current advance is now approaching the final part of a short-term Elliott Wave structure, where wave 5 may be close to completion.
The key idea is simple: gold is still rising, but price is now entering a Fibonacci resistance zone where the next reaction becomes very important.
⟡ Market structure
The chart shows a strong recovery from the 4,053 support a
SBI Life: Bullish Scenario - Wave (5) Targets ₹2400 – ₹2600
SBI Life appears to have completed a strong Wave (3) advance near ₹2150 after a five-wave structure. The ongoing decline is likely part of a corrective Wave (4) phase.
The stock is currently trading near the lower boundary of its long-term rising channel, which is acting as an important support zone.
A sustained move above ₹1950 may indicate the completion of the corrective phase and could lead to the start of Wave (5) . In such a case, the stock may move towards ₹2400–2600 over the
Silver .. Sell on RiseSilver (XAG/USD) 4-Hour Chart Analysis – Elliott Wave & NeoWave Perspective
The chart suggests that Silver is developing a large corrective structure within a rising channel, and the current price action appears to be nearing the completion of a complex ABCDE contracting triangle / terminal corrective pattern before a potentially significant downside move.
Bigger Picture Structure
The chart shows Silver advancing within a long-term rising channel before completing a major swing high near the
Gold finishes impulse cycle - ABC correction starting?The Gold market (XAUUSD) kicks off the new trading week under intense bearish pressure, displaying a clean structural shift as sellers aggressively dominate the intraday momentum. Following a highly volatile week dictated by US CPI and PPI inflation data, market participants are experiencing a temporary macroeconomic data vacuum on Monday. Consequently, institutional desks (Smart Money) are driving the price action strictly based on technical order flow and liquidity rebalancing.
The market sen
S&P 500: Is the correction already over?After an impressive rally from the April lows, the S&P 500 has entered a period of consolidation rather than a full-scale reversal. Despite the recent pullback, the broader market structure remains constructive, and buyers continue to defend key support levels. The index remains the benchmark for global risk appetite, making its next move particularly important for investors across all asset classes.
From a fundamental perspective, market participants continue to focus on the trajectory of infl
HDFC Bank - 30 year history (monthly chart)
Nifty 50's movement is primary determined by the top 10 constituents as they have a total weightage of over 52%, among which HDFC bank alone has over 10% weightage. Hence any movement in HDFC Bank will largely impact Nifty's movement and in turn other banks as well.
From above perspective, Let's have a look at the stock's movement covering its entire history.
HDFC Bank which got listed in 1995, completed its Primary Degree Wave 1 at the peak of the US subprime crisis during mid 2007 and compl
Gold: Buyers regain control after the reboundAfter a sharp decline earlier this month, gold is showing signs of stabilization and attempting to rebuild bullish momentum. The recent recovery from local lows has allowed buyers to reclaim several important levels, suggesting that the corrective phase may be losing strength. With ongoing geopolitical uncertainty and expectations surrounding central bank policy, XAUUSD remains one of the most closely watched assets in global markets.
From a fundamental perspective, gold continues to benefit fr
XAUUSD: Weekly Wave 5 Still BearishGold is trading inside a broad descending channel, and the weekly structure still favors the downside. From Kelly’s view, the current rebound remains weak while price stays capped below the 4,250 sell zone, and the larger Elliott structure still suggests that wave 5 may continue lower.
The key idea is simple: gold may still have room to extend lower if the sell zone holds.
⟡ Market structure
The chart shows gold moving under a clear descending channel after the major rejection from the previo
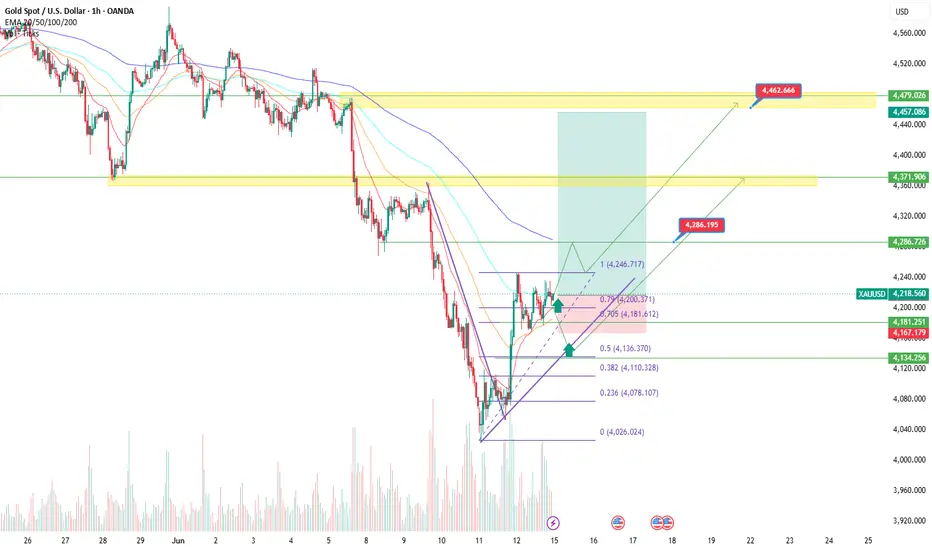
XAUUSD: Wave 2 at Key Decision ZoneGold is currently moving inside a wave 2 structure after the strong recovery from the lower liquidity area. From Kelly’s view, the market is now sitting in a sensitive accumulation zone, where the next confirmation will decide whether buyers continue the recovery or sellers regain control.
The key point is clear: bullish confirmation comes above 4,245, while bearish confirmation comes below 4,170.
⟡ Market structure
Price reacted strongly from the previous lower base and pushed into the upper
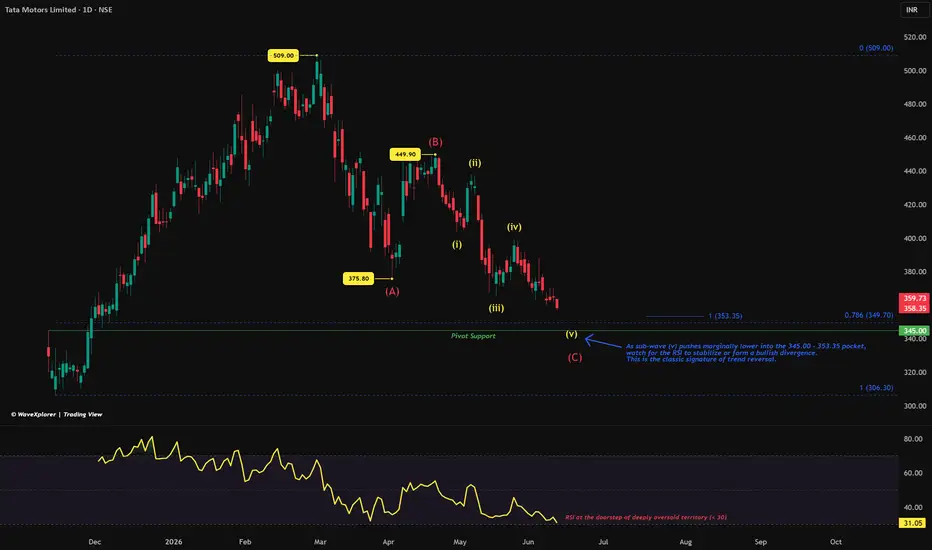
TMCV: Strong Business, Falling Chart. What Next?Tata Motors Commercial Vehicles (TMCV) has been in a steady downward correction since peaking at 509.00. Interestingly, while the company's underlying business remains healthy—showing strong double-digit sales growth and solid quarterly earnings—broader market pressures like rising oil prices have continued to weigh on the stock.
This drop has brought the price down to a very specific technical area where multiple chart patterns meet. Here is an objective, step-by-step look at the current struc
INDOTHAI - a range break out after 3 Month ConsolidationsNSE:INDOTHAI
Weekly :
Price above 50,100 and 200 EMA and probably close this week above EMA20
Price was range bound since Jan-2026 till date.
Nice Explosive Weekly green candle formed by current week.
Daily :
EMA/s are in good support justify no more weakness in price
back to Back ~ 5% move is good sign for positive move soon
More positive delta and improving CVD
What to be next possibilities ?
A pull back where we may long or better follow through above 284
W
XAUUSD: ABC recovery requires confirmation over 4119Gold is trying to recover after completing a sharp bearish wave sequence into the lower liquidity area. From Kelly’s view, the current structure is developing as an ABC corrective recovery, but the market still needs confirmation before the upside scenario becomes stronger.
The key point is clear: gold can continue the rebound if price confirms above 4119, but the recovery weakens if price breaks below 4053.
⟡ Market structure
Price has reacted from the recent low after a strong impulsive dec