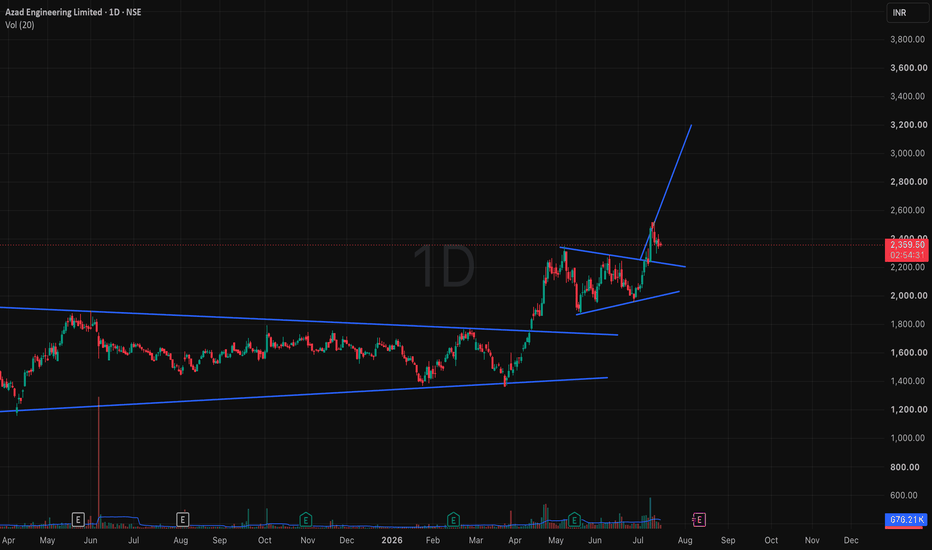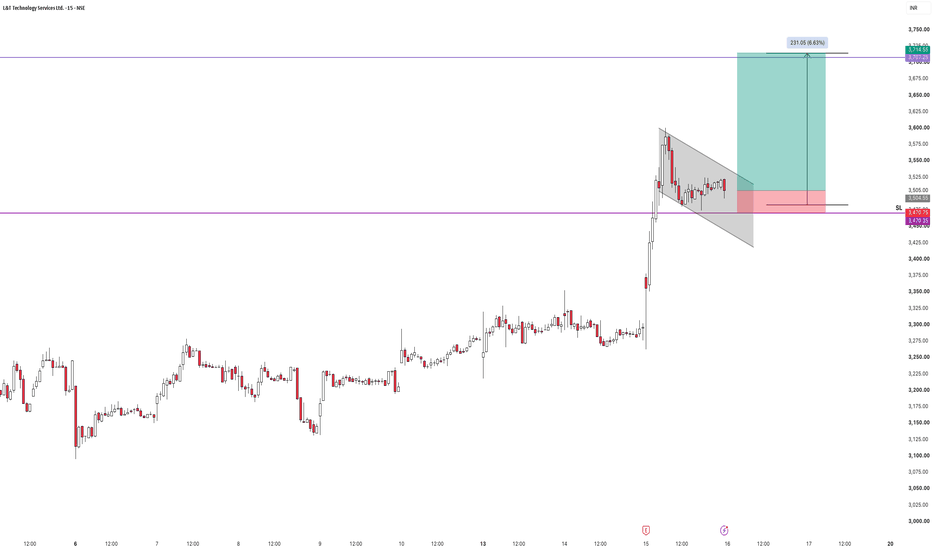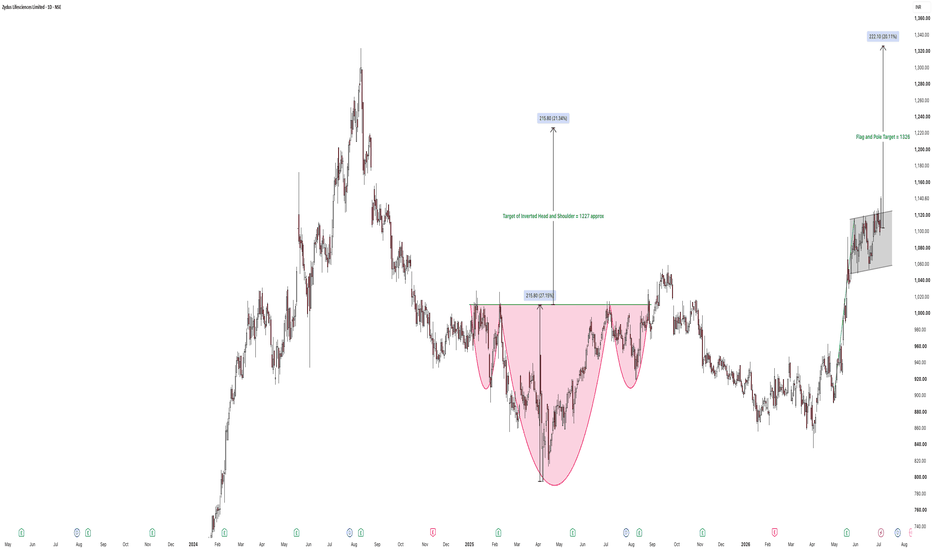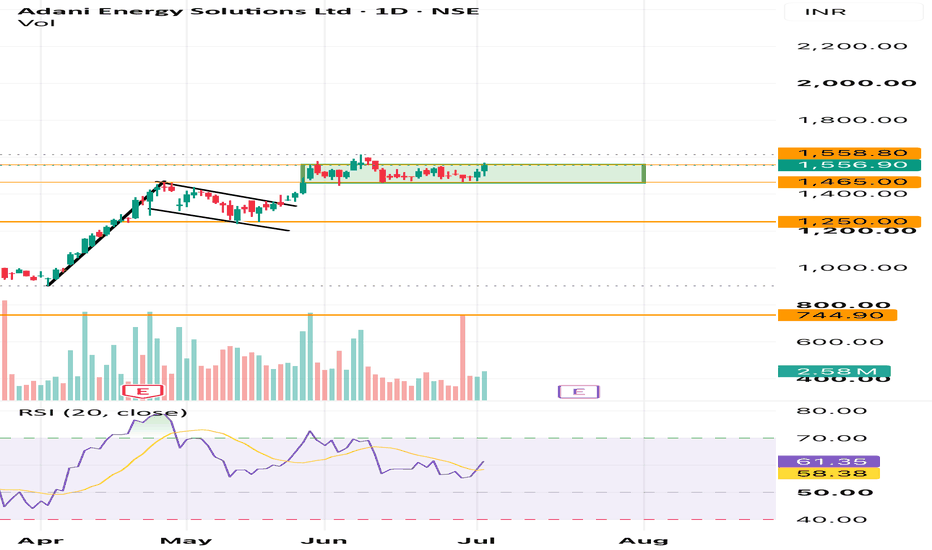
Sbin - Multitime frame analysis.In a lower time frame(15 minutes), we can see a nice bull flag pattern formation. It is a bullish pattern. In a higher time frame(daily), the price is moving up after taking double bottom support.
Buy above 975 with the stop loss of 965 for the targets 984, 992, 1000 and 1012.
The price is bullish as long as it is above 958 - 962. Below this zone, the price can try to test the double bottom support.
Always do your analysis before taking any trade.
Flag
HDFC Bank: Deep Bull Flag Testing Major SupportHDFC Bank made a strong upward move from 726.65 to 820.05. This forms the pole of the pattern. Since then, the price has been moving down inside a clear parallel channel, which forms the flag.
The Deep Correction
This flag is much steeper and deeper than a textbook pattern. The price has dropped back down to 733.15, which means it gave back almost all the gains from the first move.
While a normal bull flag is usually shallow, this deep drop is still valid if we look at it as an Elliott Wave 2 correction. Wave 2 corrections often retrace deeply, as long as they do not break the starting point of the move.
Trading Levels
Invalidation Level: 727.00. If the price closes below this green line, the entire bullish setup is wrong.
Trigger: A clean breakout above the top blue line of the descending channel.
Target: Beyond 825.05.
Conclusion
Because the price is sitting very close to the invalidation line, the risk is small and the potential reward is large. We are waiting for a breakout to confirm that the upward trend is starting again.
Disclaimer
I am not a SEBI registered investment advisor. This post is for educational and informational purposes only. It is not financial advice or a recommendation to buy or sell any stock. Trading involves financial risk, and you should consult a certified financial advisor before making any investment decisions.
Himadri Speciality Chemical (Weekly)Himadri Speciality Chemical (Weekly)
After spending several months in a broad consolidation range between ₹430–₹500, Himadri has finally delivered a strong breakout backed by exceptional volume expansion.
The breakout above ₹535 has shifted the market structure firmly in favor of the bulls. Price is now testing the ₹676 resistance zone, which coincides with a previous swing high. A sustained move above this level could open the door for a fresh leg higher toward ₹800 and beyond.
Volume participation has increased significantly during the breakout phase, suggesting institutional interest. RSI is hovering near 70, reflecting strong momentum, although traders should remain alert for short-term consolidation after the recent sharp rally.
Key Levels
🔹 Resistance: ₹676, ₹800, ₹900
🔹 Support: ₹606, ₹535, ₹501
As long as price remains above the ₹535–₹606 zone, the bullish structure remains intact. Any pullback toward the breakout area may offer a healthier setup for trend continuation.
Disclaimer: This analysis is for educational purposes only and should not be considered investment advice. Please do your own research and manage risk appropriately.
#INOX - ATH BREAKOUT WITH FLAG PATTERN FORMATION🚀 Trade Idea: INOX
📍 Setup: ATH BREAKOUT WITH FLAG PATTERN FORMATION IN DAILY TIMEFRAME
📈 Entry: Above ₹1578
🛑 SL: ₹1350
🎯 Targets: ₹1900 / ₹2100
🔵 TECHNICAL SETUP
INOXINDIA has broken out of a Flag & Pole pattern coinciding with an All-Time High breakout on the daily chart. The breakout level now acts as support. Both EMAs are sloping upward with price trading above them. Targets are based on Fibonacci extensions of 1.6x and 2.0x from the base of the pole, projecting ~35% upside from current levels.
🔵Fundamentals
INOX India manufactures cryogenic equipment serving LNG, industrial gases, and cryo-scientific segments across 100+ countries. Q3 FY26 revenue came in at ₹436 Cr (+27.4% YoY), EBITDA at ₹102 Cr (+34.2% YoY) and PAT at ₹68 Cr (+32.4% YoY), with exports contributing 62% of quarterly revenue at ₹271 Cr. The current order book stands at ₹1,457 Cr with fresh inflows of ₹392 Cr in Q3 alone. The company has delivered 22% profit CAGR over the last 5 years and revenue is forecast to grow ~15% p.a. over the next 3 years.
⚠Disclaimer: This is for demonstration and educational purpose only. This is not buying or selling recommendations. I am not SEBI registered. Please consult your financial advisor before taking any trade.
Asian Paints Ltd – Bullish Flag Setup (Hourly Timeframe)Stock: Asian Paints Ltd
Timeframe: 1 Hour
Setup Type: Bullish Flag with Pole
Technical Observation
Asian Paints is currently forming a Bullish Flag pattern on the hourly chart.
A strong bullish pole was created with large green candles supported by rising volume, indicating strong demand.
After the impulsive move, price entered a flag consolidation phase starting from 21st April.
The correction retraced approximately 38.2% Fibonacci level, which is a healthy pullback in an uptrend.
At this key level, a bullish engulfing candle appeared, suggesting buyers are stepping back into the market.
During the flag formation, volume declined gradually, indicating that the move is likely profit booking rather than trend reversal.
📈 Trend Confirmation
Price is trading above the 200 Moving Average, confirming the overall trend remains bullish.
Market structure supports continuation after consolidation.
🎯 Trade Plan
Entry: On breakout of the Bullish Flag (confirmation candle close)
Stop Loss: Below the flag low
Target: Measured move based on pole length projected from breakout point
⚠️ Expectation
If price sustains momentum and breaks above the flag resistance, we can expect a continuation of the uptrend with strong upside potential.
🧠 Conclusion
This setup reflects a classic institutional accumulation and continuation pattern.
Patience is key — wait for a confirmed breakout before initiating the trade.
Bitcoin Ready For StromThe flag pattern is confirmed.
concern is flag is little bit longer than normal.
already trap on higher flag trendline.
Now,
Ready with your setup.
possibility:
1. active flag pattern (too much scary but possible)
2. take support from lower flag trendline (also can trap the seller and make up move)
please do your own research before talking any trade.
I am not financial advisor.
please feel free to ask any questions.
GBPUSD Reversal Zone On Higher TimeframeThe lower timeframes were showing too many fake candles and unclear movements, so I shifted to the 2H timeframe to get a cleaner view of the supply and demand structure. After moving to the higher timeframe, the market structure became much clearer and easier to analyze.
Based on the 2H structure, the market successfully broke the previous high. After the breakout, I identified the nearest supply area and projected it forward from the bearish candle zone. This helped me create a clean reversal zone.
Now the main focus is simple — if the market forms any strong positive candle or bullish confirmation inside this reversal zone, then price could continue moving toward the upside.
At the moment, the structure looks much cleaner compared to the lower timeframes, and the reaction inside the reversal zone will decide the next move.
This analysis is based on the MMC concepts designed by Candle King. A huge amount of credit goes to him — his concepts have helped me understand and solve market structure much more clearly.
RVNL might move UpsideWith market stabilizing , we might see sector rotation and a potential move in railways sector. These are the technical reason/logic to support it.
1) Higher High and higher low formation indicating UPSIDE momentum
2) Trading above 50 & 20 EMA
3) Gap Cover Pending
4) Volume increased in recent days
5) Higher TF in weekly Pole & flag pattern formation
6) Favorable Risk Reward
(Note: I am neither responsible for anyone's profit or loss nor I'm a sebi registered RA, this only for educational purpose. Please do your own due diligence before taking any trades.)
NIFTY INDEX – Technical Research ReportNifty Index is currently forming a Bearish Flag pattern , which is generally considered a bearish continuation setup after a sharp downside move.
Following a strong decline, the index entered a temporary upward consolidation channel, indicating a pause in momentum rather than a reversal. Price is now approaching the lower boundary of the flag structure.
A strong bearish candle closing below the flag support will act as confirmation of the pattern and may indicate continuation of the previous downtrend. In such a scenario, further downside movement in the index can be expected.
Technical Observations:
Bearish Flag continuation pattern
Sharp impulsive decline before consolidation
Resistance placed near 23,800 zone
Weak recovery structure inside rising channel
Breakdown confirmation required on closing basis
Outlook: As long as Nifty trades below the resistance zone and remains inside the bearish flag structure, selling pressure may continue. Confirmation through a decisive bearish breakdown can increase downside momentum in the short term.
Disclaimer: This research is only for educational purposes and not investment advice. Please consult your registered financial advisor before investing. I am only a SEBI Certified Research Analyst.
MTAR Technologies Ltd.MTAR Technologies is showing a powerful earnings breakout, with Q4 FY26 revenue up 67% YoY to about ₹306 crore and PAT up 222% YoY to about ₹44 crore, while FY26 revenue rose to about ₹876 crore and FY26 PAT to about ₹94 crore. Management has also turned more constructive on FY27, raising revenue growth guidance to more than 80%, which makes the fundamental setup look stronger than before.
Fundamental view
Last 4 quarters show a mixed-to-strong acceleration pattern: Q2 FY26 was softer, Q3 FY26 improved sharply, and Q4 FY26 delivered the real breakout in both revenue and profit, indicating operating leverage is now working in the company’s favor.
For the coming quarter and the full year, the key monitorables are execution of the stronger order book, margin sustainability, and whether FY27 can actually convert the raised guidance into consistent quarterly growth.
At the current stage, the business is not just growing; it is re-rating on the back of scale, profitability, and confidence from management guidance.
Technical view
Technically, MTAR has been in a strong trend after the post-results surge, and recent technical dashboards show bullish momentum with RSI near the overbought zone and MACD in positive territory.
That means the stock is strong, but also extended, so dips and retests matter more than chasing blindly.
Recommendation : Buy MTAR Technologies at CMP 6634 with stoploss 5351.00 for targets of 7434.85, 8207.90, 9061.30, 10003.40, and 11000.00.
This is a momentum-plus-fundamental setup, where the reward looks attractive as long as the stock holds above the stoploss and continues to respect the trend.
Disclosure
Disclosure: I am not a SEBI registered analyst/technical advisor. This post is only for educational and informational purposes, not investment advice.
FORTIS Healthcare | Weekly TF | Bull Flag Continuation SetupFORTIS Healthcare Ltd.
Sector: Health Services/Hospital | Timeframe: Weekly | Bias: Bullish
Setup Type: Bull Flag Continuation Setup
FORTIS is showing a strong long-term bullish structure on the weekly timeframe. After a sharp impulsive rally from the rounding bottom breakout zone near 740, the stock entered a healthy corrective phase and formed a classic Bull Flag pattern.
Now price is attempting a breakout from the falling channel, which could trigger the next leg of the uptrend if momentum sustains.
Key Observations:
Breakout of a large rounding bottom pattern
Strong impulsive move followed by controlled correction
Bull Flag formation on weekly chart
Price nearing breakout zone with improving strength
Trade Setup:
Entry Zone: Above 980 weekly closing basis
Stop Loss: 900 (weekly Closing basis)
Target 1: 1100
Target 2: 1600 (based on flag depth projection)
As long as price sustains above the breakout structure, bulls may remain in control. A successful breakout can lead to a strong momentum move in coming months.
If you like the idea, don’t forget to follow and share for more price action setups 🚀
⚠️ This is a technical analysis idea for educational purposes only, not financial advice. Please do your own research before making any trading decision.
Narayana Hrudayalaya - Bullish Flag SetupNarayana Hrudayalaya has recently shown a trend reversal signal after breaking a well-defined downtrend trendline. The breakout was supported by a strong bullish impulse move, indicating a shift from selling pressure to buying strength.
Post breakout, price has entered a Bullish Flag consolidation, where it is moving slightly downward with reduced volume. This type of consolidation typically represents healthy profit booking, not weakness.
Key Observations:
Clear downtrend breakout (Change of Character)
Strong bullish momentum (flag pole)
Low-volume consolidation (flag formation)
Price sustaining above breakout zone
Trade Setup:
Entry: On breakout above the flag resistance
Stop Loss: Below the recent swing low (flag bottom)
Target: Measured move based on pole height
Conclusion:
NH is forming a high-probability bullish continuation pattern. A confirmed breakout above the flag can lead to further upside momentum.
Trade with proper risk management.
WTI CRUDE-Not Falling Its consolidating only?WTI CRUDE:Trading around 110 USD with 1.1% drop and is still trading above all its critical EMAs Viz 20/50/100/200DEMA.
Till it falls below 105 on a closing basis the threat for a break out exists.
It has formed a Flag pattern in 4-Hrly chart and the neckline resistance falls at 113-115
Decesieve close above 113-115 and neckline breakout may trigger a rally towards 125USD(For educational purpose only)
Silver for A-B-C corrective structureAfter a strong impulsive upmove, Silver appears to have entered a corrective phase.
On the daily chart, price seems to be forming an A-B-C corrective structure within a rising channel.
What the chart suggests:
The sharp fall from the top marks the beginning of the correction.
Price then formed a recovery leg toward (B), but it failed to sustain higher.
The current move looks like the (C) leg, where price is drifting back toward the lower channel support and the highlighted demand zone.
Key observation:
As long as price remains weak below the recent swing resistance, this correction may continue toward the lower support region.
The marked red zone becomes important, as it could act as a reaction area if sellers remain in control.
A strong reversal from support may indicate that the correction is complete, while a breakdown could open room for further weakness.
Purely for education and chart study. Not a buy/sell call.
IndusInd Bank – Weekly Bearish Flag Breakdown SetupTitle:
IndusInd Bank – Weekly Bearish Flag Breakdown Setup 📉
Description:
On the weekly timeframe, IndusInd Bank appears to be forming a classic Bearish Flag continuation pattern after a strong impulsive decline.
🔎 Structure on the chart
• A sharp downward move forming the flagpole after the major top.
• Price then entered a rising consolidation channel, which often represents a counter-trend pause in a broader downtrend.
• The structure now approaches a critical confluence zone where the rising trendline support meets horizontal price levels.
⚠️ Why this level matters
This region around ₹820–₹840 is acting as a key decision zone.
A decisive weekly breakdown from this structure could signal continuation of the prevailing bearish momentum.
📊 Technical observations
• Lower highs after the peak
• Rising channel forming a bearish flag
• Price nearing trendline support breakdown
• Volatility compression before potential expansion
🎯 Possible scenario
If the flag breaks down with confirmation, the measured move projection from the flagpole points toward the ₹600 zone, which also aligns with historical support.
📌 Key levels to watch
Breakdown zone: ₹820 – ₹840
Positional support / potential target: ₹600
Patience for confirmation is important, as false breakdowns can occur near trendline structures. Traders should always wait for confirmation and proper risk management, as markets can invalidate patterns.
⚠️ Disclaimer
This analysis is only for educational and chart study purposes. It is not financial or investment advice. Always do your own research and consult a qualified financial advisor before making trading or investment decisions.
🙏 If you find this analysis useful
• Please Boost 🚀 this idea so more traders can benefit
• Follow me for more price action based chart studies
• Feel free to share charts you want me to study in the comments — I’ll be happy to analyze them.
Happy learning and safe trading! 📊
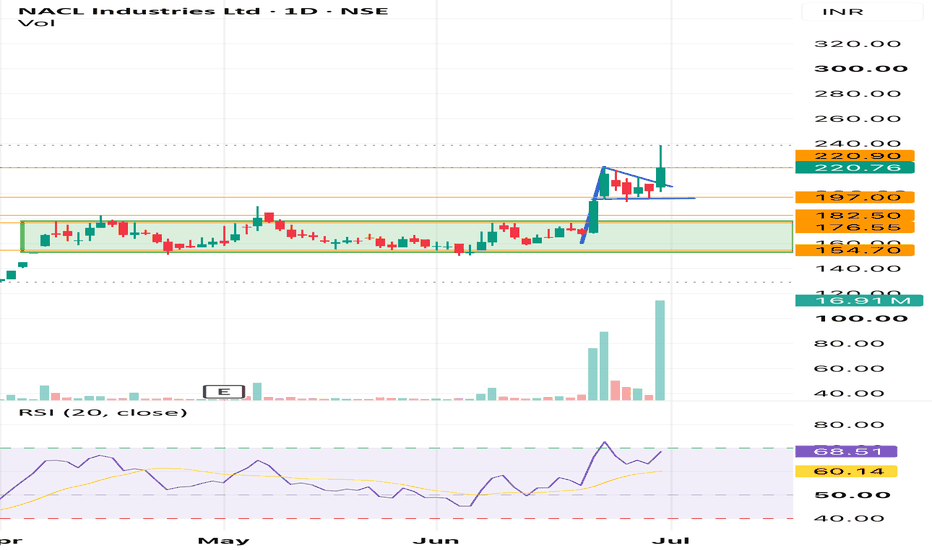
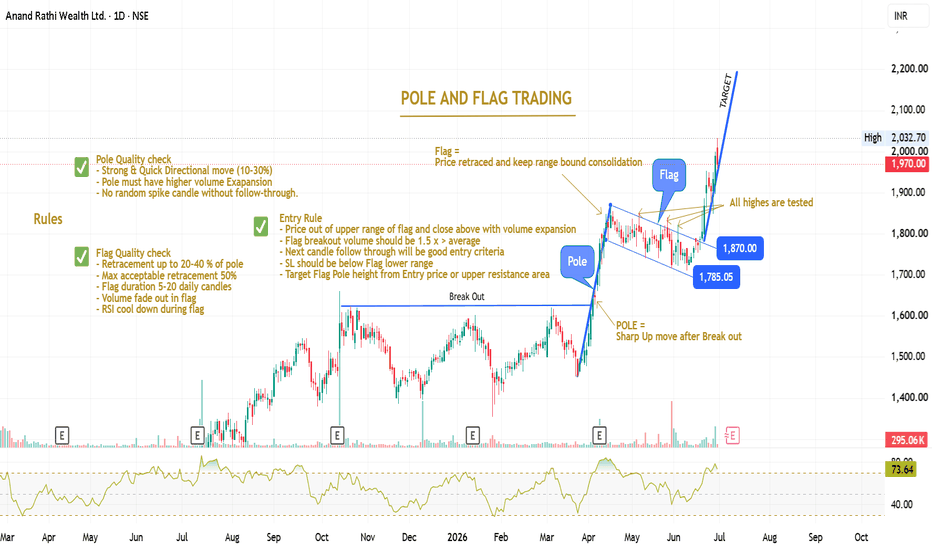
Flag Pole and Pennant - Bullish ContinuationOverview
This chart shows a classic Bullish Pennant pattern forming after a strong impulsive upward move.
• The sharp vertical rise represents the Flag Pole, showing strong buying momentum.
• After this move, price enters a small triangular consolidation, forming the Pennant.
• This consolidation reflects a temporary pause where the market absorbs the previous rally.
⸻⸻⸻⸻⸻⸻⸻⸻⸻⸻
📊 Chart Highlights
• Strong bullish flag pole before consolidation.
• Pennant structure showing tightening price range.
• Price consolidation near the upper zone of the move.
• Breakout zone marked above pennant resistance.
• Pattern supports continuation of the prior uptrend.
⸻⸻⸻⸻⸻⸻⸻⸻⸻⸻
📉 Key Price Action
• The flag pole confirms strong bullish momentum.
• The pennant indicates short-term consolidation after the sharp rise.
• Price is compressing within converging trendlines.
• A breakout above the pennant may confirm bullish continuation.
• Sustained movement above the breakout zone can open the path for further upside.
⸻⸻⸻⸻⸻⸻⸻⸻⸻⸻
📌 Summary
This setup reflects bullish continuation behavior, where a strong rally is followed by consolidation before the next potential move higher. A clean breakout above the pennant would strengthen the bullish case.
⸻⸻⸻⸻⸻⸻⸻⸻⸻⸻
⚠️ Disclaimer
📘 For educational purposes only.
🙅 Not SEBI registered.
❌ Not a buy/sell recommendation.
🧠 Purely a learning resource.
📊 Not Financial Advice
⸻⸻⸻⸻⸻⸻⸻⸻⸻⸻
Shortterm Investment - Buy MindaCorpHere's a breakdown of the **positives for buying Minda Corporation (MINDACORP) as a Short-term investment**:
Apart from the Strong Technical, added the following Fundamentals of the Stock.
**Strong & Growing Financials**
Net profit has risen for four consecutive quarters, growing from ₹52 Cr to ₹85.7 Cr, with an average quarterly increase of around 14.8%. Revenue has also grown for five straight quarters, averaging 5.2% growth per quarter.
**Record Revenue Performance**
The company recently posted a record quarterly revenue of ₹1,560 crores, reflecting a robust 25% year-on-year increase fueled by strong demand across vehicle segments.
**Ambitious Revenue Target**
Minda Corp is targeting ₹17,500 crore in revenue by 2030, implying a 22% CAGR, including ₹4,000–₹4,500 crore from acquisitions. That's a very aggressive growth ambition.
**EV & Future-Ready Business**
Strategic partnerships in EV power electronics are enhancing market access, and recent trade agreements with major economies promise further expansion. The company is also developing advanced driver assistance systems (ADAS) and launching new products.
**Diversified Product Portfolio**
Minda Corporation manufactures a diverse range of automobile components for two and three wheelers, passenger vehicles, commercial vehicles, and off-road vehicles, and operates across India, Asia, Europe, North America, and South America.
**Institutional Confidence**
Institutional investors hold a 27.52% stake in Minda Corporation — a level that typically reflects confidence in the company's fundamentals and governance, as these investors conduct thorough due diligence.
**Short-Long - Term Bullish Trend**
The stock is maintaining a bullish long-term trend, trading above both its 150-day and 250-day moving averages.
**Strong Debt Servicing & Margins**
Quarterly results for December 2025 showed operating profit margin improving to 11.76%, the highest ever recorded for the company.
**A note of caution:** I'm not a financial advisor, and this is not investment advice. The stock currently has a **"Hold" rating** from some analysts, and has seen some short-term price weakness. Always do your own research or consult a SEBI-registered financial advisor before investing.
GOLD PLUNGING TO 4.850-4,890 NEXT WEEK - KEY REASONS!!Current price ~$5,020/oz, strong bearish momentum in play.
Macro factors (simple breakdown):
US rates high + Fed hawkish: Solid US economy, inflation still sticky, strong jobs data → Fed not rushing to cut rates (possibly hold until summer 2026), even more hawkish due to oil spike risks from Iran conflict. Opportunity cost of holding gold explodes (you miss out on yields from USD or bonds).
Money flowing to stocks: US equities (S&P, Nasdaq) hitting record highs → investors chase high-risk/high-reward trades, pulling capital out of gold (safe-haven looks less attractive in a risk-on environment).
Geopolitics cooling: Positive signs from Middle East & Ukraine peace talks → less fear, sharp drop in safe-haven buying demand.
Major buyers slowing: China + India (the two biggest gold purchasers) have significantly reduced buying pace over the last 2 months → no strong "engine" left to push prices higher like before.
Technical: Continuous lower lows, key support broken, Fibonacci + historical support zone pointing exactly to 4,850–4,890.
Advice:
Holding gold: Sell 30–50% right now, wait to buy back ~400 points cheaper.
Want to trade: Short safely from here, target 4,890, use trailing stop.
Newbies: Don't chase buys—wait for the target zone to accumulate gradually.
Protect capital first this week! 💪
Bullish Pennant Chart PatternOverview
A Bullish Pennant is a continuation pattern that forms after a strong upward price movement. It represents a brief consolidation phase where the market pauses before potentially continuing in the direction of the prevailing trend.
The pattern consists of a sharp impulsive rally known as the flagpole, followed by a small symmetrical triangle consolidation called the pennant. When price breaks above the upper boundary of the pennant, it often signals continuation of the uptrend.
⸻⸻⸻⸻⸻⸻⸻⸻⸻⸻⸻
Key Features
• Strong Impulse Move (Flagpole)
A rapid upward price movement creates strong bullish momentum.
• Triangle Consolidation (Pennant)
Price consolidates inside converging trendlines, forming a tight structure.
• Volume Contraction
Trading activity often decreases during consolidation.
• Breakout Confirmation
A breakout above the upper trendline indicates continuation of bullish momentum.
• Measured Move Target
The projected target is often estimated using the height of the flagpole.
⸻⸻⸻⸻⸻⸻⸻⸻⸻⸻⸻⸻
Chart Explanation
1️⃣ Flagpole Formation
Price makes a strong impulsive rally, creating the initial upward momentum.
2️⃣ Resistance Reaction
After the rally, price begins consolidating as buyers temporarily pause and profit-taking appears.
3️⃣ Support Formation
Higher lows develop within the structure, showing buyers are still defending price.
4️⃣ Pennant Structure
Price compresses between descending resistance and rising support, forming the pennant.
5️⃣ Breakout Scenario
A breakout above the upper trendline may trigger continuation toward the projected target zone.
⸻⸻⸻⸻⸻⸻⸻⸻⸻⸻⸻⸻
Observation
• Strong bullish momentum preceded the consolidation.
• Price is compressing within a tightening triangle structure.
• Breakout direction will determine the next phase of the trend.
⸻⸻⸻⸻⸻⸻⸻⸻⸻⸻⸻⸻
Summary
The Bullish Pennant represents a temporary pause within a strong uptrend. If price breaks above the pennant resistance, it may signal continuation of the existing bullish momentum toward higher levels.
⸻⸻⸻⸻⸻⸻⸻⸻⸻⸻⸻⸻
Conclusion
📘 For educational purposes only.
🙅 Not SEBI registered.
❌ Not a buy/sell recommendation.
🧠 Purely a learning resource.
📊 Not Financial Advice.