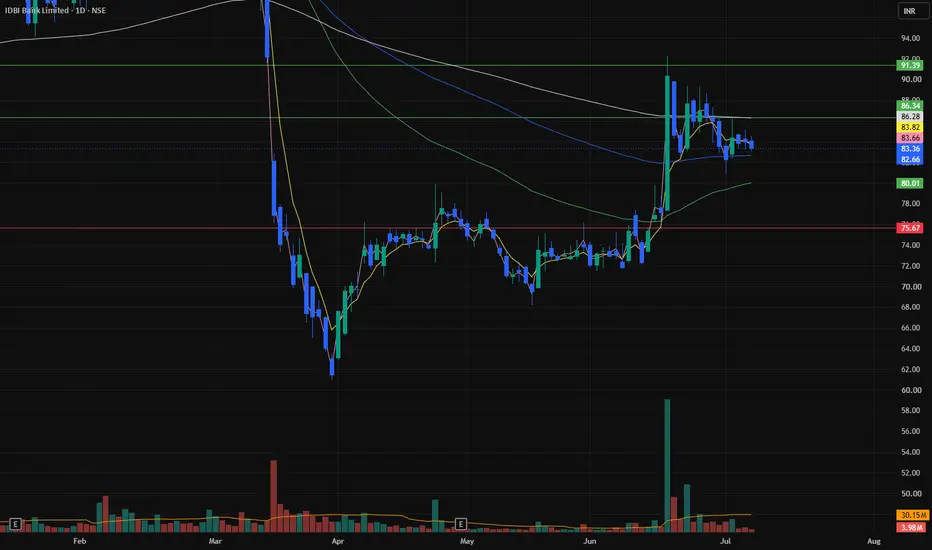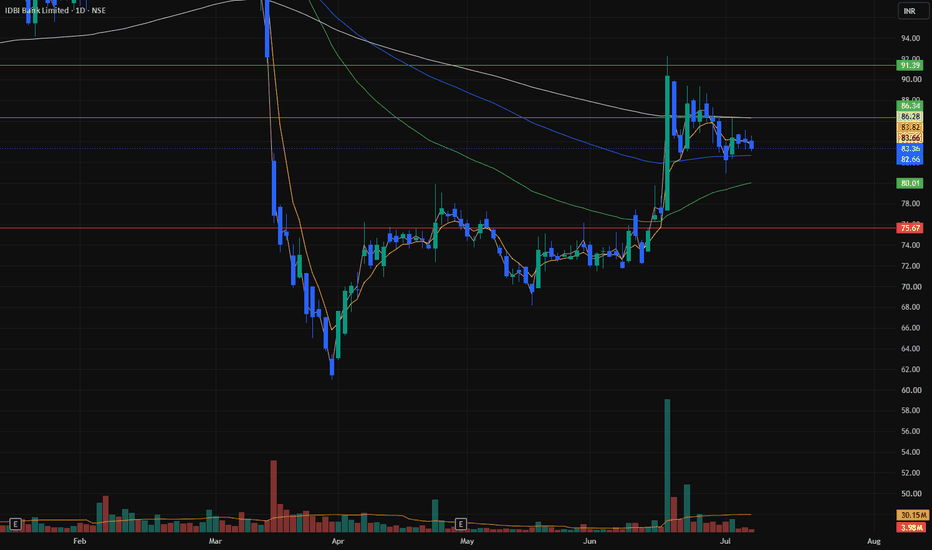
IDBI BANK **IDBI Bank – Medium to Long-Term Investment View**
The stock has already delivered a strong move of approximately **18–20%** and is currently undergoing a healthy retest. Rather than chasing the rally, investors may consider waiting for confirmation before accumulating.
**Accumulation Strategy:**
* **Initial Accumulation:** Above **₹86.30** on a daily closing basis.
* **Add More Quantity:** If the stock closes above **₹91.40**, consider increasing your position.
**Medium to Long-Term Target
Fundamental Analysis
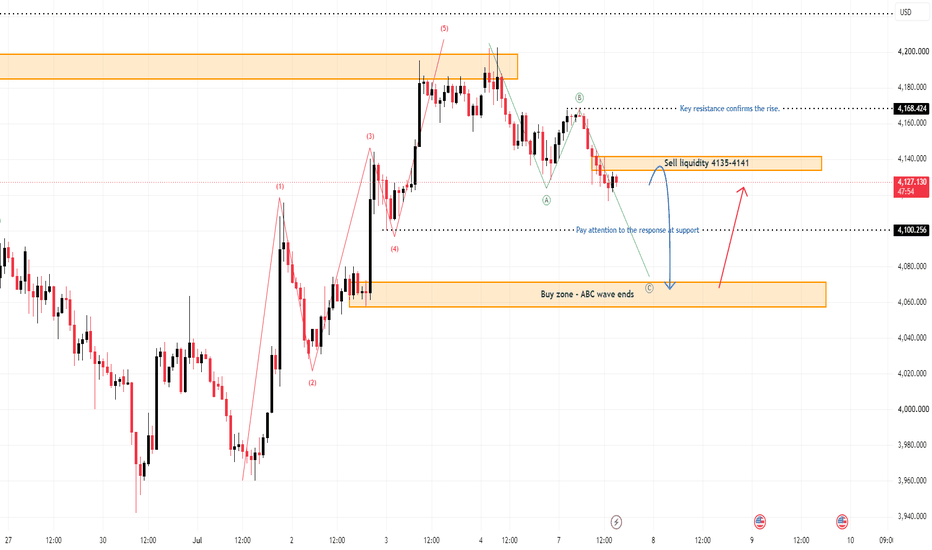
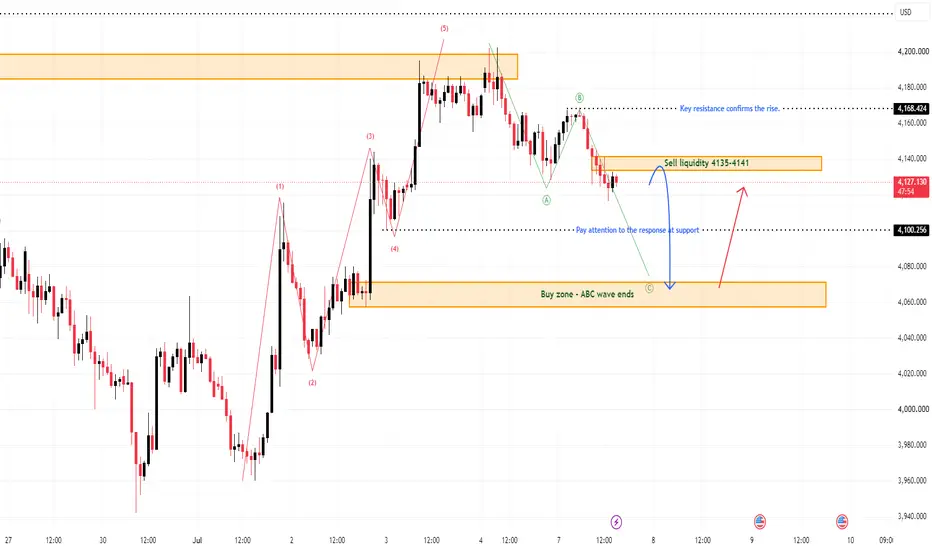
XAUUSD: Wave C pullback may signal next buy setupGold is currently moving inside a corrective ABC structure after the previous strong bullish recovery. From Kelly’s view, price is now developing wave C lower, and the next important setup may appear only when this corrective wave finishes around the support zone.
The key idea is simple: gold is correcting now, but if wave C ends cleanly near support, buyers may step back in for the next recovery phase.
⟡ Market structure
The chart shows gold rejected from the upper resistance area after comp
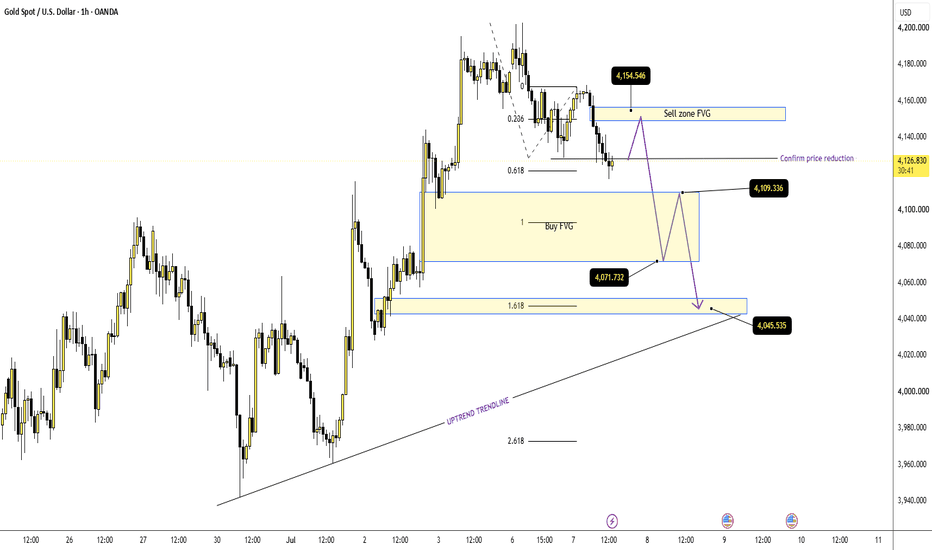
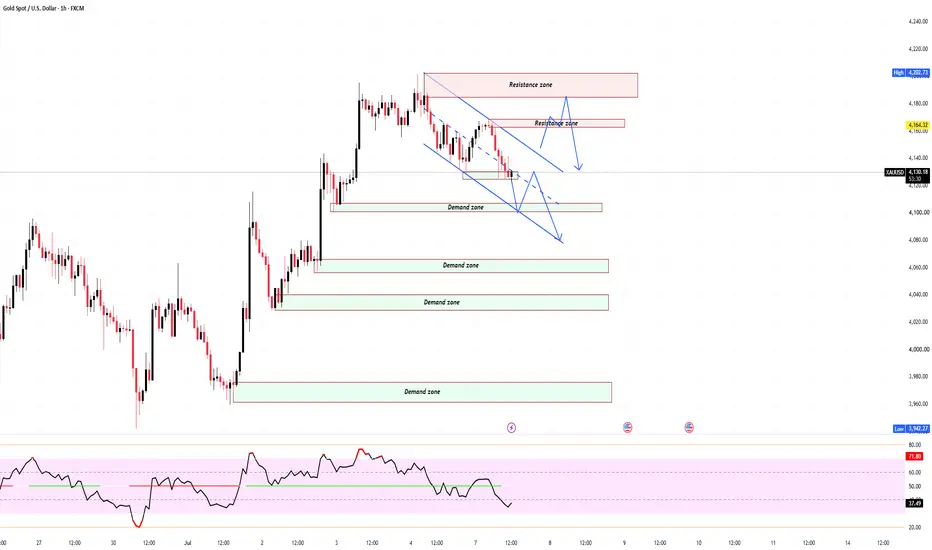
XAUUSD – Gold Is Pulling Back Into A Key Buy FVG Zone XAUUSD – Gold Is Pulling Back Into A Key Buy FVG Zone
Gold is not breaking down yet — it is testing the area where buyers need to prove themselves.
After the recent bullish recovery, price is now correcting from the upper area around 4,150 and trading near 4,126. The market has entered a sensitive zone between the Sell FVG above and the Buy FVG below. This is where the next short-term direction may be decided.
The current chart is not about chasing the move. It is about waiting for reaction.
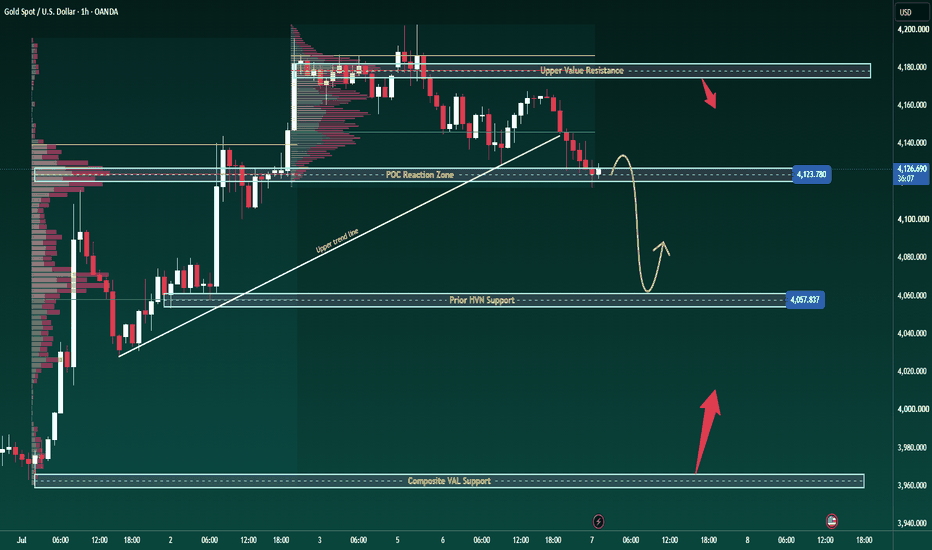
XAUUSD - Gold pullback, buy reaction expected.BRIAN XAUUSD – GOLD PULLBACK FIRST, BUY REACTION LATER
Gold is losing short-term momentum after failing to hold above the upper value area. Price has broken the rising trendline and is now testing the POC Reaction Zone around 4,120 - 4,125.
This does not mean the full bullish structure is dead, but it does show that buyers are no longer in full control at the current level.
The cleaner plan is not to chase buying here. Let price sell first into stronger value support, then watch for the buy r
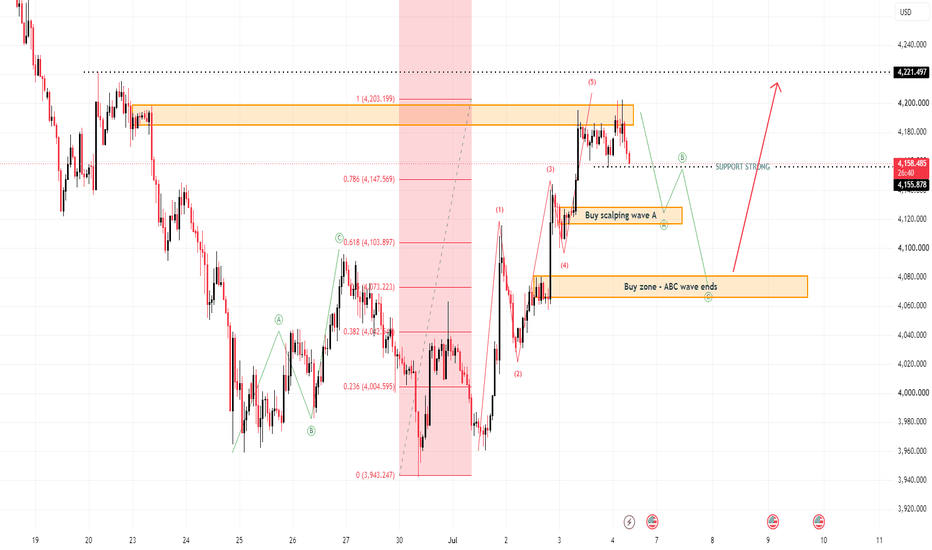
XAUUSD: Recovery Structure Maintains Above SupportGold is still holding a constructive recovery structure after the strong rebound from the lower zone. From Kelly’s view, price has already completed an impulsive recovery leg and is now moving into a corrective phase before the next possible upside move.
The key idea is simple: gold may pull back first, but the bullish recovery structure remains valid while support holds.
⟡ Market structure
The chart shows gold recovered strongly from the lower area near 3,960–3,980, then pushed higher into t
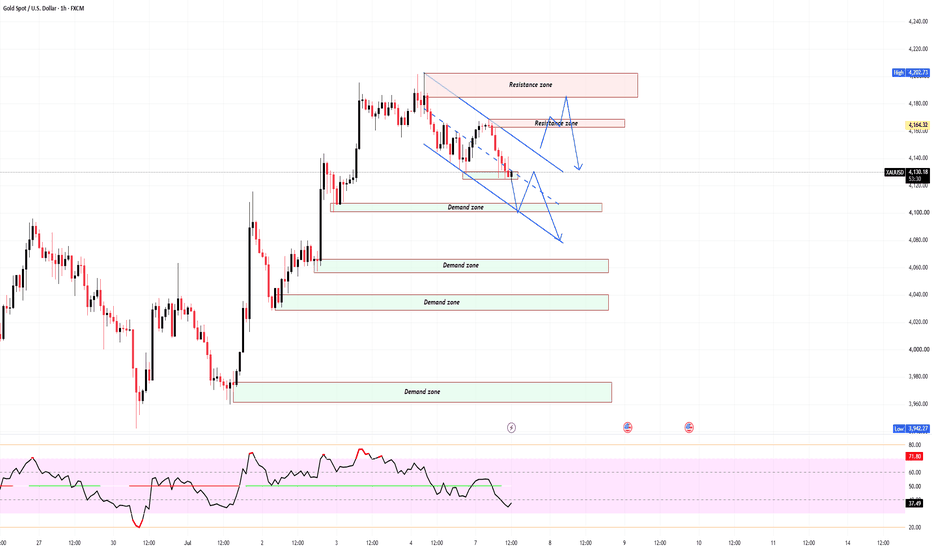
GOLD: Has the Bearish Structure Returned📌 Highlights
• Yesterday’s ISM Services PMI came in below expectations, indicating that the expansion of the services sector is slowing, but it has not yet created an overly negative signal.
• The market is still waiting for more data to confirm the next direction.
• On lower timeframes such as M15–M30, gold has started to form a short-term bearish structure.
📌 Trading Plan
Resistance: 4135–4145 | 4165 | 4185–4200
Support: 4100–4110 | 4060 | 4030
📌 Personal View
✅ Today, the priority is
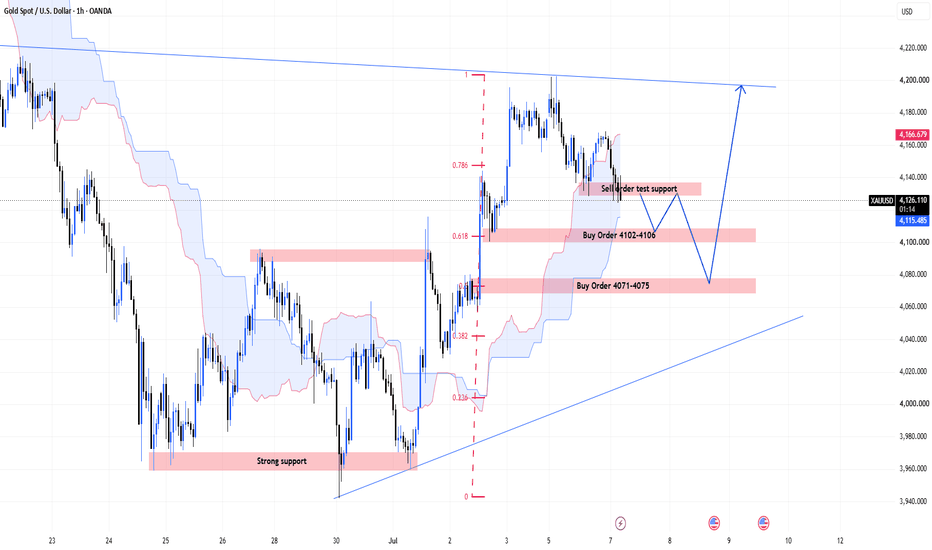
XAUUSD – Gold Corrects Into Fibonacci And Ichimoku Support
XAUUSD is trading around 4,129 after pulling back from the recent high area near 4,190–4,200. The short-term bullish structure is still valid, but price is now correcting into an important Fibonacci and Ichimoku support area.
The priority view remains buy on pullback, as long as gold holds above the key Fibonacci zones and does not break below the rising structure.
Technical View
Gold has created a strong recovery from the previous strong support zone around 3,960. The market moved higher and
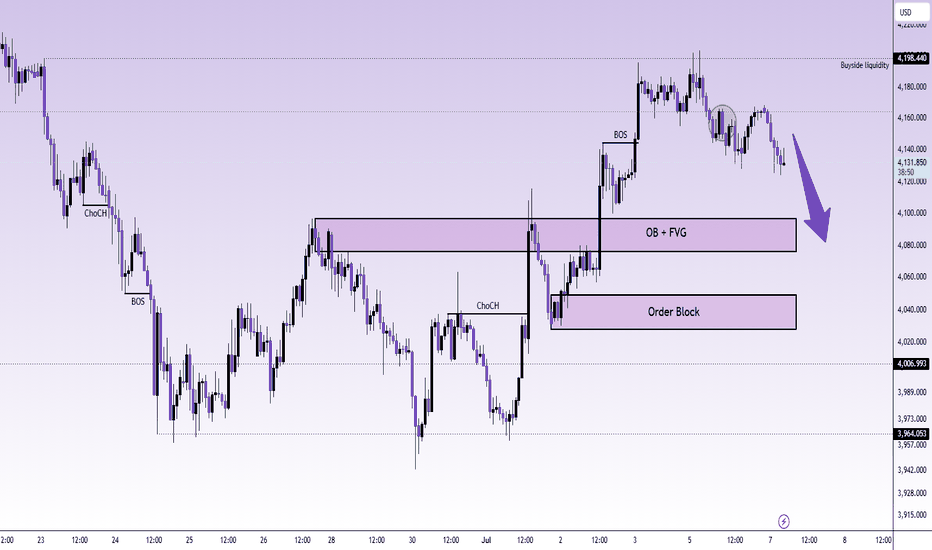
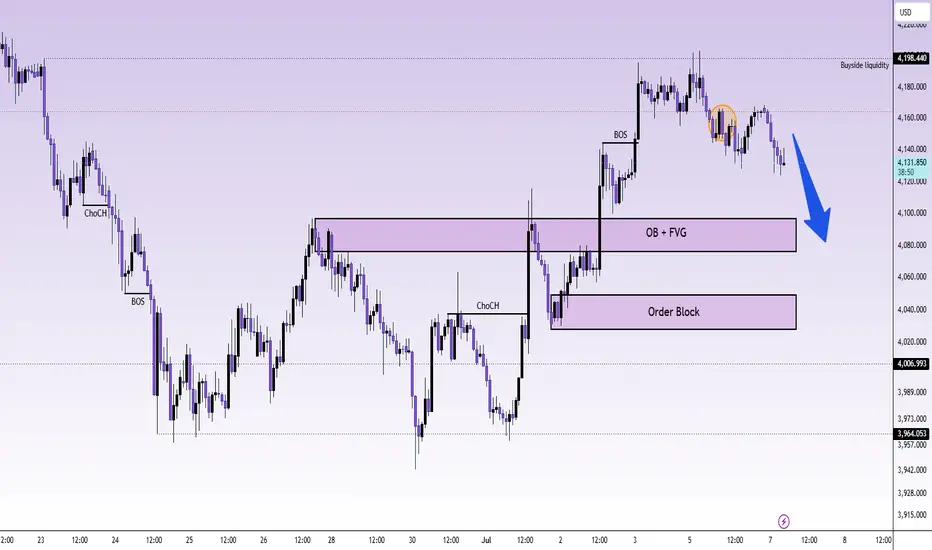
XAUUSD swept 4,198 now watching 4,062 to 4,098 for the next leg XAUUSD swept 4,198 now watching 4,062 to 4,098 for the next leg
Ok gold just did the usual trick. Ran straight up to 4,198.440, grabbed all that buyside liquidity sitting up there. Old play but it still works every time.
Then what happened? That orange candle around 4,158. Indecision written all over it. Long wick up, closed weak. That's not a breakout candle. That's an exhaustion candle.
Here's my read. Structure is still bullish. We had the ChoCH then the BOS, clean shift from bearish to bul
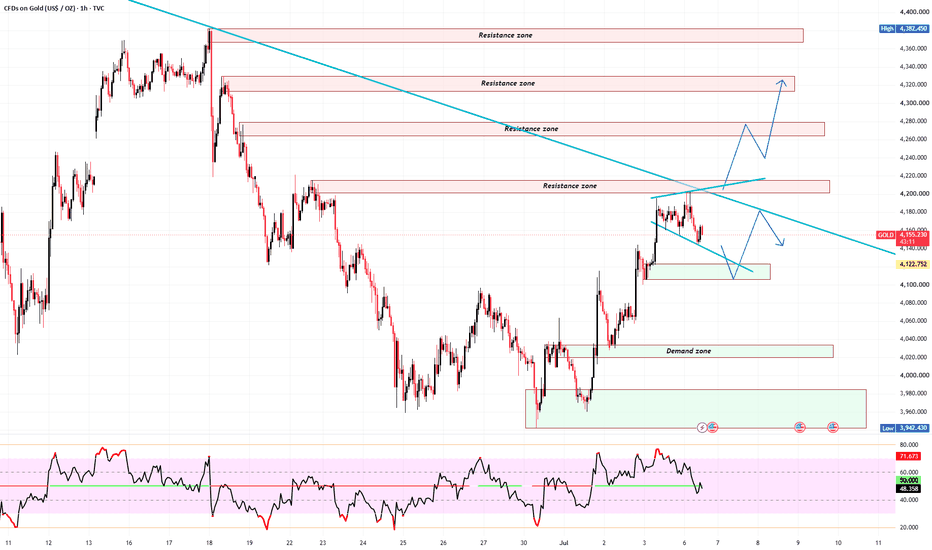
GOLD: Break the Downtrend or Just a Temporary Rebound?📌 Key Highlights
• This week brings fewer major economic releases. The market will focus on the U.S. ISM Services PMI, the June FOMC Meeting Minutes, and Weekly Jobless Claims.
• Bearish: If the Fed maintains its hawkish stance and U.S. economic data remains resilient, the USD could stay strong and continue weighing on gold.
• Bullish: If economic data weakens or the Fed signals a more dovish outlook, gold may extend its recovery.
📌 Trading Plan
Resistance: 4190–4210 | 4260–4280 | 4320–4380
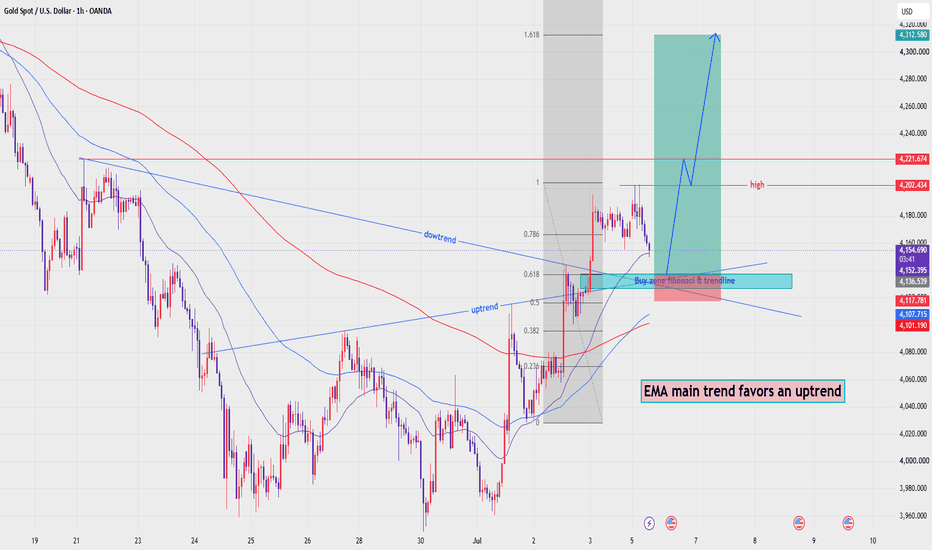
XAUUSD — EMA Uptrend Holds, Buy From Value Zone
Fundamental Analysis
Gold is holding a stronger recovery structure as traders continue to watch USD momentum, Treasury yields, and upcoming U.S. macro data.
For now, the technical structure remains constructive while price holds above the rising EMA support zone.
Technical Analysis
On the 1H chart, XAUUSD is trading around 4,155 after a strong bullish recovery from the lower structure. EMA 34, EMA 89, and EMA 200 are starting to turn upward, showing that buyers are gaining control of the sh
Bank of Baroda (BOB) Looks attractive for Medium to Long Term• **Investment Outlook**: Bank of Baroda is fundamentally attractive but technically weak short-term.
• **Fundamental Analysis** (Long-Term: Positive ⭐⭐⭐⭐☆):
- **Valuation**:
- P/E ratio around 7.
- Price-to-Book ratio approximately 0.84–0.85x.
- Dividend Yield about 3%.
- **Earnings Growth**:
- Q4 FY26 net profit up 11% YoY.
- Net Interest Income (NII) growth of about 9% YoY.
- Q1 FY27 credit growth reported at around 17% YoY.
- **Asset Quality**:
- Declinin
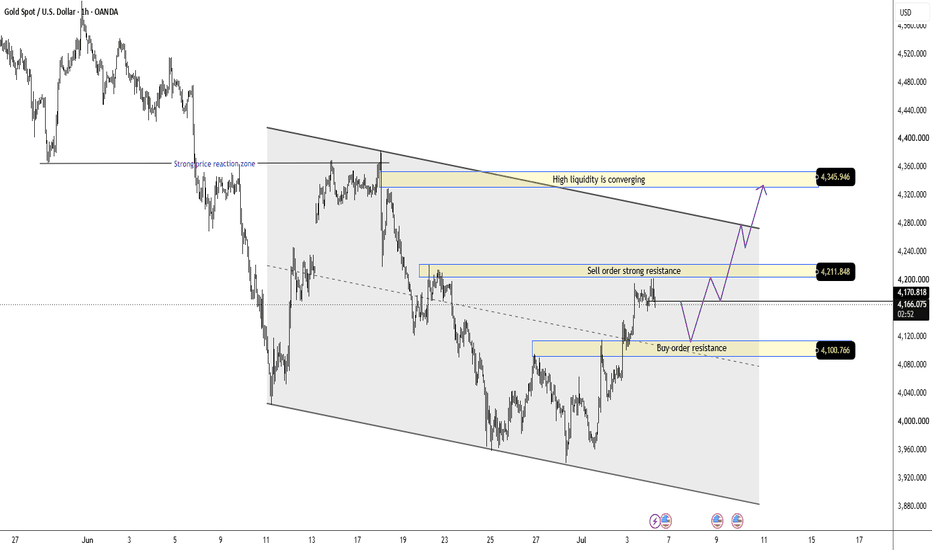
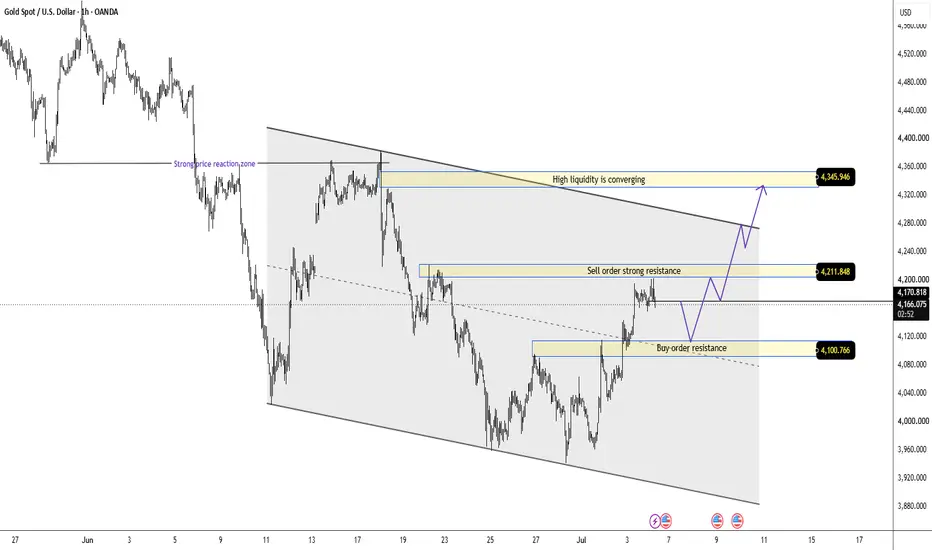
XAUUSD – Gold Is Recovering, But 4,211 Will Decide The Weekly XAUUSD – Gold Is Recovering, But 4,211 Will Decide The Weekly Direction
Gold is starting the week with a stronger recovery tone.
After reacting from the lower area near 3,960 – 4,000, price has continued to climb back above the short-term buy order zone and is now trading around 4,162. The recovery is becoming clearer, but gold is still moving inside a broader descending channel.
This means the market is improving, but not fully bullish yet. The next key test is the 4,211 resistance zone.
FU
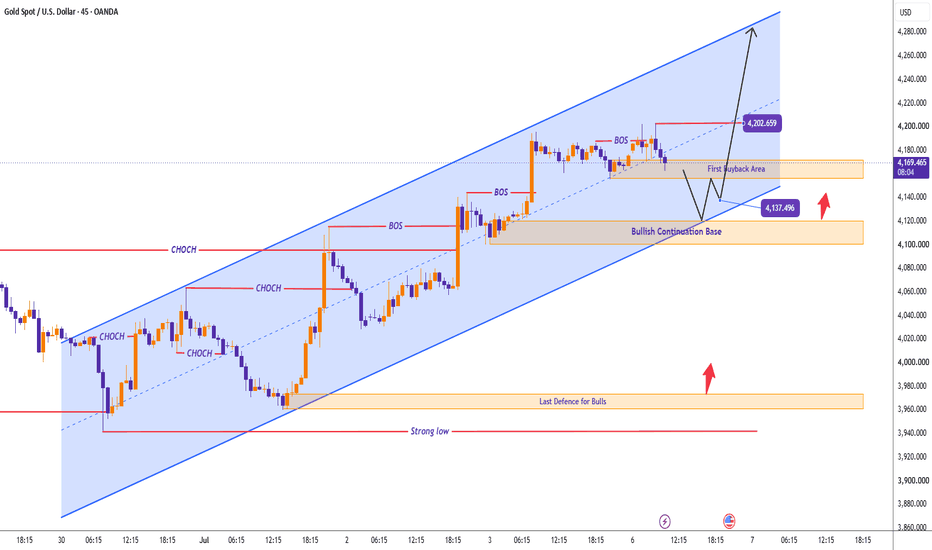
XAUUSD: Bulls Control the Channel, But 4,202 Must Break XAUUSD: Bulls Control the Channel, But 4,202 Must Break
Market Context
Gold starts the new week with a stronger tone after recovering from the recent multi-month low. A softer US Dollar and lower expectations of further Fed rate hikes are giving buyers more room to push price higher.
The market is no longer trading like a pure sell-on-rally structure. Buyers have reclaimed momentum, but the real test now is whether gold can break above the next liquidity target around 4,202.
The main story i
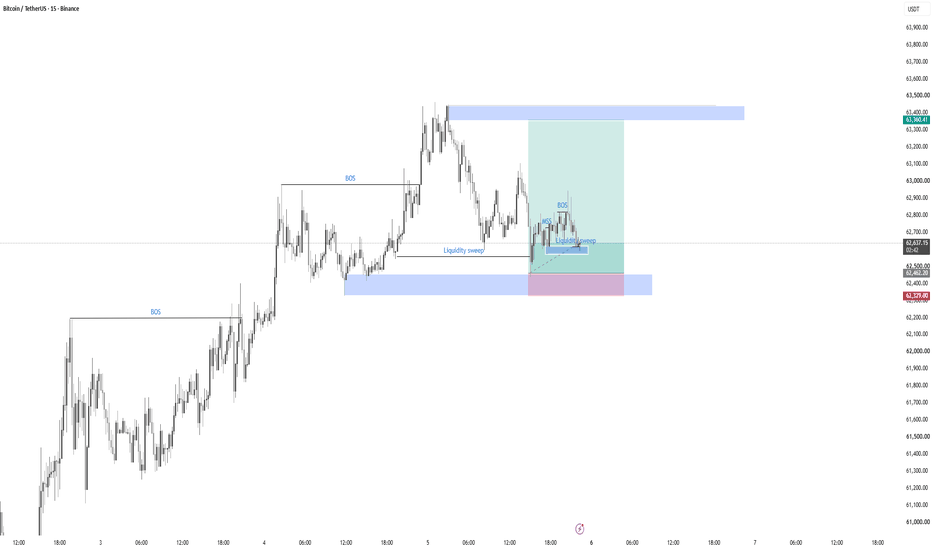
BTCUSDT 15M | Liquidity Sweep + Market Structure Shift + Demand Trade Idea
Price has been trading in a bullish market structure, printing consecutive BOS (Break of Structure) before reaching a premium supply area. After tapping the highs, buyers failed to continue the expansion and the market delivered a strong bearish displacement.
The sell-off swept liquidity resting below the recent equal lows before price found support inside a 15-minute demand zone. From this demand, the market formed a Market Structure Shift (MSS) on the lower timeframe, signaling th
Fall in CG Power and Technical Levels
CG Power's decline on July 3, 2026 attributed to policy news, sector-wide selling, and profit booking, not fundamental company issues.
Government policy change**: Indian government's decision allows certain Chinese-linked manufacturers to bid on government tenders, raising competitive concerns for domestic firms.
Sector-wide sell-off: Major capital goods and power equipment stocks declined, indicating a broader market sentiment rather than issues specific to CG Power.
Profit booking: CG Pow
XAUUSD Daily Chart Analysis (SMC + Price Action)📊 Market Bias
Bearish overall, bullish pullback.
🔑 Key Levels
Resistance: 4170–4185
Support: 4050–4070
Major Liquidity: 4380
💧 Liquidity Zones
Buy-side: Above 4380
Sell-side: Below 4050
🎯 Entry Setup
✅ Buy above 4185 after confirmation.
✅ Sell after bearish rejection from 4170–4185.
🛑 Stop Loss
Buy: Below 4170
Sell: Above 4200
🎯 Targets
Buy: 4250 → 4320 → 4380
Sell: 4100 → 4050 → 3880
⚖️ Risk : Reward
1 : 3
📈 Trade Probability
🟢 Bullish: 40%
🔴 Bearish: 50%
⚪ Neutral: 10%
⚠️ Retail Trap
Don'
XAUUSD: Weekly recovery may continue from buy zone.Gold is showing a stronger recovery structure after reacting from the lower area near 3,960–4,000. From Kelly’s view, the market is now trying to build a bullish continuation setup for next week, with price holding above the buy zone and pushing back towards the Fibonacci target area.
The key idea is simple: gold still needs confirmation, but the current structure supports a potential recovery move if the buy zone continues to hold.
⟡ Market structure
The chart shows gold completed a strong b
TITLE: Gold Taps 4,241 Supply — Trap for Buyers or Real BreakoutTITLE: Gold Taps 4,241 Supply — Trap for Buyers or Real Breakout? (65 characters)
DESCRIPTION:
Gold just pulled off a move that looks impressive on the surface but makes me raise an eyebrow underneath. After basing out near 4,023–4,040, buyers stepped in hard, carved out a clean rising channel, broke structure, and backed it up with a ChoCH — the textbook setup that convinces everyone a fresh bullish leg is underway. But look at where this leg is actually landing: right into the 4,200–4,241 shel
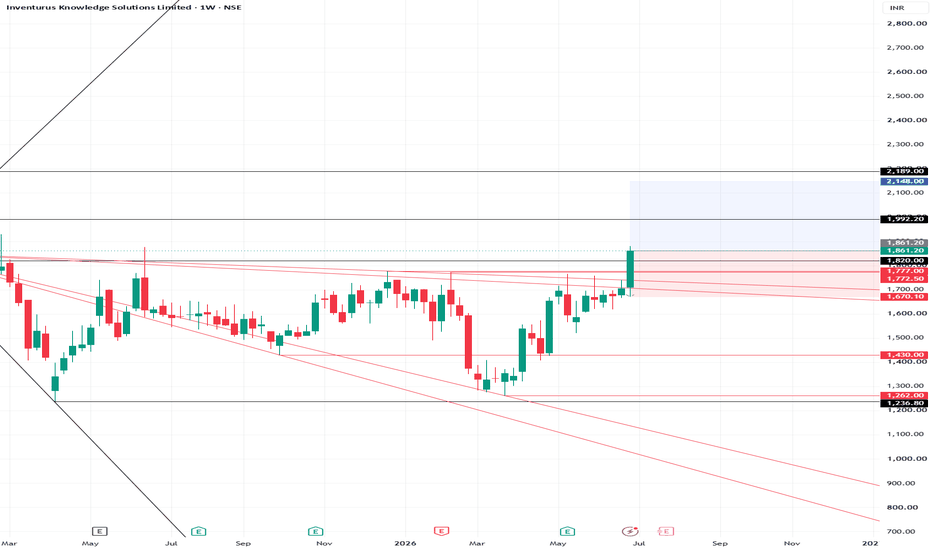
Inventurus Knowledge Solutions Ltd (Long)Inventurus Knowledge Solutions Ltd (IKS) – Quick Analysis
Fundamentals ✅
📈 Sales CAGR (5Y): 42%
💰 Profit CAGR (5Y): 34%
🚀 TTM Profit Growth: 49%
💎 ROE consistently around 40%
📊 Operating Margin recovered to 34% in TTM
🏦 Reserves have grown significantly, indicating strong wealth creation
💳 Debt increased due to expansion but has started declining
🌍 FIIs & DIIs are steadily increasing their stake
👨💼 Promoter holding remains strong at 63.72%
Technical Setup 📊
Weekly chart showing a strong bul
XAUUSD H4 — pullback into 4,090-4,150 zone, watching 4,310 next XAUUSD H4 — pullback into 4,090-4,150 zone, watching 4,310 next
Ok gold did it again. Dumped hard through that whole descending channel late May into June, tapped the demand zone 4,030-4,090 like five separate times and just refused to break. That's not luck. That's absorption, plain and simple.
Then it happened — ChoCH printed, structure broke to the upside, BOS confirmed, and price ripped straight into the 4,310-4,390 order block. Textbook move honestly.
Now we're pulling back. Sitting right
MASON XAUUSD – Gold Tests Trendline And Ichimoku Value Area
XAUUSD is trading around 4,175 after a strong recovery from the recent support zone. However, the bullish structure has not been fully confirmed yet because price is now testing the descending trendline and the Ichimoku value area.
For next week, the priority view is to watch for sell confirmation around the trendline resistance zone, especially if gold fails to break and hold above 4,187–4,198.
Technical View
Gold has recovered strongly from the 3,960 support area, but the current move is st
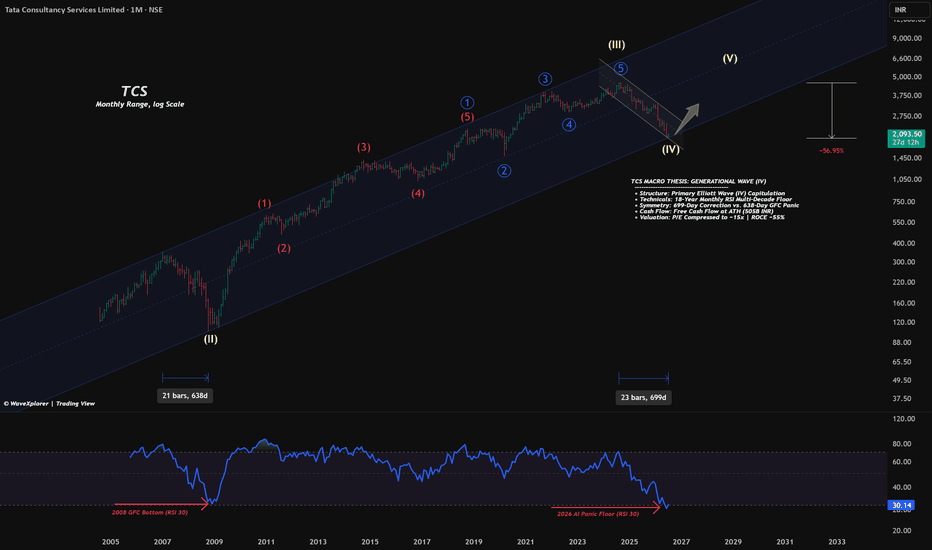
TCS: Are we witnessing the birth of a new bull market?Right now, the sentiment around TCS is completely broken. Everyone on news channels and social media is convinced that Generative AI will kill Indian IT, and retail investors are panic-selling out of sheer fear. The stock has corrected 57% from its peak, and the mood is incredibly bearish. But if you zoom out to the multi-decade monthly chart, this extreme panic is usually exactly where the next big cycle begins.
The legendary investor Sir John Templeton once said, "Bull markets are born on pe
XAUUSD — Bullish Structure Holds Above EMA Value ZoneXAUUSD — Bullish Structure Holds Above EMA Value Zone
Fundamental Analysis
Gold is holding a stronger recovery structure as traders continue to watch USD momentum, Treasury yields, and upcoming U.S. macro data.
For now, the technical structure is improving. As long as price holds above the EMA value zone, the bullish continuation scenario remains favoured.
Technical Analysis
On the 1H chart, XAUUSD is trading around 4,179 after a strong recovery from the lower structure near 3,970 - 4,020.