XAUUSD: Buyers Have One Chance at 3,962 XAUUSD: Buyers Have One Chance at 3,962
Market Context
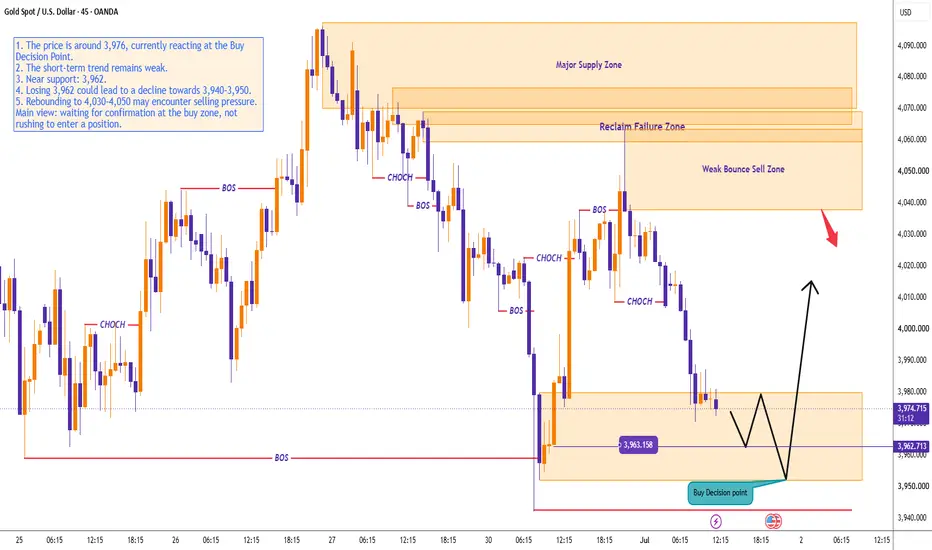
Gold is trading near 3,976 and reacting directly from the Buy Decision Point. The short-term structure remains weak, but this is the area where buyers must show up if they want to stop the current decline.
The main story is simple: gold is not bullish yet, but the downside move is reaching a reaction zone. Buyers may attempt a short-term rebound, but if 3,962 fails, the market can quickly open toward 3,940 - 3,950.
Technical Structure
G
Fundamental Analysis
XAUUSD – Gold Is Recovering, But Sellers May Defend Higher XAUUSD – Gold Is Recovering, But Sellers May Defend Higher
Yesterday’s view followed the market structure well as gold continued lower before finding a reaction from the lower zone.
Today, gold is trying to recover from the recent low and is now trading around 4,029. The short-term structure has improved after price created a strong bounce and moved back above the nearby FVG area.
However, this is still a recovery move inside a broader bearish context. The key question now is simple: can buye
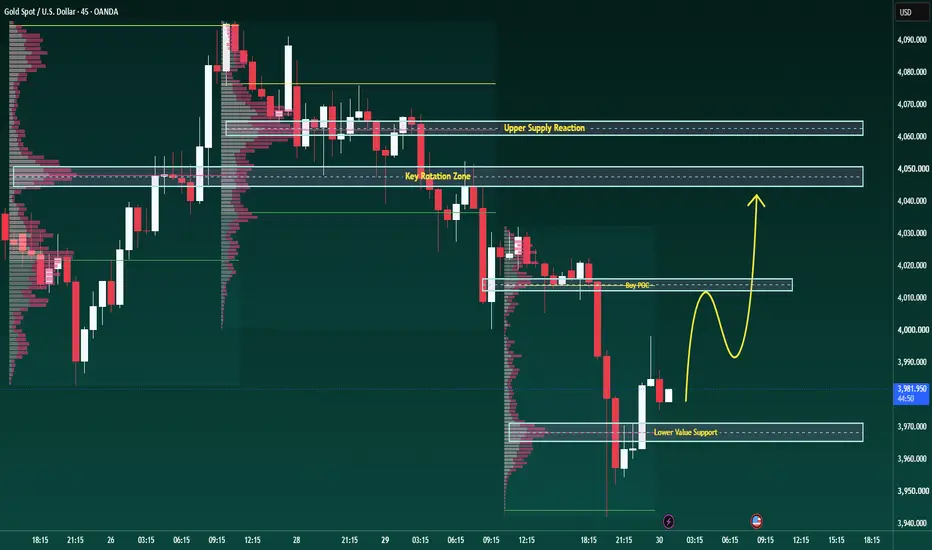
GOLD HIT LOWER VALUE, NOW THEBRIAN XAUUSD – GOLD HIT THE LOWER VALUE, NOW THE REAL TEST BEGINS
Yesterday’s structure played out cleanly. Gold rejected from the upper value area, broke lower, and moved directly into the lower value support zone.
Now the market is no longer in the same position.
Gold is trading near the lower value area around 3,965 - 3,970 after a strong bearish rotation. This is where late sellers can get trapped if price starts to build acceptance above the low. But it is also where weak buyers can fail
XAUUSD: The Quarterly Close Trap Is LIVE — Do NOT Fall For It!Market Condition : Extreme Institutional Volatility / Execution Requires Extreme Patience
Bias: Neutral-Bullish Trigger (Stay Sidelined for the Pullback)
We have a massive technical convergence playing out right now. Today, June 30th, we are witnessing a simultaneous Monthly and Quarterly candle close.
Days like today do not follow normal retail patterns. Large hedge funds, central banks, and institutional algorithms are actively engaged in "Window Dressing"—rebalancing their books and chasi
Ather Energy listed at ₹321 in Apr 2025🚨 280% in ONE YEAR — and most people missed it.
Ather Energy listed on NSE in April 2025 at just ₹321 per share.
No hype. No tips group. No viral thread.
Just a clean, steady uptrend — from IPO day itself.
Today it touched ₹1,098. 🔥
This is exactly why I always watch new listings carefully.
The chart always tells the truth before anyone else does.
Did you spot this one? Drop a 👇 below.
#AtherEnergy #NSE #StockMarket #IndianStocks #IPO2025 #MultiBagger #TradingView #StocksTips #ElectricVehicle
BRIAN XAUUSD – GOLD REMAINS STRONG DESPITE FEARBRIAN XAUUSD – GOLD IS NOT WEAK BECAUSE OF FEAR, IT IS WEAK BECAUSE BUYERS CANNOT HOLD VALUE
Gold begins the new week in a very uncomfortable position.
The market had every reason to attract safe-haven flow, but price still failed to build a strong recovery. That tells me one thing: fear is not controlling this chart. Value is.
Last week, gold tried to rebound from the lower area, but buyers could not keep price above the key intraday value zone. The auction is still heavy. Every recovery att
XAUUSD: Overdue Retracement vs. LTF Chop (Stay Sidelined!)Current Market State: Wait and See (Stay Sidelined)
If you look at the daily chart, Gold has cleanly taken out the recent June lows 4023 (the xxx line) and is sitting around $4,062.89.
By standard chart rules, Gold is heavily overdue for a retracement (a temporary bounce up). It needs to go up to retest our Daily POI box (~$4,135–$4,200) before it can make its next big move down.
But here is why we CANNOT just buy right now:
Monday Lower Timeframe Chop: On the smaller timeframes (like t
Aye Finance Uptrend Setup with Strong Quarterly NumbersAye Finance Ltd – Daily Chart Analysis
Stock: Aye Finance Ltd
Timeframe: Daily
CMP: Around ₹175
Aye Finance is currently trading in a clear short-term uptrend. The stock is holding above the rising trendline support and trading near the marked breakout/support zone around ₹166–₹175.
The chart structure looks positive as price is forming higher highs and higher lows. The stock is also trading above key moving averages, which supports the bullish momentum.
Fundamentally, the company has report
Pace Digitek Weekly Setup: Trendline Support + Strong Order BookPace Digitek Ltd – Weekly Chart Analysis
Stock: Pace Digitek Ltd
Timeframe: Weekly
CMP: Around ₹200
Pace Digitek is currently trading near an important resistance/supply zone around ₹200–₹220. The stock has taken support from the lower demand zone earlier and is now moving upward with rising trendline support.
The stock is trying to sustain above the trendline, and a breakout above the ₹200–₹220 zone with strong volume can confirm further bullish momentum.
Fundamentally, the company also has
GOLD: Technical Rebound or Preparing for the Next Downtrend?📌 Key Highlights
• Gold starts the week on a bearish note after four consecutive weeks of correction.
• This week's key events include the Qatar negotiations, Fed Chair Kevin Warsh's speech, and the U.S. Non-Farm Payrolls (NFP) report.
• The U.S. dollar remains strong, while the Fed continues to maintain a hawkish stance, keeping pressure on gold prices.
📌 Trading Plan
Resistance: 4095 | 4125 | 4198 | 4210
Support: 4030 | 3985 | 3965 | 3920
📌 Personal View
✅ The broader trend remains bea
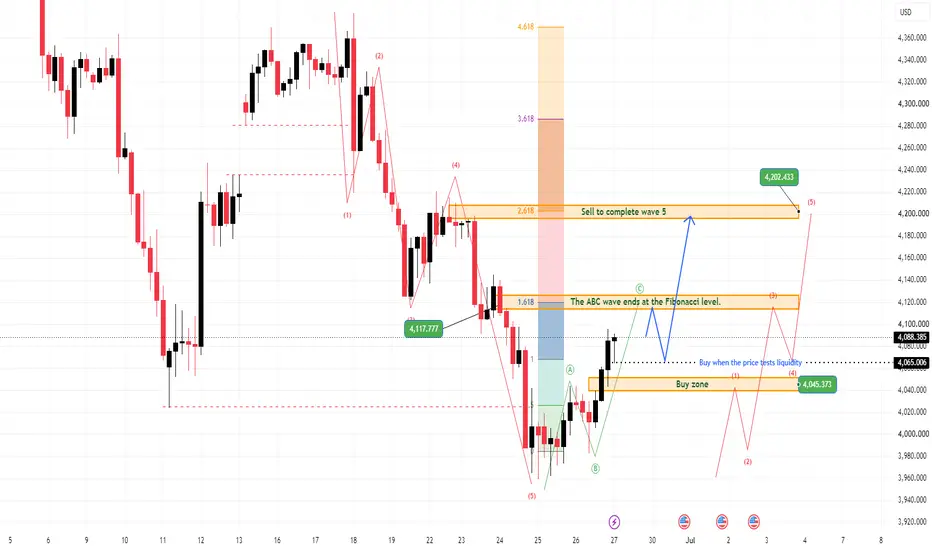
XAUUSD: Weekly ABC recovery ongoing.◈ XAUUSD: Weekly ABC Recovery Is Still Developing
Gold is showing a corrective recovery after reacting from the lower base around 3,980–4,000. From Kelly’s view, the current structure is developing as an Elliott ABC recovery, with price now holding above the 4,042 buy zone and trying to build momentum for the next upside leg.
The key idea is simple: the broader trend is still fragile, but the short-term recovery structure remains valid while gold holds above the buy zone.
⟡ Market structure
XAUUSD: Weekly ABC Recovery from Buy ZoneGold is starting the new week with a corrective recovery structure after reacting from the lower liquidity area near 3,950–4,000. From Kelly’s view, the current move is developing as an Elliott ABC recovery, but the chart also leaves room for a stronger 5-wave upside scenario if buyers continue to defend the buy zone.
The key idea is simple: gold has already reacted from the lower base, and the next weekly direction depends on whether price can hold above the liquidity retest zone.
⟡ Market st
Trading Myths Busted #4: Stop Hunts Aren't PersonalOne of the most common beliefs among traders is that the market is deliberately trying to hit their stop-loss. After getting stopped out, price often moves in the expected direction, making it feel like someone was watching their trade. While it can certainly feel personal, the reality is much less dramatic.
Markets don't know who you are or where your individual stop-loss is placed. Large participants simply look for areas where liquidity is concentrated. Once you understand this, you'll spend
stock name: L&TEntry
₹4,200–4,250 (Breakout confirmation)
Stop Loss
₹4,000
Targets
T1 ₹4,500
T2 ₹4,650
Why I Like It
✅ Fresh breakout
✅ Strong volume expansion (about 52% above the 20-day average)
✅ Large-cap institutional favourite
✅ Recent bulk deal buying near the breakout zone
✅ Infrastructure sector remains one of the strongest themes
Expected holding
1–3 weeks
XAUUSD WEEKLY AND DAILY ANALYSISGold is entering one of the most interesting weeks in months.
Technicals are pointing lower...
But the U.S. and Iran conflict has the power to change everything overnight.
Here's what I'm watching:
• If weekend headlines fade, I still give a slight edge to the bears. The higher-timeframe trend remains intact.
• If geopolitical tensions escalate or shipping disruptions intensify, expect safe-haven demand to fuel an aggressive move toward 4150–4220.
The real question isn't whether price reache
GOLD TRYING TO REGAIN VALUE AFTER WEAKNESSBRIAN XAUUSD – GOLD TRYING TO RECLAIM VALUE AFTER A WEAK WEEK
Gold had a heavy week, with sellers controlling most of the structure after price failed to hold the upper value zones. The market pushed lower from the 4,240 area and continued to create lower highs, showing that the broader pressure stayed on the sell side.
However, the final part of the week is starting to show a different reaction. Gold found support from the lower value area and is now trying to recover above the short-term bas
XAUUSD H4 — Liquidity Zones Decide The Next MoveXAUUSD H4 — Liquidity Zones Decide The Next Move
Gold is trading around $4,088 after recovering from the low near $3,958. The short-term reaction is bullish, but the H4 structure is not fully reversed yet. Price is now moving between a lower buy liquidity zone and a higher medium-term sell OB zone, so chasing the middle range is not ideal.
From an SMC perspective, gold created a CHoCH near the lower area and started to push upward. This shows that buyers are trying to defend the lower demand z
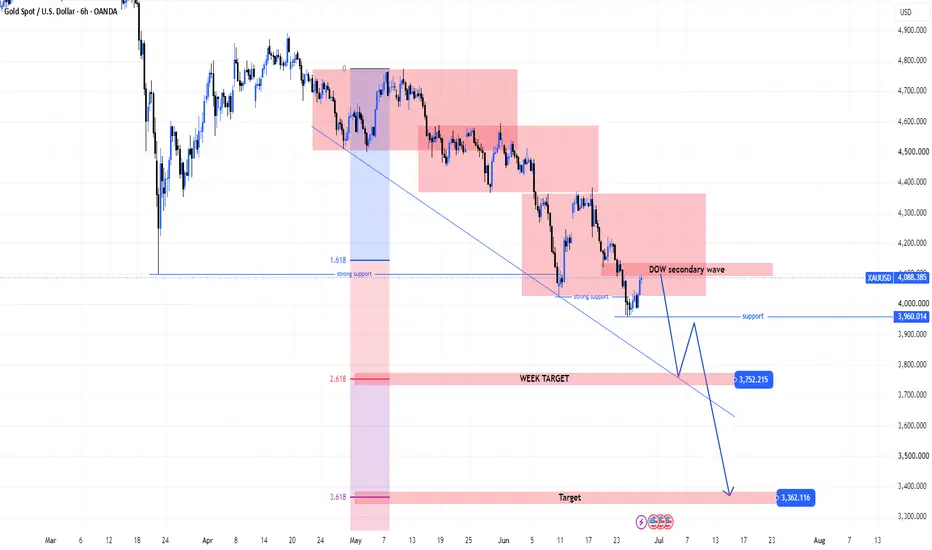
XAU- Medium-Term Bearish Structure Still Targets Lower LiquidityMASON XAUUSD – Medium-Term Bearish Structure Still Targets Lower Liquidity
XAUUSD is trading around 4,088 after recovering from the recent support area. Although gold is showing a short-term rebound, the medium-term structure remains bearish.
The main trend is still down, and any recovery toward resistance should be treated as a corrective wave unless price breaks back above the major supply structure.
Technical View
Gold is still moving inside a broad bearish structure. The chart shows a cle
GOLD: Has 3960 Formed the Bottom or Just a Temporary Bounce?📌 Key Highlights
• Core PCE came in as expected and remained unchanged from the previous reading.
• GDP grew by 2.6%, while jobless claims came in lower than forecast, indicating that the U.S. economy remains strong.
• However, gold closed with a bullish daily candle. This suggests that the market may have already priced in the positive data, and selling pressure is being absorbed at a key support zone.
📌 Trading Plan
Resistance: 4043–4045 | 4080 | 4100 | 4125
Support: 3970–3960 | 3930 | 3
USDJPY is trending at critical levelsUSDJPY (Daily Chart Analysis)
A contraction in the volatility is visible in the uptrend - an ascending wedge pattern is forming - where prices are testing the upper resistance zone
The quantitative analysis
- 3 legs appear in the recent bull phase
- each leg constitutes a rise and then a relatively smaller fall
- the ratio of fall to rise for the first 2 legs is between 68%-70%
-
Now we are expecting a similar fall in USDJPY - that will make the ratio of fall to rise near 70%
For this,
GOLD holding decision zone after.BRIAN XAUUSD – GOLD HOLDING THE DECISION ZONE AFTER A WEAK WEEK
Gold had a difficult week, with price staying under pressure for most of the structure after sellers defended the upper value area. The early part of the week showed clear bearish momentum, pushing XAUUSD lower from the 4,080 resistance area into the lower value base.
However, the second half of the week is now showing a different message. Gold is no longer selling aggressively at the low. Price is compressing inside a rising corr
XAUUSD - Bearish Structure Holds, Sell From OB Remains PriorityXAUUSD — Bearish Structure Holds, Sell From OB Remains Priority
Gold is trading around $4,008 after reacting from the lower range and retesting near the short-term supply area. Although price has shown a recovery attempt, the main structure is still bearish while gold remains below the day high around $4,044 and below the OB sell zone.
From an SMC perspective, gold created a BOS to the downside, then pulled back into a potential OB reaction area. This kind of movement often shows a bearish con
Banknifty Long term view: Near to decision line. Heading 66000 ?Hi All,
Everyone is doing well.
It's a pattern of 4 years from Jun 2022.
A lot of ups and downs but it never out of the channel.
Last few months it tried to break the pattern but it just back to the track and heading to higher highs.
This view will not be useful for deciding intraday but definitely help to decide where is the market in long term or at least in few months where the market is heading.
Despite all the noise market chose to go higher levels and tentatively by this November it
XAUUSD — EMA Bearish Trend, Fibonacci Confluence Target in Focus
Fundamental Analysis
Gold remains under pressure as price continues to trade below the main EMA structure. Traders are still watching USD momentum, Treasury yields, and upcoming U.S. macro data.
For now, the technical structure still favours sellers while recovery attempts remain weak below EMA resistance.
Technical Analysis
On the 2H chart, XAUUSD is trading below EMA 34, EMA 89, and EMA 200. This confirms that the short-term trend remains bearish, with the EMA structure acting as dynamic