Parag Milk Foods (D): GAP-UP BREAKOUT & TREND CONFIRMATIONTimeframe: Daily | Chart Scale: Linear
Explosive +10.88% surge today backed by a massive 21.72M volume spike! ๐ฅ
Technical Highlights:
โ
Breakout: Gapped up, cleared & closed above long-term angular resistance (active since Nov '25).
โ
Trend: Forming Higher Lows since Mar '26โbullish structure confirmed!
โ ๏ธ Caution: Given the huge 11% move, watch out for near-term profit booking.
โ
Momentum: Perfect EMA alignment (Daily/Weekly/Monthly). MACD & RSI rising. ๐
Key Levels to Wa
Stocks
PDS Ltd (D): MASSIVE SURGE & RESISTANCE TESTTimeframe: Daily | Chart Scale: Linear
Explosive +11.85% surge today backed by a sudden 13.83M volume spike! ๐ฅ
Technical Highlights:
โ
Trend: Forming Higher Lows since Mar '26โbullish structure intact!
โ ๏ธ Major Test: Breached a long-term horizontal resistance (Jun '25) intraday but couldn't secure the close.
โ
Volume: Sudden massive surge snaps a dry volume spell.
โ
Momentum: EMAs in positive crossover (Daily/Weekly). MACD & RSI rising. ๐
Key Levels to Watch:
๐ฏ Target: 4
R Systems: Monthly Converging Trendlines & a High-Volume AreaApoorv Dubey | SEBI Registered Research Analyst
A simple price action observation using the monthly timeframe:
On R Systemsโ chart, two converging trendlines help frame the broader structure:
-The upper red line connects major highs and marks a descending resistance reference.
-The lower red line tracks the rising support area.
-Price has recently reacted near the lower boundary and remains within the broader structure shown.
-The volume bars show substantial activity in recent months around th
A Simple Strategy to Build Your Trading Edge Before 2027Apoorv Dubey | SEBI Registered Research Analyst
Many traders are experiencing losses in this market, while others who follow a tested strategy may be having a strong year. What often makes the difference is having a processโand the discipline to follow it.
In this educational video, I use the Trident chart as an illustration to explain a simple price action strategy and how to think about building an edge. The focus is on the strategy, rather than an analysis of the company.
For educational p
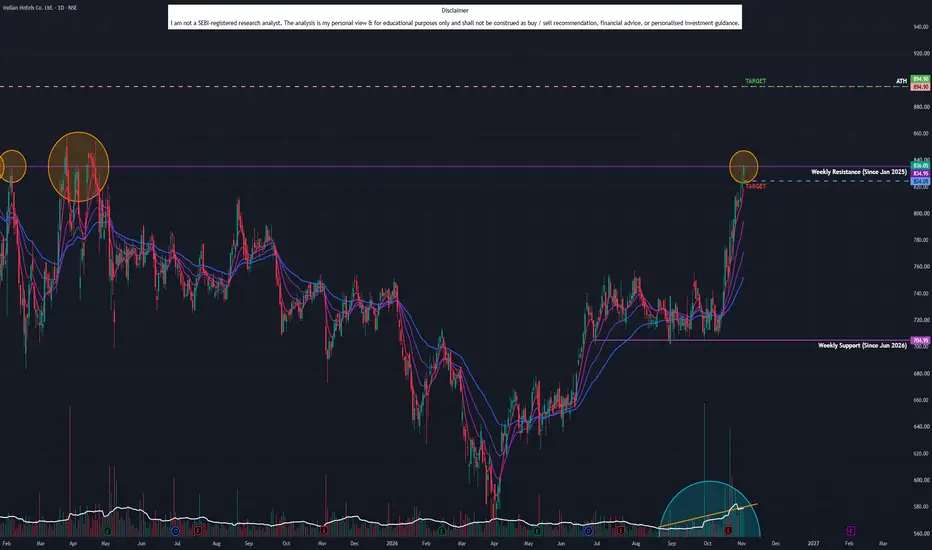
Indian Hotels (D): LONG-TERM HORIZONTAL BREAKOUTTimeframe: Daily | Chart Scale: Linear
Constructive +1.65% daily advance backed by a solid 4.68M volume! ๐ฅ
Technical Highlights:
โ
Breakout: Cleared & closed above a major long-term horizontal resistance (active since Jan '25).
โ
Volume: Steady rising volume over the past several weeks confirms heavy buyer accumulation.
โ
Momentum: Perfect alignment! EMAs in positive crossover (Daily/Weekly/Monthly). MACD & RSI rising. ๐
Key Levels to Watch:
๐ฏ Target: 895
๐ก๏ธ Support / Pullba
Nelcast: From Historical Supply to a New Price StructureApoorv Dubey | SEBI Registered Research Analyst
Nelcastโs monthly chart shows a sequence of historical supply, a breakout, a return to the zone and the development of a new structure.
1. Start with the supply zone
The red band marks an area where price encountered resistance on earlier occasions. The reactions labelled โSupplyโ and โSupply 2โ make it a useful historical reference.
2. Observe the breakout and return
Price later moved above the band, returned to the area and then advanced again
AAPL: $351 Rejection | $316 Buy Setup Ahead of EarningsApple NASDAQ:AAPL is trading near $341, down around 1% after facing rejection at the $351 resistance level. The company is expected to release its Q4 earnings after the US market closes on Monday, November 2, making the upcoming earnings announcement a major catalyst for price volatility.
Apple's fundamentals remain strong, with its latest quarterly revenue reaching $109.4 billion (+16% YoY) and EPS increasing 29% to $2.02. Analysts expect approximately $113.4 billion in Q4 revenue and $1.99
4 Stock Charts + Reliance: Price Action & RSI AnalysisApoorv Dubey | SEBI Registered Research Analyst
In todayโs TradingView video, I analyse four stock charts alongside Reliance, todayโs market hero. Using price action, RSI and my market experience, I explain how I read chart structure and momentum.
For educational purposes only. This video is not a recommendation to buy, sell or hold any security.
Menon Bearings (D): MASSIVE SURGE & RESISTANCE TESTTimeframe: Daily | Chart Scale: Linear
Explosive +12.64% surge today backed by a massive 3.62M volume spike! ๐ฅ
Technical Highlights:
โ
Breakout: Exited its recent sideways trend with serious momentum.
โ ๏ธ Major Test: Pushed into a short-term horizontal resistance (Sep '26) but couldn't secure the close.
โ
Volume: Rising volume confirms heavy buyer accumulation.
โ
Momentum: EMAs in positive crossover (Daily/Weekly/Monthly). ๐
Key Levels to Watch:
๐ฏ Target: โน398 (Contingent
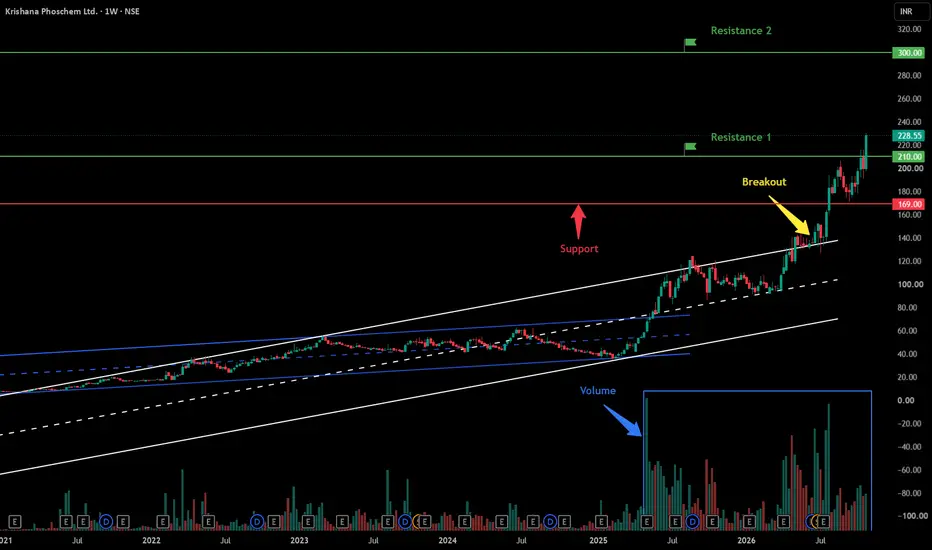
Krishana Phoschem Ltd - Breakout Setup, Move is ON...#KRISHANA trading above Resistance of 210
Next Resistance is at 300
Support is at 169
Here is previous chart:
This weekly chart for Krishana Phoschem Ltd. displays a strong bullish breakout from a consolidation pattern, supported by significant volume and long-term trendline context.
Chart Overview
Timeframe & Asset: Krishana Phoschem Ltd. (1-Week Chart, NSE).
Current Price: 228.55 INR (+14.47% change shown on the chart header).
Key Technical Observations
Horizontal & Chan
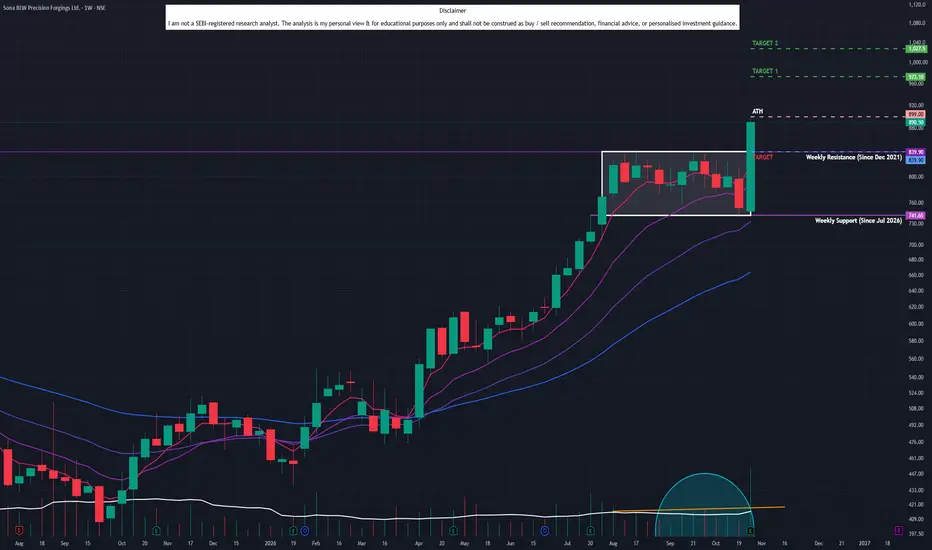
Sona BLW Precision Forgings (W): ALL-TIME HIGH BREAKOUTTimeframe: Weekly | Chart Scale: Logarithmic
Explosive +18.28% weekly surge backed by a huge 32.21M volume spike! ๐ฅ
Technical Highlights:
โ
Breakout: Cleared & closed above a sideways rectangular consolidation (active since Jul '26).
โ
Price Discovery: Printed a fresh ATH at โน899! ๐
โ
Volume: Massive volume surge confirms heavy buyer accumulation.
โ
Momentum: EMAs in positive crossover (Daily/Weekly/Monthly). MACD & RSI rising.
Key Levels to Watch:
๐ฏ Target 1: โน973
๐ฏ Tar
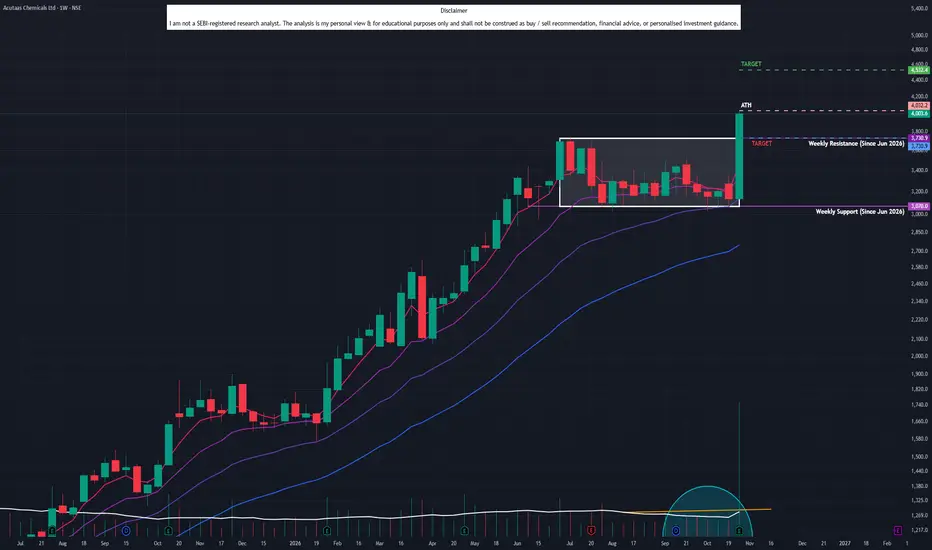
Acutaas Chemicals (W): ALL-TIME HIGH BREAKOUTTimeframe: Weekly | Chart Scale: Logarithmic
Explosive +27.60% weekly surge backed by a huge 12.35M volume spike! ๐ฅ
Technical Highlights:
โ
Breakout: Cleared & closed above a sideways rectangular consolidation (active since Jun '26).
โ
Price Discovery: Printed a fresh ATH at 4,032.2! ๐
โ
Volume: Massive volume surge confirms heavy buyer accumulation.
โ
Momentum: EMAs in positive crossover (Daily/Weekly/Monthly). MACD & RSI rising.
Key Levels to Watch:
๐ฏ Target: 4,535
๐ก
Sakuma Exports (W): MACRO BOUNCE & MASSIVE SURGETimeframe: Weekly | Chart Scale: Logarithmic
Explosive +36.88% weekly surge backed by a huge 39.17M volume spike! ๐ฅ
Technical Highlights:
โ
Reversal: Bounced off a massive 2008 macro support & pierced last week's bearish candle!
โ
Breakout: Cleared horizontal resistance (Aug '26).
โ ๏ธ Major Test: Battling a stubborn angular resistance (Apr '25) but couldn't secure the close.
โ
Momentum: Daily EMAs in PCO (Weekly soon). MACD & RSI rising. ๐
Key Levels to Watch:
๐ฏ Target: 3
Aarti Drugs (D): HORIZONTAL BREAKOUT & TRENDLINE TESTTimeframe: Daily | Chart Scale: Linear
Explosive +11.35% surge today backed by a massive 11.57M volume spike! ๐ฅ
Technical Highlights:
โ
Breakout: Cleared & closed above short-term horizontal resistance (active since Nov '25).
โ ๏ธ Major Test: Pushed above a long-term angular resistance (Aug '20) intraday, but couldn't secure the close.
โ
Volume: Rising volume confirms heavy buyer accumulation.
โ
Momentum: Weekly EMAs in positive crossover. MACD & RSI rising. ๐
Key Levels to
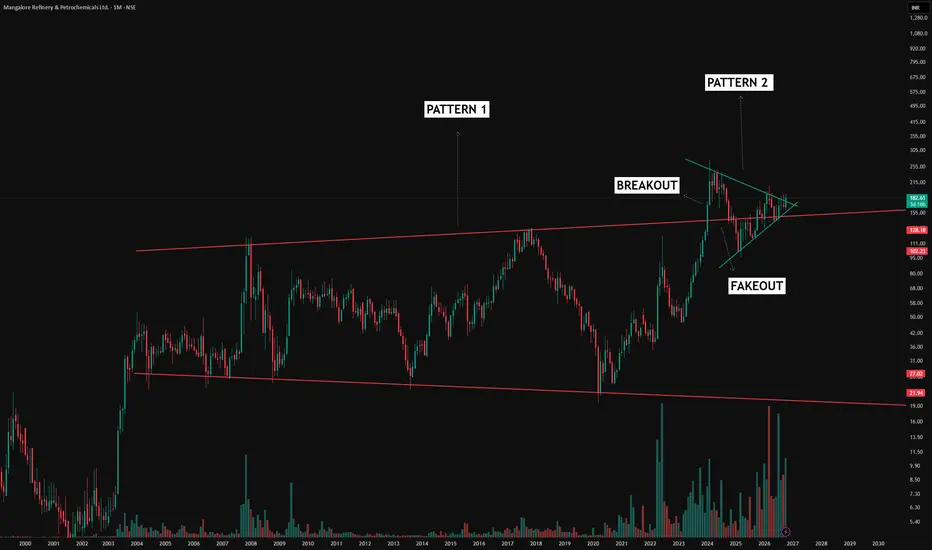
MRPL: From a Broadening Range to a Symmetrical TriangleApoorv Dubey | SEBI Registered Research Analyst
Consolidation does not always look like a neat horizontal range. MRPLโs monthly chart illustrates how it can change in shape, size and duration.
1. The larger structure โ expanding swings
The red boundaries outline a multi-year broadening formation. Although price remained within a larger range, the movements inside it were substantial. A sideways market on a higher timeframe can still contain strong rallies and deep corrections.
2. The breakout
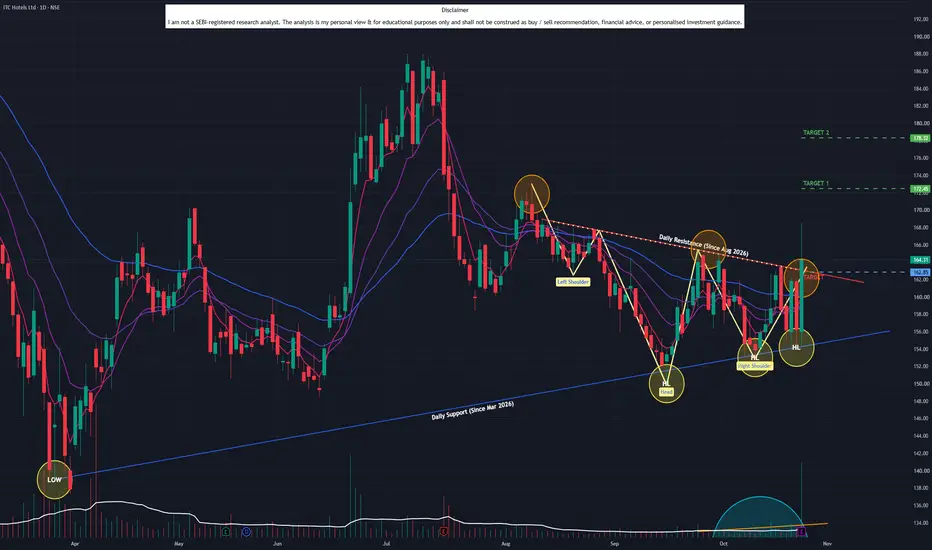
ITC Hotels (D): MAJOR REVERSAL & BREAKOUTTimeframe: Daily | Chart Scale: Linear
Explosive +5.16% surge today backed by a massive 20.01M volume spike! ๐ฅ
Technical Highlights:
โ
Reversal: Confirmed a classic Inverted Head & Shoulders pattern!
โ
Breakout: Cleared & closed above the IHS neckline AND an angular resistance (active since Aug '26).
โ
Volume: Surging volume confirms heavy buyer accumulation.
โ
Momentum: Daily EMA positive crossover. MACD & RSI rising. ๐
Key Levels to Watch:
๐ฏ Target 1: 172
๐ฏ Target 2:
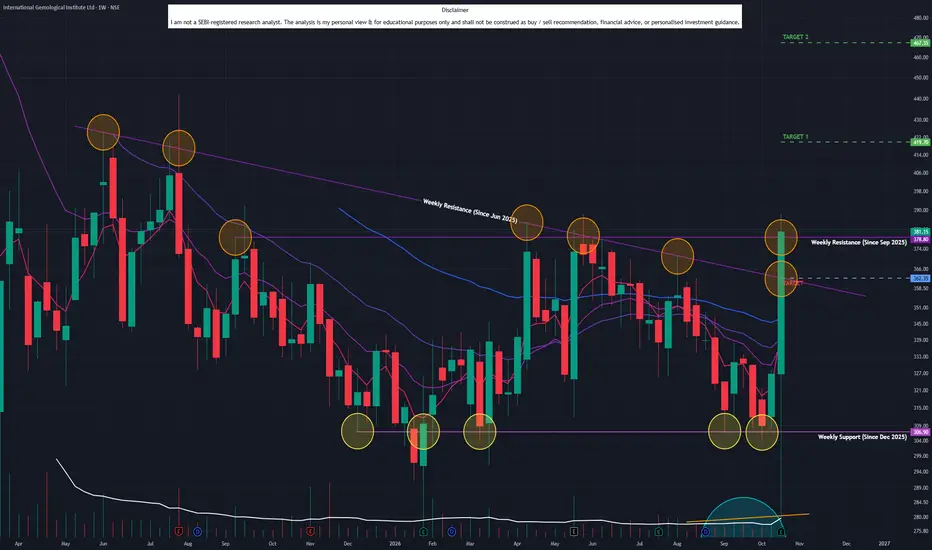
International Gemological Instit (W): DUAL RESISTANCE BREAKOUTTimeframe: Weekly | Chart Scale: Logarithmic
Explosive +16.67% weekly surge backed by a huge 29.73M volume spike! ๐ฅ
Technical Highlights:
โ
Breakout: Cleared & closed above BOTH a horizontal (Sep '25) AND angular (Jun '25) resistance!
โ
Volume: Surging volume confirms heavy buyer accumulation after weeks of failed breakout attempts.
โ
Momentum: Daily EMAs in positive crossover (Weekly soon). MACD & RSI rising . ๐
Key Levels to Watch:
๐ฏ Target 1: 420
๐ฏ Target 2: 467
๐ก๏ธ S
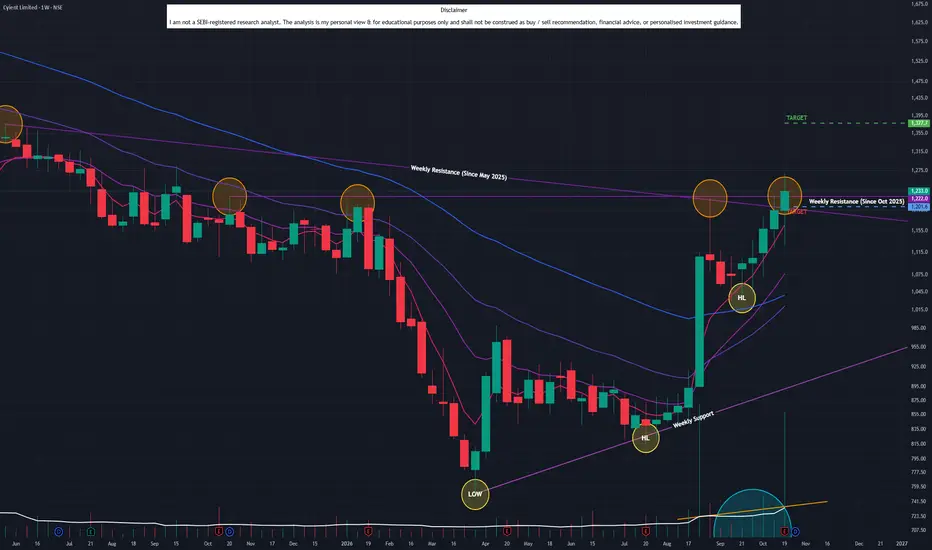
Cyient Ltd (W): DUAL RESISTANCE BREAKOUTTimeframe: Weekly | Chart Scale: Logarithmic
Constructive +3.22% weekly surge backed by a huge 21.11M volume spike! ๐ฅ
Technical Highlights:
โ
Breakout: Cleared & closed above BOTH an angular (May '25) AND horizontal (Oct '25) resistance!
โ
Price Action: Weekly hammer candle + forming Higher Lows = Extremely Bullish!
โ
Volume: Surging volume confirms heavy buyer accumulation.
โ
Momentum: Short-term EMAs in positive crossover (Daily/Weekly). MACD & RSI rising. ๐
Key Levels t
Jindal Poly Films (W): MAJOR RESISTANCE BATTLETimeframe: Weekly | Chart Scale: Logarithmic
Constructive +5.81% weekly surge backed by a huge 8.38M volume spike! ๐ฅ
Technical Highlights:
โ
Breakout: Cleared & closed above long-term horizontal resistance (active since May '23).
โ ๏ธ The Final Hurdle: Testing a stubborn angular resistance (Feb '22) but couldn't secure the close.
โ
Volume: Historic volume surge confirms heavy buyer accumulation.
โ
Momentum: Short-term EMAs in positive crossover (Daily/Weekly/Monthly). ๐
Key Leve
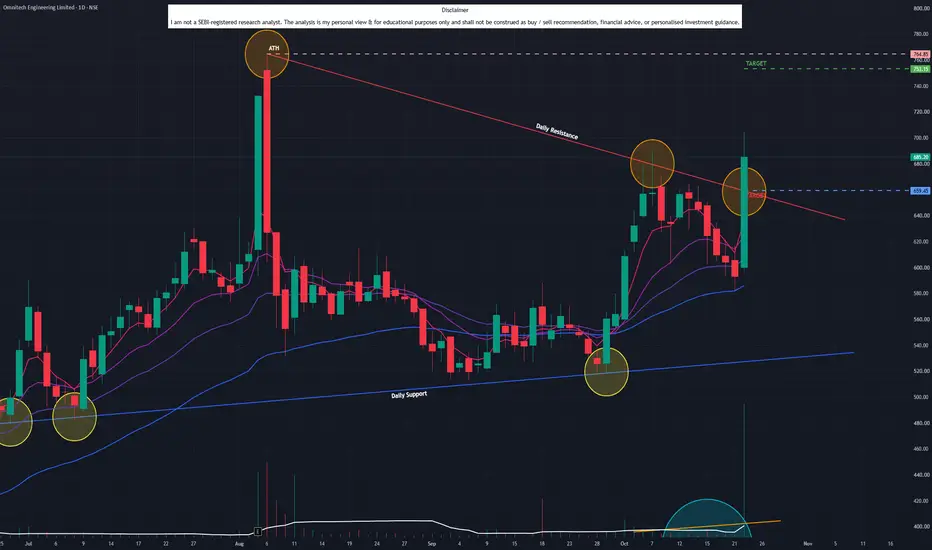
Omnitech Engineering (D): GAP-UP BREAKOUTTimeframe: Daily | Chart Scale: Linear
Explosive gap-up and +15.54% surge today backed by a massive 21.12M volume spike! ๐ฅ
Technical Highlights:
โ
Breakout: Gapped up, cleared & closed above short-term angular resistance (active since Aug '26).
โ
Volume: Rising volume confirms heavy and sustained buyer accumulation.
โ
Momentum: Short-term EMAs in positive crossover (Daily). MACD & RSI rising. ๐
Key Levels to Watch:
๐ฏ Target: 753
๐ก๏ธ Support / Pullback: 659.45 (Previous r
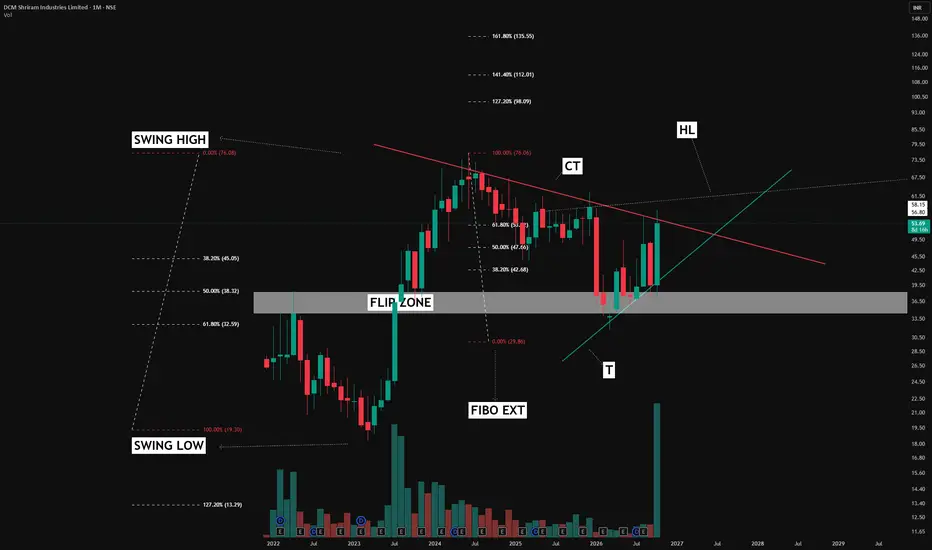
DCM Shriram Industries: Connecting Flip Zones and FibonacciApoorv Dubey | SEBI Registered Research Analyst
A chart becomes more useful when we understand why each line is drawn. This monthly chart illustrates how different analysis tools can connect to build a price-action framework.
1. Start with the flip zone
The grey band marks an area that previously acted as resistance. After price broke above it, the subsequent revisit found support around this region. This change in roleโfrom resistance to supportโis called a flip zone.
2. Mark the swing high
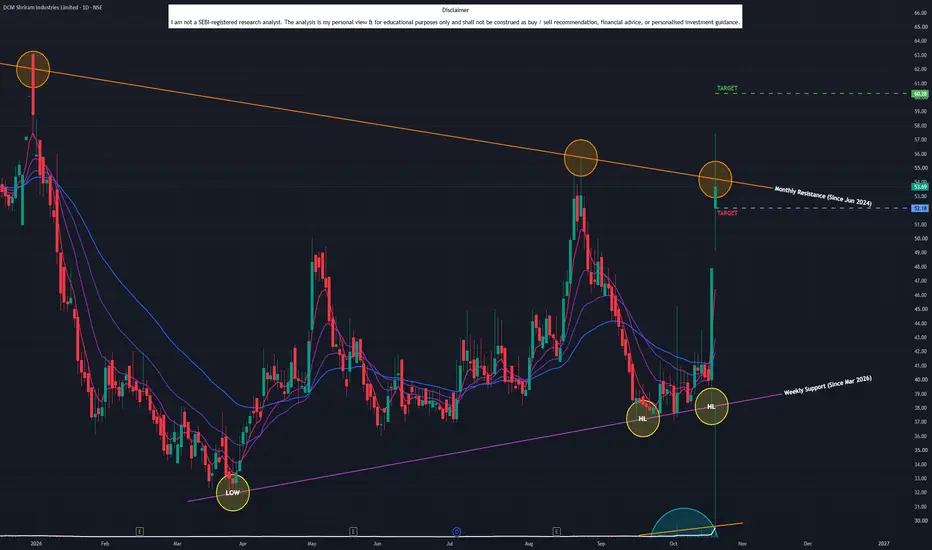
DCM Shriram Industries (D): REVERSAL & RESISTANCE TESTTimeframe: Daily | Chart Scale: Linear
Explosive gap-up and +12.09% surge today backed by a massive 57.43M volume spike! ๐ฅ
Technical Highlights:
โ
Reversal: Forming Higher Lows after a downtrendโtrend is shifting!
โ ๏ธ Resistance Test: Pushed into a long-term angular resistance (Jun '26) but couldn't secure the close.
โ
Volume: Rising volume confirms heavy buyer accumulation.
โ
Momentum: Short-term EMAs in positive crossover (Daily/Weekly). MACD & RSI rising. ๐
Key Levels to
India Cements (D): MASSIVE SUPPORT BOUNCE & BREAKOUTTimeframe: Daily | Chart Scale: Linear
Explosive +12.04% surge today backed by a massive 28.53M volume spike! ๐ฅ
Technical Highlights:
โ
Macro Floor: Bounced directly off a massive long-term angular support (active since Feb 2020!).
โ
Breakout: Cleared & closed above short-term consolidation.
โ ๏ธ Caution: Given the extreme 12% move, watch out for near-term profit booking.
โ
Momentum: MACD & RSI rising (Daily/Weekly), though EMAs are still catching up. ๐
Key Levels to Watch: