Nifty 50 : Trendline Support Holding, 50 EMA Still the Big TestOverview
Quick weekend look at the bigger picture on Nifty. On the weekly chart, two things stand out right now: a rising trendline support that's been holding nicely, and a resistance zone around the Weekly 50 EMA that price keeps trying (and failing) to clear.
What's Happening
Since the March low, Nifty has been climbing steadily along a rising trendline, currently sitting under the price. That trendline has done its job well so far — every dip toward it has found buyers.
At the same time, price has made a few attempts to break above the Weekly 50 EMA (currently at 24,378) and the resistance zone around 24,601–24,989, but hasn't managed a clean breakout yet. You can see two clear rejection points marked on the chart where price pushed into this zone and got pushed back.
There's also a support zone around 23,817 that's been tested four times now and has held each time — that's a pretty reliable level at this point.
Key Levels
Resistance Zone: 24,378 (Weekly 50 EMA) to 24,601–24,989
Support Zone (tested 4 times): 23,817
Trendline Support: rising, currently well below price, adding a longer-term floor
The Bigger Picture
Right now, Nifty is stuck between a well-tested support below and a resistance zone that keeps rejecting it above. Until one of these gives way clearly, we're likely to keep seeing this back-and-forth kind of price action.
What Would Change the Picture
A clean weekly close above 24,601 would be a good sign buyers are finally taking control of the bigger trend
A break below 23,817, especially with the trendline support also giving way, would be the first real sign this uptrend structure is in trouble
Beginner's Lesson
When a stock or index keeps failing at the same zone multiple times, it doesn't mean it will never break through — it just means buyers haven't found enough strength yet. The more times a level gets tested without breaking, the more important it becomes when it eventually does break, in either direction.
Conclusion
Nifty remains range-bound between strong support below and a tough resistance zone above. No clear signal yet either way — just watching how these two boundaries play out over the coming weeks.
For educational purposes only. Not financial advice. Weekly close below trendline: Gold outlook?The final trading session of the week arrives with no major macro catalyst capable of shifting market sentiment. Earlier this week, softer U.S. inflation data temporarily weakened the dollar but failed to generate a sustained recovery in Gold. Markets continue to price in a cautious Federal Reserve, with policymakers showing little urgency to ease monetary policy while inflation risks remain elevated. As a result, Treasury yields have stabilized and institutional flows continue to favor defensive positioning rather than aggressive buying in precious metals.
With the week's key economic releases now behind us, price action becomes increasingly important. The fact that Gold has been unable to capitalize on supportive inflation data suggests that buyers remain hesitant, while sellers continue to dominate the broader market structure.
From a technical perspective, Gold is set to close the week below the descending trendline on the H4 timeframe, reinforcing the existing bearish trend. Every recovery toward the Demand + Trendline resistance has been met with renewed selling pressure, confirming this confluence as the key institutional supply zone. Meanwhile, price continues to hold above the short-term support around 396x, but the rebound lacks momentum and has yet to produce a confirmed Break of Structure (BOS).
A weekly close beneath the trendline would strengthen the bearish narrative and keep the focus on the next liquidity zone around 392x–393x. Until buyers reclaim the descending trendline, the current recovery should still be viewed as corrective rather than the start of a broader reversal.
PRIMARY SCENARIO
As long as Gold remains below the Demand + Descending Trendline resistance, sellers are likely to maintain control. Any short-term recovery toward this resistance cluster could attract fresh selling pressure, with the 392x–393x support zone remaining the next downside objective.
ALTERNATIVE SCENARIO
If buyers manage to reclaim the descending trendline and secure a confirmed H4 close above the Demand resistance, bearish momentum could begin to fade. Such a move would suggest the current selling pressure is losing strength and open the door for a broader corrective recovery.
MARKET VIEW
Current Bias: Bearish
Preferred Strategy: Sell the Rally – Wait for Confirmation  Short
Short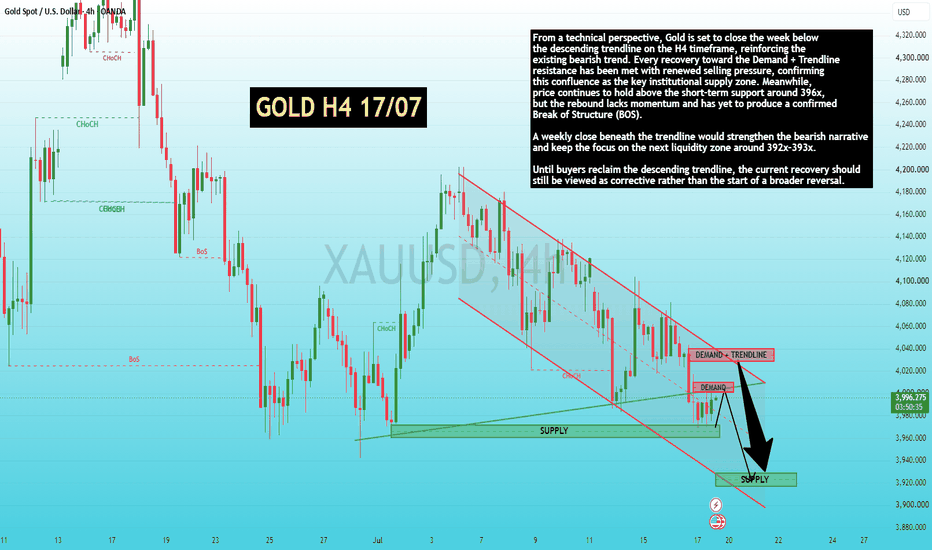
bitcoin making cup & handle patterns bitcoin forming good p🚨 Bitcoin (BTC/USD) is approaching a critical breakout zone after consolidating below a descending trendline. A confirmed breakout and close above the resistance zone could trigger strong bullish momentum toward the next major resistance levels.
🎯 Bullish Levels:
✅ Breakout Zone: **64,327 – 64,336**
🎯 Target 1: **64,750**
🎯 Target 2: **65,000**
🎯 Target 3: **65,517**
⚠️ If BTC fails to hold support and breaks below **64,272**, selling pressure may increase toward lower support zones.
💡 Wait for candle confirmation before entering a trade. Trade with proper risk management and always use a stop loss.
👇 What's your view on Bitcoin?
📈 Bullish or 📉 Bearish? Comment below!
Follow *for daily technical analysis, price action setups, crypto trading ideas, scalping strategies, swing trades, and trading education.
Bitcoin, BTC, BTCUSD, Bitcoin Analysis, BTC Technical Analysis, Crypto Trading, Bitcoin Breakout, BTC Breakout, Bitcoin Price Prediction, Crypto Signals, Price Action Trading, Support and Resistance, Trendline Breakout, Bitcoin Chart Analysis, Smart Money Concepts, ICT Trading, Crypto Scalping, Swing Trading, Day Trading, Trading Psychology, Risk Management, Technical Analysis, Trading View, Cryptocurrency, Crypto Market, Bitcoin Forecast, Best Crypto Trade, BTC Bulls, Crypto Education, Trading Strategy
#bitcoin #btc #btcusd #cryptocurrency #crypto #cryptotrading #bitcointrading #technicalanalysis #priceaction #tradingview #daytrading #swingtrading #scalping #supportandresistance #breakout #riskmanagement #smartmoney #icttrading #trader #trading #cryptoanalysis #bitcoinanalysis #marketanalysis #tradewithlogics #financialfreedom #reels #viralreels #explorepage #fyp #investing
pattern for swing setup XAUUSD – Gold Is Still Heavy, But Support Is Getting Important XAUUSD – Gold Is Still Heavy, But Support Is Getting Important
Gold is still struggling to build a strong recovery.
Price is currently trading around 4,017 after briefly moving back above the psychological 4,000 level. The bounce is visible, but gold remains near the monthly low area and is still moving inside a broad descending channel on the daily chart.
This means the market is not fully bullish yet. Gold is trying to recover from support, but the bigger structure still needs confirmation.
FUNDAMENTAL ANALYSIS
Gold remains under pressure as higher oil prices bring inflation concerns back into focus.
Rising tension between the U.S. and Iran has supported oil prices, which may keep inflation expectations elevated. This can strengthen the case for the Fed to keep interest rates higher for longer, supporting the U.S. dollar and limiting upside for non-yielding assets like gold.
For now, the fundamental background is still cautious. Any recovery in gold needs technical confirmation before becoming reliable.
TECHNICAL ANALYSIS – SMC + MARKET STRUCTURE
From an SMC perspective, gold is still moving inside a wide descending channel. Price has been forming lower highs since the major top, and the market has not yet broken the bearish structure.
The current area around 3,900 – 4,020 is very important. This zone is marked as a strong support and potential buy reaction area. If buyers defend this area, gold may create a corrective recovery toward the next resistance zones.
The first major resistance is around 4,207. If gold breaks and holds above this level, the recovery structure becomes stronger.
Above that, the next important resistance sits near 4,380 – 4,400, where Fibonacci and previous price reaction align. A stronger breakout from there could open the path toward the higher resistance zone around 4,700.
However, if gold loses the current support zone, the bearish channel remains active and price may continue searching for lower liquidity.
KEY PRICE ZONES
Current price: 4,017
Strong support / Buy zone: 3,900 – 4,020
Psychological level: 4,000
First resistance: 4,207
Fibonacci reaction resistance: 4,380 – 4,400
Higher resistance: 4,700
Bearish pressure remains: Below 4,207
Invalidation for recovery view: Below 3,900
TRADING SCENARIOS
Buy Scenario
Buy Zone: 3,900 – 4,020
Entry: Bullish reaction, liquidity sweep, or daily confirmation from support
SL: Below 3,900
TP1: 4,207
TP2: 4,380 – 4,400
TP3: 4,700 if momentum expands
Breakout Buy
Above 4,207 → Target 4,380 – 4,400
Sell Scenario
Sell below 3,900 after confirmation
TP1: 3,750
TP2: Lower channel area if bearish momentum continues
Invalidation: Reclaim 4,020 – 4,207
MY VIEW
Gold is trying to recover, but the bigger trend is still heavy.
The chart shows price sitting near a major support zone, so I do not want to chase selling too late. At the same time, I cannot call a bullish reversal while gold remains inside the descending channel and below 4,207.
For me, 4,207 is the first real confirmation level.
If buyers can push gold above 4,207, the recovery may extend toward 4,380 – 4,400.
If support near 3,900 fails, sellers may regain full control.
Gold is at support — but confirmation will decide the next move.
Do you think gold will defend the 4,000 area, or will sellers break the support zone next?
Long 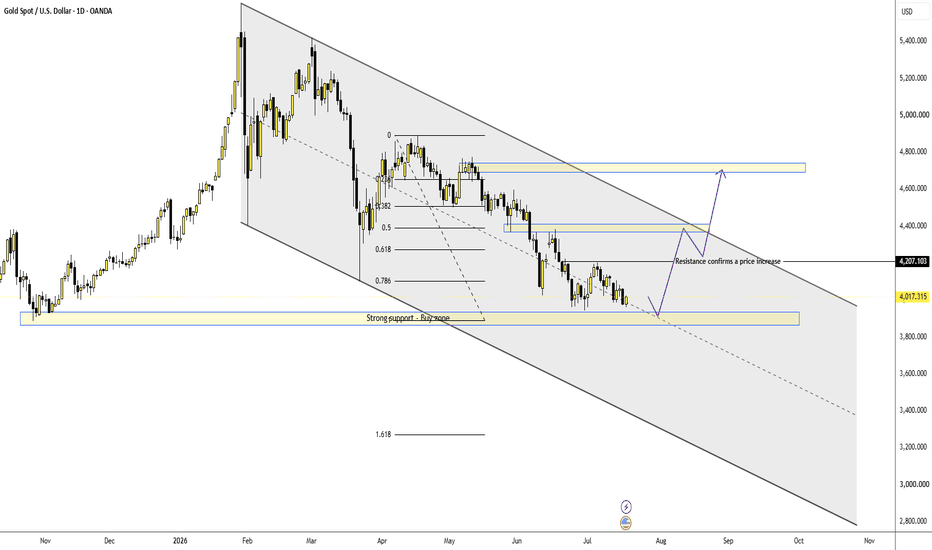
Long 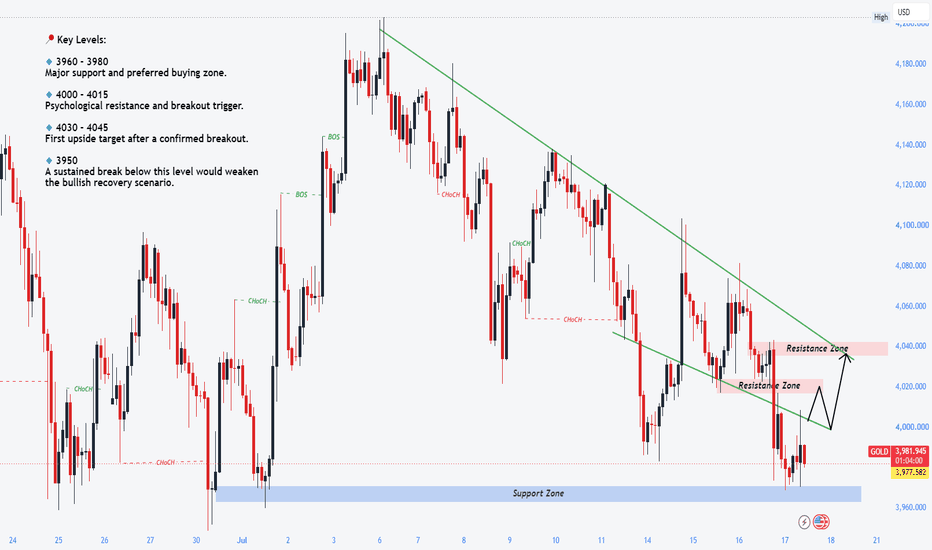
 Short
Short
GAUDIUM IVF – TECHNICAL + FUNDAMENTAL BREAKOUT
*** Strong Bullish Momentum Confirmed (Chart + Data Match)
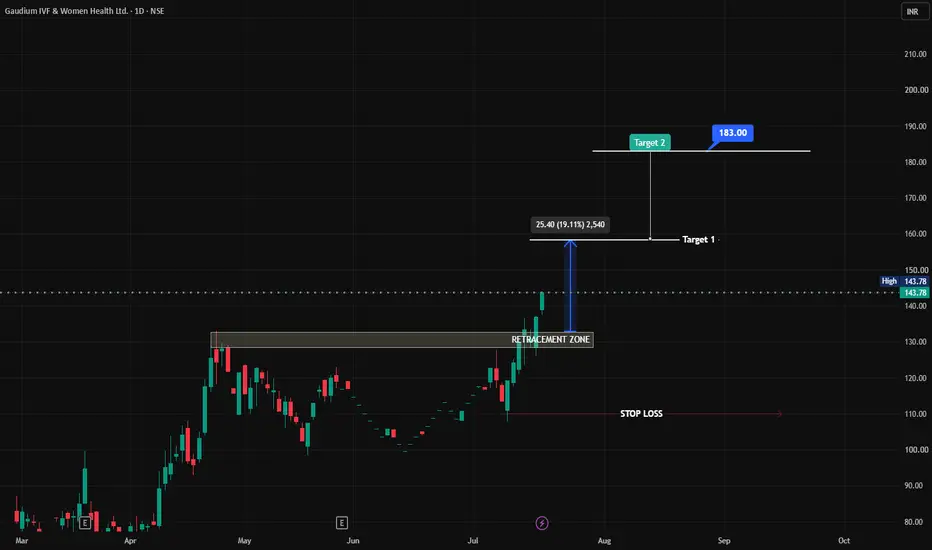
Stock recently made a fresh breakout near the ₹140 zone
Trading near 52-week high (₹133–₹137 zone earlier)
Clear Higher High – Higher Low structure → Strong uptrend continuation
🟢 Demand Zone: ₹128 – ₹132
🟡 Retracement Zone: Perfect bounce area
🔴 Premium Zone: Above ₹140 (current price area)
Institutions likely active near the demand zone
About the Company
Gaudium IVF and Women Health Limited is one of India's leading IVF (In-Vitro Fertilization) chains, founded in March 2015 by Dr. Manika Khanna and Dr. Peeyush Khanna in Delhi. It is a healthcare services company focused on fertility treatment, women's health, and assisted reproductive technology (ART).
The company operates through a Hub-and-Spoke model — 7 Hubs (full-service IVF centers) and 28 Spokes (strategic alliances with infertility experts) across 9 states in India, totaling 30+ locations.
It was successfully listed on NSE & BSE on February 27, 2026, at an issue price of ₹79/share.
CEO & Founder — Dr. Manika Khanna
Detail Information
Designation Chairperson & Managing Director (CMD)
Education MBBS (Gold Medallist), MD in Obstetrics & Gynecology — Maharaja Sayajirao University of Baroda
Specialization Advanced Gynecological Endoscopic Surgery — Kiel, Germany
Experience 16+ years in IVF treatment
Awards Delhi Ratna Award (2008), Women Excellence Award (2016), Oxford Academy UK — Medical Science Global Women's Health (2021), BusinessWorld Healthcare Personality of the Year — Women (2017)
Dr. Manika Khanna is the primary driving force behind Gaudium IVF. She is not just the clinical head but also the strategic and business leader of the company. She was also the selling shareholder in the IPO's Offer for Sale, divesting ~94.93 lakh shares worth ₹75 crore
Business Model
Gaudium IVF operates a diversified, patient-centric revenue model:
Revenue Stream Contribution
IVF Treatment 64%
Pharmacy 31%
Hospital Services 4%
The pharmacy segment grew from just 0.50% in FY23 to 28.85% in FY25 — a massive margin-enhancing shift.
Patient Journey: Lead generation → Consultation → Stimulation → OPU (Ovum Pick-Up) → Embryo Transfer → Post-care. Approximately 70% of the package amount is collected by the OPU stage, ensuring strong cash flow visibility.
Key Differentiators:
• GAAT (Gaudium Advanced Analysis and Treatment) — proprietary genome-based personalization system
• 58.74% IVF success rate (as of Sept 2025) vs. industry average
• Focus on complex/high-risk IVF cases (patients with 10–15 failed cycles)
• ₹7.39 crore invested in R&D as of March 2025
• Average Revenue per Patient: ₹3.55 lakh
• IVF in India costs ₹3–4 lakh vs. ₹18 lakh in the US — strong medical tourism advantage
Shareholding Pattern (Latest: FY27 Q1)
Category Holding %
Promoters 71.29%
FII (Foreign Institutional) 3.02%
DII (Domestic Institutional) 2.22%
Public 16.78%
Others 6.69%
>> Promoter holding is strong at 71.29% — zero pledging reported
Growth Strategy & Expansion Plans Year Expansion Plan FY27 - 3 new hubs launching (2 in Delhi/NCR, 1 in Nagpur) FY28 8 new centres planned FY29 1 additional centre
360° Customer Acquisition Strategy:
1. Digital Marketing (50%) — performance marketing, Tier II/III city targeting
2. Word of Mouth (30%) — strong patient & doctor networks
3. PR (10%) — media, celebrity partnerships
4. Brand Building (10%) — ATL/BTL advertising
Key Growth Drivers:
1. 13% national infertility rate — 27.5 million couples affected
2. India's Total Fertility Rate fell to 1.9 (below the replacement level of 2.1)
3. Technological advances — AI embryo selection, time-lapse incubators, genetic testing (PGT)
4. Expansion into Tier 2 & Tier 3 cities
5. Medical tourism — India's IVF costs are 80% cheaper than the US
6. ART (Regulation) Act providing regulatory clarity
Debt/Equity 0.52 (manageable)
Sector Tailwind Strong — 13%+ CAGR IVF market
Expansion Aggressive — 12 new centres by FY29
“Strong breakout stock with solid fundamentals like 25% ROE & expansion plans. Brokers positive but valuation expensive. Best strategy: Buy on dips, not at highs. Momentum intact with upside potential.”
 Long
Long
XAUUSD 3966 sweep — 4078 is the draw XAUUSD 3966 sweep — 4078 is the draw
That sweep under 3,970 is the part nobody should ignore.
Gold flushed into the low, tagged 3,966, then bounced back above 4,000. Not clean bullish. Not pretty. But that is how traps usually start.
Late sellers got paid first. Now price is trying to pull back into the next imbalance.
Macro still leans heavy, yeah. US-Iran tension, inflation fear, Fed rate-hike talk, stronger USD. All of that keeps the bigger tone bearish. So I’m not calling this a clean reversal.
This is more like a reaction trade.
Main bias is short-term bullish recovery while 3,966 holds.
The Fibo zone around 3,982 - 3,992 is the key reload area. If gold dips back there, holds, and reclaims above 4,021, then buyers can squeeze price toward 4,034 first. Above that, the real magnet is 4,064 - 4,078.
That SSL zone is where I expect the next fight. Could be the spot where sellers step back in. So yeah, buy low if it confirms, but don’t marry the bounce.
Trading scenario:
Buy idea only if price holds 3,982 - 3,992 and reclaims back above 4,021.
Entry zone: 3,982 - 4,000 after confirmation
Stop loss: below 3,966
TP1: 4,034
TP2: 4,064
TP3: 4,078
No reclaim above 4,021, no buy. Simple.
If gold closes hard below 3,966, this bounce idea is cooked. Then the sweep failed, and sellers can drag price lower again.
For now, I’m reading this as low sweep first, recovery into SSL second.
You think gold taps 4,078 before sellers return? Long 
Nifty : Bullish Momentum Inside the Ascending Channel1. Riding the Ascending Channel
The broader price action is firmly contained within a clear, upward-sloping parallel channel (indicated by the solid grey lines).
This structural pattern suggests a prevailing bullish trend, where the lower boundary is effectively acting as dynamic support to catch price pullbacks.
2. The Bullish Bounce Back
Following a significant, sharp sell-off—visible as a long, prominent red candlestick—the market found aggressive buyers just as it approached the lower trendline.
The most recent price action features a strong green candle trading around the 24,334.30 mark, signaling a robust recovery and a resurgence of bullish momentum.
3. Immediate Hurdles and Resistance
For the current bounce to continue, the price must first clear the immediate horizontal resistance level marked at 24,375.65.
If buyers can push past this zone, the next key targets are the intersecting dotted trendlines and higher horizontal levels at 24,530.90 and 24,728.15.
4. Defending Key Support Zones
The lower boundary of the ascending channel remains the most critical line of defense for the current uptrend.
Should the price break below this dynamic support, the marked horizontal levels at 24,082.65 and 23,976.80 will act as the primary safety nets against a deeper correction.
5. The Bigger Picture: Trend Continuation
As long as the price continues to respect the boundaries of the ascending channel, the overall market structure remains positive.
A decisive breakout above the intermediate dotted resistance lines would confirm trend continuation, potentially paving the way toward the channel's upper limits near 24,807.90 and 24,979.10.  Long
Long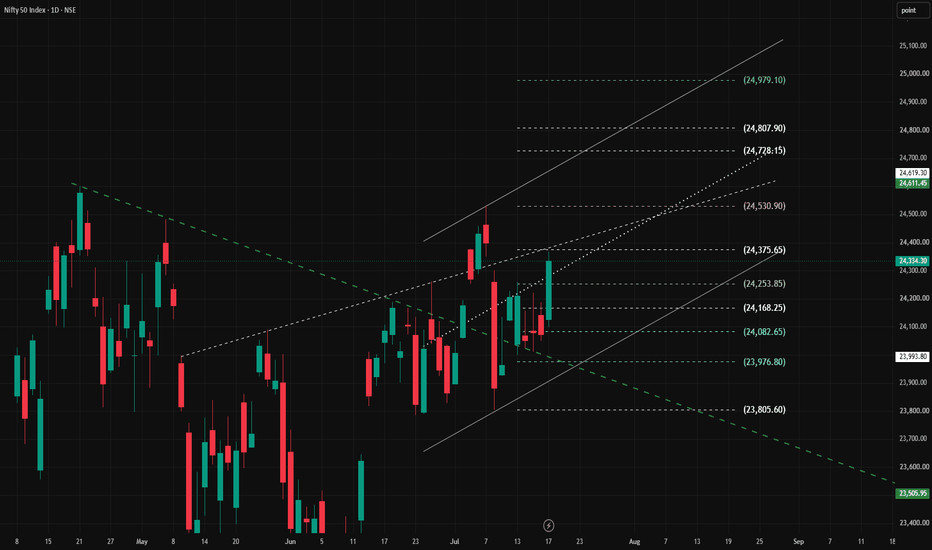
Risk Management Determines Long-Term SuccessEvery trader dreams of finding the perfect strategy.
Some spend years searching for the best indicator.
Others constantly switch between chart patterns, timeframes, or trading systems, believing the next one will finally unlock consistent profits.
Yet many of these traders continue to lose money.
Not because their analysis is poor.
But because they ignore the one skill that matters more than any entry signal:
Risk management.
In trading, success isn't determined by how much you make on your best trade.
It's determined by how well you protect yourself during your worst ones.
Every Trader Will Experience Losses
One of the biggest misconceptions in trading is the belief that successful traders rarely lose.
The reality is very different.
Even the most experienced professionals have losing trades, losing weeks, and sometimes even losing months.
The difference is not that they avoid losses.
The difference is that they control them.
They understand that losses are a normal part of a probability-based business.
Instead of trying to eliminate risk, they focus on managing it.
Capital Is Your Greatest Asset
Without capital, there is no trading.
Every opportunity in the market requires one thing:
The ability to participate.
A trader who loses half of their account doesn't just lose money.
They lose flexibility, confidence, and future opportunities.
Recovering from large losses is far more difficult than most people realize.
A 50% loss requires a 100% gain just to return to break-even.
That is why protecting capital should always come before chasing profits.
Small Losses Keep You in the Game
Many beginners view losing trades as failures.
Professional traders see them as operating costs.
Every business has expenses.
For a trader, controlled losses are simply part of doing business.
The goal is not to avoid every losing trade.
The goal is to ensure that no single trade causes significant damage.
A series of small losses is manageable.
One uncontrolled loss can erase months of steady progress.
Position Size Matters More Than Confidence
Confidence can be dangerous.
A trader may believe they have found the perfect setup and decide to risk a large portion of their account.
But the market doesn't reward confidence.
It rewards discipline.
Professional traders often risk only a small percentage of their capital on any single trade.
This approach allows them to survive unexpected events and continue trading with a clear mind.
Long-term consistency comes from controlled position sizing, not oversized bets.
Winning Isn't Everything
Many traders judge themselves by their win rate.
But winning frequently does not automatically lead to profitability.
Imagine two traders.
One wins 80% of their trades but allows losses to become much larger than gains.
Another wins only half of the time but keeps losses small and lets profitable trades grow.
Over hundreds of trades, the second trader may produce much stronger results.
Long-term success depends on the relationship between risk and reward, not simply how often you are right.
Risk Management Supports Emotional Control
Large financial risk creates emotional pressure.
Fear encourages traders to exit winning trades too early.
Hope convinces them to hold losing positions for too long.
Greed tempts them to increase position size after a few successful trades.
When risk is controlled, emotions become easier to manage.
Smaller exposure allows traders to follow their plans instead of reacting impulsively.
Discipline becomes far easier when survival is never threatened by a single decision.
Think in Years, Not Trades
The market will always provide another opportunity.
Missing one trade is rarely important.
Protecting your ability to take the next hundred trades is.
Professional traders measure success over hundreds of trades, not individual outcomes.
They understand that consistency compounds over time.
One exceptional trade rarely builds a successful trading career.
Thousands of disciplined decisions do.
Final words:words:
Every trader wants better entries, stronger trends, and higher profits.
But none of those matter if poor risk management removes you from the market.
Long-term success belongs to traders who protect their capital, accept uncertainty, and remain disciplined through both winning and losing periods.
Strategies may change.
Markets may evolve.
Volatility may increase or decrease.
But one principle remains constant:
The traders who survive the longest are usually the ones who manage risk the best.
Because in trading, longevity is not an accident.
It is the direct result of disciplined risk management.
 Education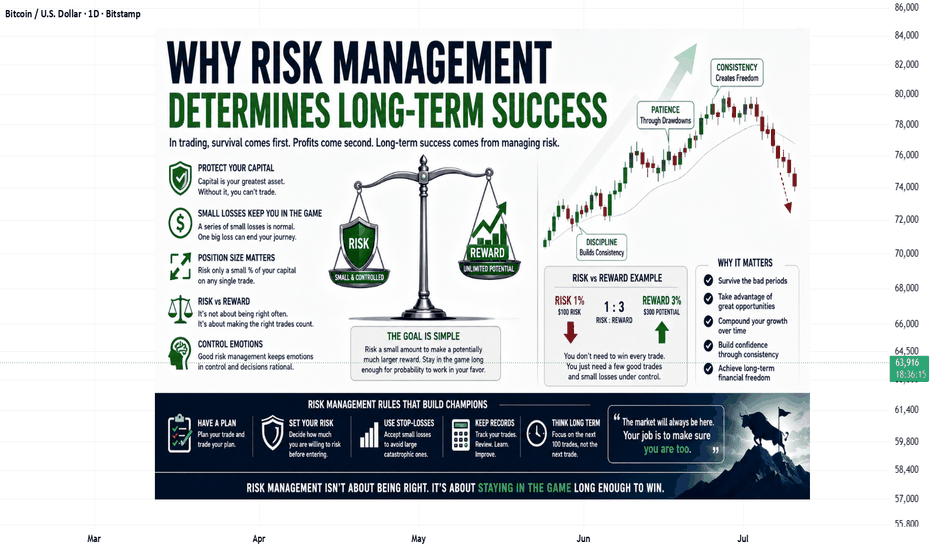
 Long
Long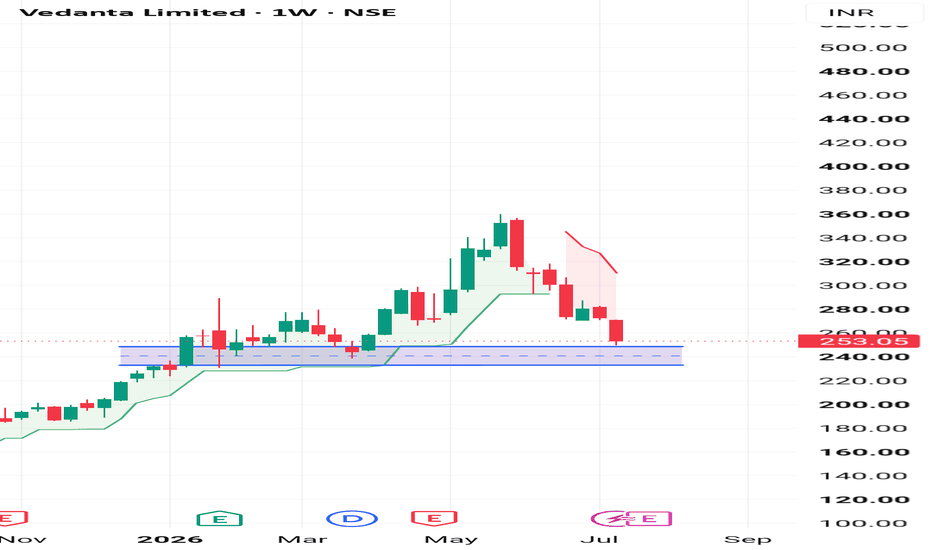
XAUUSD: Weak Bounce, Strong Sellers Above XAUUSD: Weak Bounce, Strong Sellers Above
Market Context
Gold is trading around 4,017 after a small rebound from the monthly low area. Buyers are reacting from demand, but the upside still looks limited.
US-Iran tensions and inflation concerns are keeping the USD supported, while the market is still pricing the possibility of a restrictive Fed stance. This creates pressure on gold whenever price rebounds into higher resistance.
Key point: gold is bouncing, but sellers are still waiting above. This is not a confirmed bullish reversal yet.
Technical Structure
Gold is rebounding from the Demand / Buy Reaction Zone around 3,960 - 4,000. This area is holding for now and may support a short-term bounce.
The first important resistance is 4,030 - 4,080. This is the Sell Reaction Zone. If price rebounds into this area and fails, selling pressure may return quickly.
Above that, the Major Supply Zone remains around 4,115 - 4,135. As long as gold stays below this zone, the broader structure still favors sellers.
If demand is lost, price may fall back toward 3,960 and possibly lower.
Key Levels
Current Price: 4,017
Demand / Buy Reaction Zone: 3,960 - 4,000
Sell Reaction Zone: 4,030 - 4,080
Major Supply Zone: 4,115 - 4,135
Bullish Confirmation: Above 4,080
Bearish Continuation: Below 3,960
Trading Plan
Buy Scenario
Entry: 3,960 - 4,000
SL: Below 3,940
TP: 4,030 / 4,060 / 4,080
Condition: Price holds demand and shows bullish confirmation. This is only a short-term rebound setup, not a full reversal.
Sell Scenario Priority
Entry: 4,030 - 4,080
SL: Above 4,100
TP: 4,017 / 4,000 / 3,960
Condition: Price rebounds into the Sell Reaction Zone and gets rejected. Sellers regain control if buyers fail to hold above 4,080.
Sell at Major Supply
Entry: 4,115 - 4,135
SL: Above 4,155
TP: 4,080 / 4,030 / 4,000
Condition: Price sweeps higher into major supply and fails to continue. This is the stronger sell area if the rebound extends.
Breakdown Sell
Entry: Below 3,960
SL: Above 4,000
TP: 3,940 / 3,920 / 3,900
Condition: Demand fails, retest is rejected, and bearish momentum continues.
Overall Bias
Gold is still not bullish yet. The rebound from demand is valid, but the structure remains weak below 4,030 - 4,080.
If buyers reclaim 4,080, gold may extend toward 4,115 - 4,135. If price rejects from the sell zone, sellers may push gold back toward 4,000 and 3,960.
Best approach: wait for confirmation at demand or resistance. Do not chase the bounce while gold is still below the sell zone.
Will gold break 4,080, or will sellers use this rebound to push price back into demand?
Short 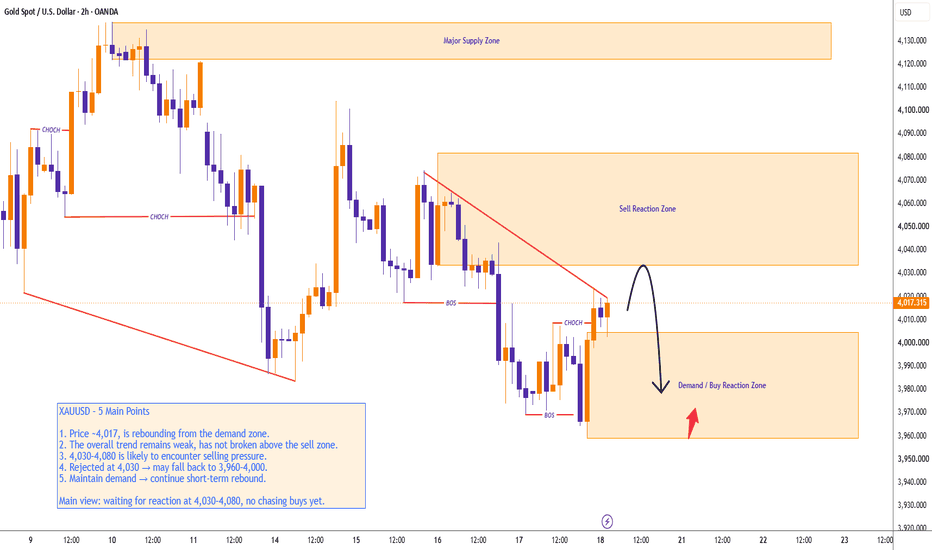
Short 
Bank Nifty – Swing View (Range Break-out)It's a RANGE-BREAKOUT Setup...
Bullish
✅ Price is testing the upper boundary of a month-long consolidation.
✅ RSI is above 70, showing strong momentum.
✅ Multiple higher lows indicate buyers are in control.
✅ A decisive breakout above 58,600 can trigger a fast move toward 59,934.
Bearish
⚠️ The range has held for several weeks.
⚠️ A breakdown below 57,200 would invalidate the bullish structure and can accelerate selling toward 55,720.
Preferred Side: 🟢 Bullish
As long as 57,200 holds, the probability favors an upside breakout. However, avoid taking fresh positions inside the range. Let the market confirm the move with an hourly close above 58,600 or below 57,200 before entering.
Education 
MASON XAUUSD – Medium-Term Recovery Setup
Gold is trading around 4,017 after reacting near the lower part of the descending channel. The main medium-term idea for next week is a bullish correction, but confirmation is still needed because price remains inside the larger bearish channel.
Technical View
On the H4 chart, gold is still moving inside a wide descending channel, but price is now reacting from the lower channel area and liquidity zone. This suggests sellers may start losing momentum in the short term.
The recent structure also shows a possible recovery base after price swept liquidity around 3,950–4,000. If gold can hold above this area and reclaim the 4,100–4,120 zone, the bullish correction scenario becomes stronger.
The first important upside level is 4,203, marked as strong liquidity. A clean break above this zone could open the way toward the higher resistance area around 4,350–4,380, where the chart shows the next major supply zone.
Key Zones
Current price: 4,017
Main liquidity support: 3,950–4,000
Key buy/reclaim zone: 4,100–4,120
Strong liquidity target: 4,203
Major resistance: 4,350–4,380
Invalidation: below 3,950
Trading Plan
Priority Buy Scenario – Medium-Term Correction
Entry zone: 4,100–4,120 after reclaim and retest
Confirmation: H4 candle holds above the zone with bullish price action
Stop loss: below 3,950
Take profit 1: 4,203
Take profit 2: 4,350
Take profit 3: 4,380
Alternative Scenario
If gold drops once more into 3,950–4,000 and shows a clear rejection, this area can become a lower buy reaction zone. The first target would be 4,100–4,120, then 4,203 if momentum improves.
Sell View
Selling is not the priority for this plan. A sell view only becomes stronger if gold loses 3,950 and fails to recover back above the liquidity zone.
Final View
The main view for next week is a bullish correction from the lower channel area. Gold needs to reclaim 4,100–4,120 first, then 4,203 becomes the key level to watch for stronger upside continuation. No confirmation means no trade. Long 
XAUUSD – Bearish Continuation Toward Fibonacci TargetXAUUSD is trading around 3,990 after failing to recover above the short-term downtrend structure. Price remains below the previous support area, and the current reaction still looks like a weak correction inside the bearish trend.
The priority view remains sell with the trend, especially if gold retests the 4,020–4,040 reaction zone and fails to break above the psychological sell order area.
Technical View
Gold is still moving under bearish pressure after the strong breakdown from the previous consolidation zone. The market failed to hold above the old support, and price is now trading below the short-term downtrend trendline.
The 4,020 area is the first reaction zone to watch. This level was marked on the chart as an important area for price reaction. If gold pulls back into this zone and shows rejection, it may confirm that buyers are still weak.
The 4,035–4,040 area is the main psychological sell order zone. This zone is important because it aligns with the Fibonacci reaction area and the previous breakdown structure. If price reaches this area and fails to continue higher, it may confirm another lower high before the next bearish leg.
The 3,969 support is the nearest downside level. If gold breaks below this area, the bearish structure may continue toward the Fibonacci 1.618 target around 3,945–3,950.
The main idea is simple: as long as gold stays below 4,020–4,040, the market remains under selling pressure, and recovery attempts should be treated as corrective.
Key Zones
Current price: 3,990
Price reaction zone: 4,020–4,025
Psychological sell order zone: 4,035–4,040
Downtrend resistance: 4,000–4,020
Nearest support: 3,969
Fibonacci 1.618 target: 3,945–3,950
Invalidation: above 4,045
Trading Plan
Sell Priority: 4,020–4,040
Condition: wait for bearish rejection, failed recovery above the downtrend trendline, or price staying below the psychological sell order zone.
SL: above 4,045
TP1: 3,969
TP2: 3,945–3,950
TP3: 3,920–3,930
Alternative Scenario
If gold breaks below 3,969 directly, wait for a retest of this level as resistance before looking for sell continuation toward the Fibonacci 1.618 target around 3,945–3,950.
Buy View
Buy is not the priority while price remains below the downtrend trendline and below the 4,020–4,040 resistance area. A short-term buy reaction may appear near 3,945–3,950, but it needs clear bullish confirmation first.
Final View
Overall, gold remains in a bearish continuation structure. The cleaner plan is to wait for price to retest the 4,020–4,040 sell zone and watch for rejection. As long as this area holds as resistance, the downside path toward 3,969 and the Fibonacci target around 3,945 remains in focus.
Will gold reject from the psychological sell zone first, or break below 3,969 directly toward the Fibonacci target?
Short 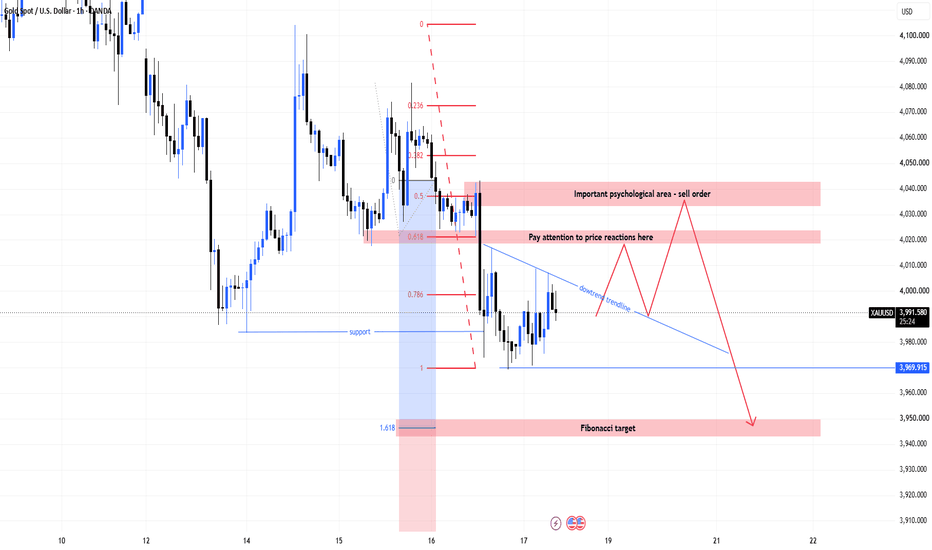
17th Jul 2026 — Nifty Report — 127pts up, Reclaimed 6th JulNifty Stance: Neutral
Last week, our markets reacted to the social media posts from Trump that the military activities in Iran may intensify. Our markets fell first and then retraced a portion of their losses.
This week, we ensured the retracement is complete, and we are now trading at a level as seen on the 6th of July, well before Trump’s statements, indicating that the markets have now priced in a status quo on the US-Iran situation.
Press enter or click to view image in full size
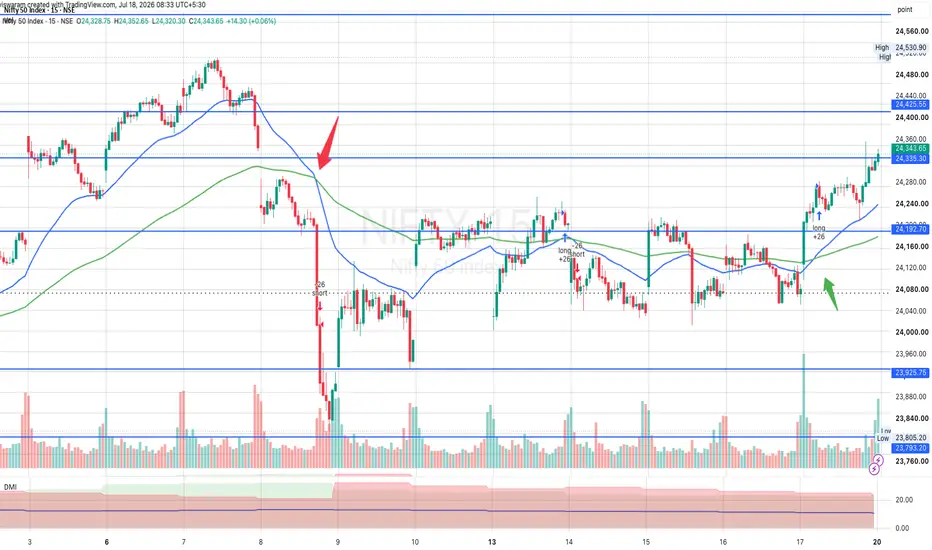
The technical indicators are still showing a neutral stance, with a slight hint of bullishness, as the Fast EMA (blue) has crossed above the Slow EMA (green). The crossover is indicated by the green arrow marker on the chart.
The Average Directional Index (ADX) is around 11, indicating a non-directional trend. The moment it goes above 20, we can expect a rally or breakdown. Overall, Nifty has gained 127.4 pts (0.53%) and created a bullish marubozu on the weekly chart (because we started with a gap-down on the 13th).
Important Things to Watch for the Next Week
Quarterly Earnings: Ultratech Cements, PayTM, Bajaj Auto, Adani Transmission, TVS Motor, Indian Hotels, Adani Power, Eternal, Nestle, Adani Green, BPCL, Oracle, Dr. Reddys, United Spirits, Infy, Interglobe, Cipla, Shriram Finance, CG Power, BoB, JSPL, AU Small Fin Bank, IDFC Bank, etc.
Data points to watch from a domestic perspective: Infrastructure Output, Bank Loan Growth, Deposit Growth, and FX Reserves.
Data points to watch from a global perspective: UK CPI, EURO Interest Rate Decision, US Jobless Claims, and S&P PMI.
IPO Listing: Alpine Texworld, SBI Funds Management, and Millworks Technologies on 21st July.
If Nifty moves up, the resistance levels are 24425, 24613, and 24740. If Nifty falls, the support levels are 24335, 24192, and 23925.
DISCLAIMER
Investments in the securities market are subject to market risks, including the potential loss of principal. Past performance does not guarantee future results. Information provided is for educational purposes only and should not be considered financial advice. Investors should read all related documents carefully and consult a certified advisor before investing. Registration granted by SEBI and Enlistment with RAASB/BSE and certification from NISM in no way guarantee performance of the intermediary or provide any assurance of returns to investors. The investor is requested to take into consideration all the risk factors before actually trading in stocks or derivatives. The SEBI RIA license INA000021757 & RA license INH000025045 are for Balachandran RV Long