Long
Long
INOXWIND : Developing an Observational PerspectiveNSE:INOXWIND
Inox Wind Ltd. is one of India's leading wind energy solutions providers, engaged in manufacturing wind turbine generators while offering end-to-end services including project development, EPC, commissioning, operations, and maintenance. Backed by the INOXGFL Group, the company continues to benefit from India's growing renewable energy transition, supported by an improving order pipeline and execution capabilities.
-------------------------------------------------------------------------------------------------------------------
Key Technical Observations:
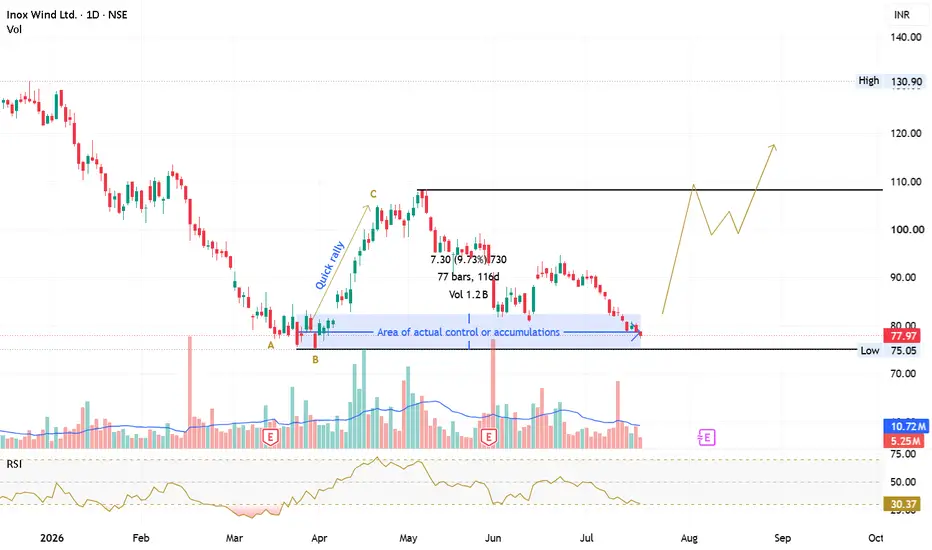
• A clear downtrend remained intact until 17 March 2026 (Point A).
• Between 17 and 30 March 2026, price entered a consolidation phase (Point B).
• On 8 April 2026, price showed its first meaningful sign of strength accompanied by above-average volume.
• The move from Point B to Point C (7 May 2026) developed into a sharp upside rally with strong volume participation.
• After the rally, price corrected on comparatively lower participation and later reacted near the previous demand area.
-------------------------------------------------------------------------------------------------------------------
Understanding the Price Story:
• Point A represents the first visible attempt to slow the prevailing selling pressure.
• The region between Point A and Point B appears to be an area where sell-side supply was gradually absorbed.
• The impulsive rally from Point B to Point C suggests the possibility of a temporary sell-side liquidity vacuum, allowing price to advance rapidly.
• Based on current price behaviour, the 75–83 zone can be treated as a working hypothesis for a potential accumulation area rather than a confirmed fact.
• The recent decline may indicate reduced buying activity, while the latest reaction near this zone suggests buyers are still willing to defend it.
-------------------------------------------------------------------------------------------------------------------
What Needs Further Confirmation?
Before developing a bullish bias, I would prefer to observe:
• A Hammer, Bullish Engulfing, or Strong Bullish Marubozu forming within the ₹75–83 zone.
• A high-volume bullish session followed by narrow-range candles, indicating sustained demand rather than a one-day spike.
• Daily RSI reclaiming and sustaining above the 50 level.
• Price closing back above ₹83 on a daily basis.
• Price closing below ₹74 on a daily basis, invalidates the hypothesis .
-------------------------------------------------------------------------------------------------------------------
Educational Takeaway:
This analysis is purely observational and demonstrates how market participants can build a hypothesis by combining price structure, volume behaviour, and market context. The objective is not to predict the future but to continuously validate or invalidate the hypothesis as new price data becomes available.
-------------------------------------------------------------------------------------------------------------------
This is for educational purposes only and should not be considered investment advice. XAUUSD — Still Heavy Below 4,009Gold is still moving with pressure inside the descending channel.
Price is trading around 3,990 after failing to hold above the short-term resistance area near 4,009.
This tells me the market is not ready to confirm a clean recovery yet.
The bounce is there.
But the structure is still heavy.
The simple read
Gold is now between resistance and liquidity support.
The first resistance area is 4,009 - 4,015.
If sellers continue to defend this zone, price may rotate lower again toward 3,968.
If 3,968 fails, the deeper reaction zone is 3,940.
This 3,940 area is important because it connects with the Fibo extension buy zone and the lower part of the descending channel.
So today, I do not want to chase the middle.
I want to wait for the next clean reaction.
Key price zones
Current price area: 3,985 - 3,995
Short-term sell zone: 4,009 - 4,015
Main resistance zone: 4,039
Liquidity support: 3,968
Fibo extension buy zone: 3,940
Bearish pressure weakens above: 4,009
Recovery becomes stronger above: 4,039
Trading plan
📉 Sell reaction scenario
If gold retests 4,009 - 4,015 and rejects:
The correction can continue toward 3,968.
If 3,968 breaks clearly, gold may move deeper toward 3,940.
This is the cleaner sell-side roadmap while price stays under resistance.
📈 Recovery scenario
If gold breaks and holds above 4,009:
A short-term recovery may appear.
Price could retest 4,015 first, then 4,039.
But this is still only a recovery attempt unless gold also breaks 4,039 with strength.
📈 Buy reaction scenario
If gold reaches 3,968 - 3,940:
This is where I will watch buyer reaction more carefully.
A clean reaction from 3,968 may create a short bounce.
A deeper sweep into 3,940 may create a stronger reaction if buyers defend the zone.
No reaction = no buy.
Tiara’s View
Gold is not giving a clean bullish confirmation yet.
The chart is still moving from resistance to support inside a bearish channel.
That means patience is more important than guessing.
For me, 4,009 is the first trap zone.
3,968 is the first liquidity support.
3,940 is the deeper zone where the next real reaction may appear.
Main view:
Below 4,009, gold remains cautious.
Above 4,009, a recovery can start.
Above 4,039, the structure becomes cleaner for buyers.
Reaction first.
Confirmation second.
Trade last.
No confirmation = no trade.
Do you think gold will reject from 4,009 again, or sweep 3,940 before the next reaction?  Short
Short
Long 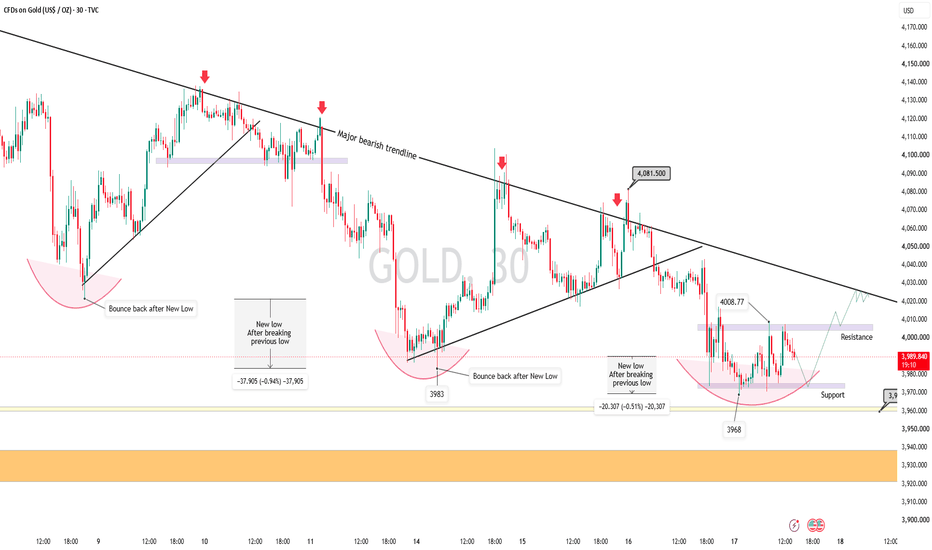
GOLD reacting from low, but still bearish.BRIAN XAUUSD – GOLD REACTING FROM LOW VALUE, BUT HIGHER SUPPLY STILL DOMINATES
Gold is currently bouncing from a lower value area after tapping into the monthly low zone. This move is not a breakout — it is a classic Volume Profile reaction from discounted price, where buyers step in to absorb liquidity.
However, the overall structure still shows imbalance to the downside. The market is not yet accepting higher value, and sellers are still positioned above.
From a macro perspective, USD strength driven by inflation concerns and geopolitical tension continues to weigh on gold. The market is leaning toward a more hawkish Fed narrative, which limits upside potential. This reinforces the idea that the current move is a corrective bounce, not a trend reversal.
Volume Profile structure
On H1, price is attempting to build acceptance above the POC Holding Zone at 3,980 - 3,990.
This zone represents the most traded area after the recent sell-off — a key balance point where buyers are trying to establish control. If price continues to hold above this level, it signals short-term value acceptance and opens the door for a rotation higher.
However, the broader context still shows a bearish channel. This means any move up is likely to be a rotation toward higher liquidity zones, where sellers may re-enter.
Above current price, we have clear low-volume areas leading into resistance zones. These are typical targets for price to move quickly into, but also areas where rejection can occur.
Key Volume Profile zones
POC Holding Zone: 3,980 - 3,990
This is the current value area where the market is trying to stabilize. Holding above this zone = short-term bullish acceptance.
Low Volume Expansion Zone: 4,035 - 4,040
This is the first upside magnet. Price can move quickly into this area due to low resistance, but reaction is expected.
High Supply Zone: 4,075 - 4,080
This is where previous selling pressure exists. If price reaches here, expect strong reaction or rejection.
Bearish Channel Resistance
This is the structural ceiling. As long as price remains inside this channel, sellers still control the higher timeframe narrative.
Trading scenario – Volume Profile approach
Buy only when price confirms acceptance above the POC Holding Zone 3,980 - 3,990
Entry:
Wait for price to hold above 3,980 - 3,990 and show clear rejection of lower prices (absorption, strong bullish candles, or failed breakdown).
Stop Loss:
Below the POC zone or below the recent liquidity sweep.
Take Profit:
TP1: 4,035 - 4,040 (low volume target)
TP2: 4,075 - 4,080 (high supply zone)
Important note:
This is a rotation trade from low value to higher value — not a trend continuation setup.
Final view
Gold is currently rotating higher from a discounted zone, but the market has not yet shifted into a bullish structure.
As long as price remains inside the bearish channel, every rally should be viewed as a move into supply, not a breakout.
The real game is not at the bottom — it is at the higher zones where liquidity and sellers are waiting.
Key question:
Will the market accept higher value above 4,040 and push toward 4,080, or will this bounce simply feed sellers for the next leg down? Long 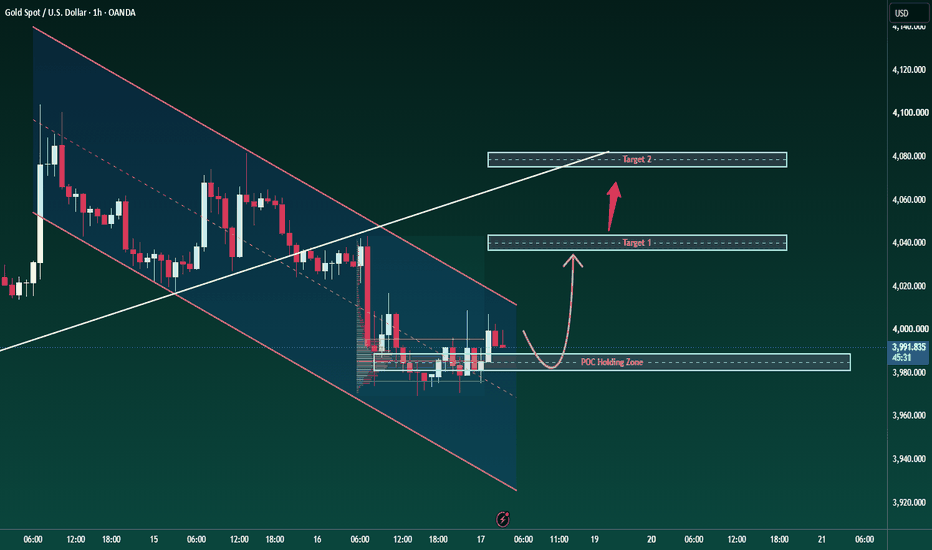
GOLD: Range Break or Trend Continuation?📌 Market Overview
• Gold remains under pressure after the recent sell-off, with price still trading below the H1 descending trendline.
• Despite several rebound attempts, bullish momentum remains weak and the market is still trapped inside the current consolidation range.
• Today's focus shifts to U.S. Retail Sales, Initial Jobless Claims, and any new headlines surrounding Trump and Iran, as these could trigger the next wave of volatility.
📌 Trading Plan
Resistance: 4000–4010 | 4055–4070
Support: 3970–3960 | 3942 | 3888
📌 Personal View
✅ As long as price remains below the descending trendline, the primary bias remains SELL on rallies.
✅ If price breaks and holds above 4010, a short-term recovery toward 4055–4070 becomes more likely.
✅ If 3960 is broken, the next downside targets are 3942, followed by 3888.
✅ Avoid chasing trades inside the current range. Wait for a clear breakout or a confirmed rejection at key levels before entering.
📌 What do you think?
Will Gold break above 4010 and start a recovery, or lose 3960 and extend the bearish trend? Short 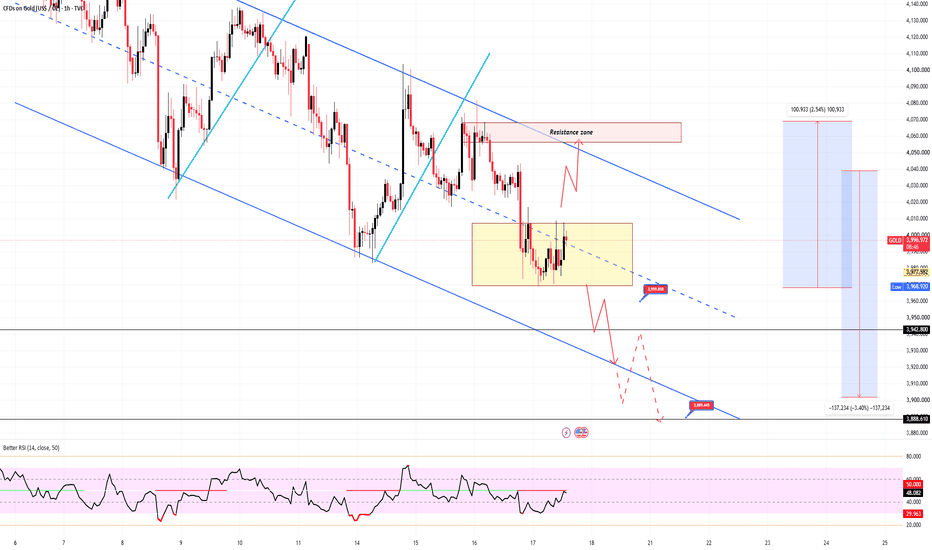
XAUUSD — 4,040 Is the Trap Zone XAUUSD — 4,040 Is the Trap Zone
Gold is getting a small bounce from the lows, but this is exactly the kind of move I would be careful with.
Price has been travelling inside a wider bearish channel, and every recovery has looked more like the market lifting its head for air before sellers step in again. The latest bounce from the 3,980 - 3,995 area is interesting, but it has not changed the bigger story yet. Gold is still sitting near monthly lows, and the structure is still showing lower highs inside the channel.
For newer traders, the key is not just that price is bouncing. The key is where it is bouncing into. Right now, gold is moving back toward the supply zone around 4,030 - 4,045. That area is where I think late buyers may get tested. If price climbs into that zone and starts rejecting, it would look like smart money is using the bounce to reload sellers, not to build a clean bullish reversal.
My main view is bearish while gold stays below the supply zone. The broader pressure still supports that idea: oil-driven inflation concerns, US-Iran tension, and higher-for-longer Fed expectations can keep the USD supported, which makes gold’s recovery harder to trust.
If price rejects from 4,030 - 4,045 and breaks back below the small range near 3,980 - 3,995, the next liquidity pocket I would watch is 3,960.275 first. If that level fails, the lower channel area near 3,920 can become the next magnet.
This bearish idea only becomes weaker if gold reclaims 4,045 cleanly and holds above the supply zone. That would tell me sellers failed to defend the trap area.
Key price zones to watch
Current reaction area: 3,980 - 3,995
Main supply / trap zone: 4,030 - 4,045
Bearish confirmation zone: clean break below 3,980
First downside liquidity target: 3,960.275
Main downside channel target: 3,920 - 3,930
Upper resistance if sellers fail: 4,045 - 4,060
Major upside liquidity: 4,138.553
Invalidation: clean reclaim above 4,045 and hold
Do you see this bounce as real strength, or just a pullback into supply before gold hunts 3,960 again?
Short 
NIFTY | Breakout or Rejection? 24,576 Decides Next MoveNifty 50 Index — Daily Chart Study
NSE: NIFTY
Nifty is now standing near an important decision zone. The chart clearly shows both possibilities — a breakout continuation if resistance is crossed, or a rejection if support fails.
The key area to watch is 24,353–24,430. If Nifty sustains above this zone, short-term momentum can remain positive. The major resistance is near 24,576, and a strong move above this level can open the path toward 24,750–25,000.
Chart observations:
Nifty is holding above the rising trendline support.
Price is trying to move above the near resistance band.
24,353–24,430 is the first confirmation zone.
24,576 is the major breakout resistance.
A sustained breakout above 24,576 can improve the probability of a move toward 25,000.
On the downside, 24,050 is the most important support level. If Nifty fails to hold 24,050, the short-term structure may weaken. Below that, the next downside zones are 23,900–23,830, followed by 23,600–23,500 if selling pressure increases.
Key levels:
Immediate support: 24,050
Weakness below: 24,050
Downside zones: 23,900–23,830 / 23,600–23,500
First upside confirmation: 24,353–24,430
Major breakout zone: 24,576
Upside reference: 24,750–25,000
For now, Nifty is in a breakout-or-rejection zone. The next clear move may depend on whether Nifty sustains above 24,353–24,430 and then crosses 24,576, or whether it fails and breaks below 24,050.
Shared only for educational study and chart-tracking purpose. This is not a buy/sell recommendation, trading advice, or investment advice. I am not a SEBI registered advisor. Please do your own research or consult a qualified financial advisor before taking any market decision. I am not responsible for any profit or loss based on this post.
#NIFTY #Nifty50 #NSE #IndianStockMarket #StockMarketIndia #NiftyAnalysis #DailyChart #BreakoutWatch #SupportAndResistance #TechnicalAnalysis BHEL Surges to Record Highs on Earnings RevivalHighlights
* BHEL has witnessed a strong breakout following its Q1FY27 earnings announcement, with the stock hitting a fresh 52-week high as investors cheered its return to profitability and robust revenue growth. The stock continues to outperform the broader PSU and capital goods space.
* The **₹440–₹445** zone remains the immediate resistance area. A decisive close above this range could confirm the continuation of the ongoing rally and open the door for an advance towards **₹470–₹490** in the near term.
* On the downside, the **₹415–₹420** range serves as immediate support, while the **₹390–₹400** zone remains a strong medium-term demand area. Holding above these levels would keep the bullish structure intact.
* Momentum indicators remain firmly positive, with RSI trading in bullish territory and MACD continuing to signal strengthening upward momentum. The stock is also trading comfortably above its 20-day, 50-day, 100-day, and 200-day moving averages, highlighting the strength of the prevailing uptrend.
* The stock has formed a strong higher-high and higher-low pattern on the daily chart, accompanied by above-average trading volumes, suggesting sustained institutional participation rather than a short-term speculative move.
* Strong execution in the power and infrastructure segments, improving order inflows, government-led capex spending, and increasing opportunities in thermal, nuclear, and defence-related projects continue to provide a favorable fundamental backdrop for BHEL's medium-term growth prospects.
Takeaway
BHEL is displaying one of the strongest technical setups within the PSU space after delivering a decisive earnings-led breakout. A sustained move above **₹445** could accelerate buying momentum and push the stock towards the **₹470–₹490** zone in the coming weeks. As long as BHEL holds above the **₹415–₹420** support range, the technical bias remains firmly positive, making short-term pullbacks potential accumulation opportunities rather than indications of a trend reversal.
 Long
Long
BITCOIN 1:6 RISK-REWARD TARGET ACHIEVED🚨 Bitcoin Trade Recap: 1st Stop Loss Hit ❌ | 2nd Entry Delivered Massive 1:6 RR Profit ✅🔥
Discipline beats emotions in trading 📈
❌ 1st Bitcoin short trade hit stop loss exactly as planned.
✅ Waited patiently for the setup to confirm again.
🚀 2nd entry from the breakdown zone delivered a perfect **1:6 Risk-Reward target** with exact levels.
This trade proves that a single losing trade means nothing when risk management and patience are followed correctly.
🔹 1st Trade → Stop Loss Hit
🔹 2nd Entry → 1:6 RR Target Achieved
🔹 Price Action + Risk Management + Patience = Profit
No revenge trading. No emotions. Just execution according to the plan.
Follow * for daily market analysis, Bitcoin setups, Nifty analysis, stock market education and institutional trading concepts.
bitcoin analysis, bitcoin trade, btcusd analysis, bitcoin short trade, crypto trading, bitcoin breakdown trade, risk reward trading, 1 to 6 risk reward, price action trading, smart money concepts, ict trading, ict concepts, supply and demand trading, support and resistance, liquidity sweep, market structure break, breakout trading, breakdown trading, institutional trading, crypto analysis, intraday trading, scalping strategy, technical analysis, trading psychology, risk management, stop loss strategy, sniper entry, trading discipline, cryptocurrency market, bitcoin price prediction
#Bitcoin #BTC #CryptoTrading #PriceAction #ICTTrading
❌ 1st SL Hit
✅ 2nd Entry = 1:6 RR Profit
🔥 Exact Levels | Perfect Execution
 Short
Short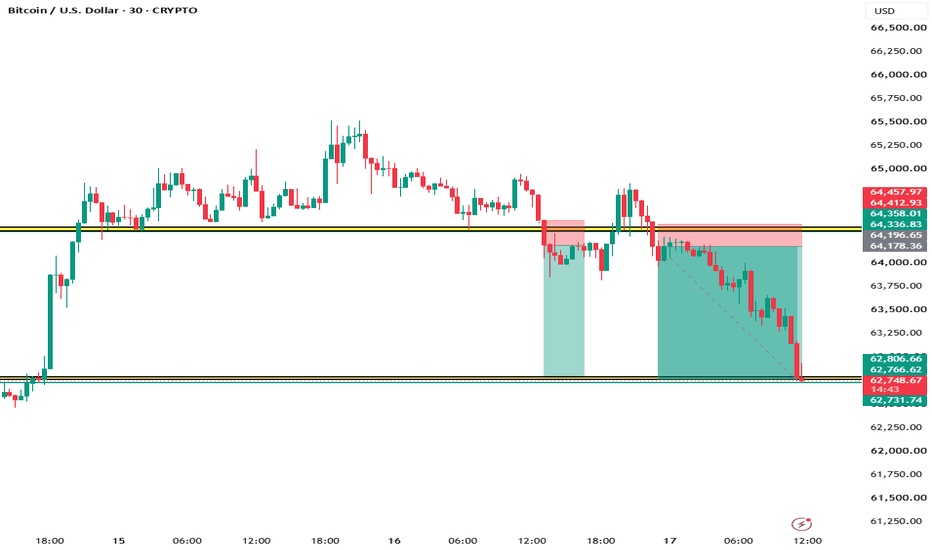
Market Cycles:Every trader has experienced it.
A market that seemed unstoppable suddenly loses momentum.
A long downtrend unexpectedly turns into a powerful rally.
News outlets search for explanations after the move has already happened, while traders wonder how the trend changed so quickly.
The truth is that markets rarely move in a straight line forever.
They evolve through cycles.
Every bull market, every bear market, and every period of consolidation is part of a repeating process driven by human behavior, supply and demand, and changing expectations.
Understanding these cycles doesn't allow you to predict every turning point, but it does help you understand **where the market may be in its journey**.
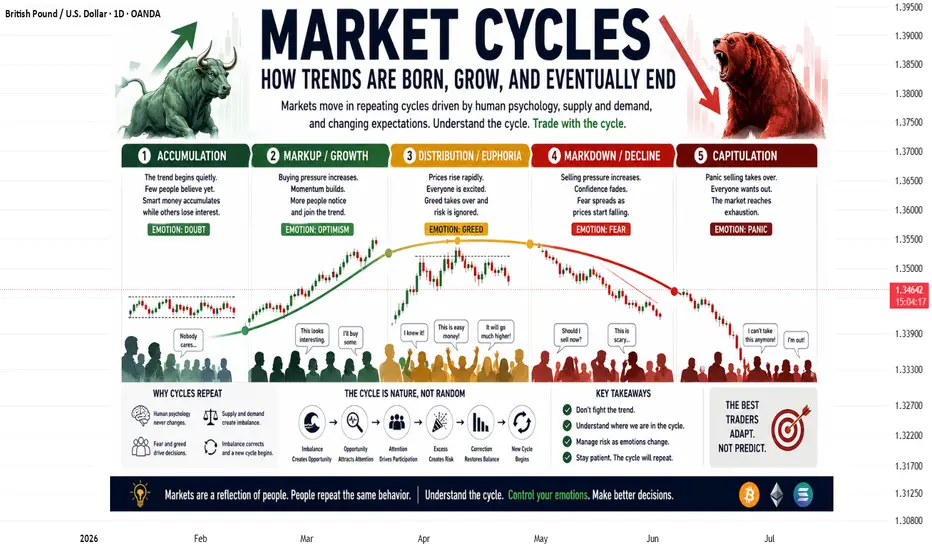
Every Trend Begins Quietly
Most major trends don't start with excitement.
They begin when very few people believe in them.
After a prolonged decline, pessimism is widespread.
News remains negative.
Many traders have already given up.
Yet beneath the surface, buyers slowly begin accumulating positions.
Price stabilizes.
Selling pressure weakens.
The market stops making aggressive new lows.
This stage is often called accumulation.
Confidence is low, but the balance between buyers and sellers is beginning to shift.
Momentum Attracts Attention
As buying pressure increases, price starts making higher highs and higher lows.
At first, only experienced traders notice.
Then momentum traders join.
Analysts begin changing their outlook.
Positive news becomes more common.
The trend becomes visible to everyone.
This is the growth phase of the cycle.
Confidence replaces doubt, trading volume often increases, and more participants enter the market.
The trend feeds on itself as optimism spreads.
Euphoria Often Appears Near the Top
No trend lasts forever.
As prices continue rising, emotions begin replacing logic.
Success stories dominate social media.
Friends and family who never cared about investing suddenly start asking how to buy.
Many traders stop focusing on risk.
Instead, they believe prices can only move higher.
This is the distribution phase.
Large, experienced participants may begin taking profits while enthusiasm among retail traders reaches its highest level.
The market still looks strong, but the balance between buyers and sellers is quietly changing.
Decline Begins Before Most People Notice
Market tops are rarely obvious.
The first signs often appear as weaker rallies and failed breakouts.
Volatility increases.
Good news has less impact.
Selling pressure gradually grows.
Eventually, confidence gives way to uncertainty.
Some investors take profits.
Others hold on, convinced the correction is temporary.
As selling accelerates, fear spreads.
This marks the beginning of the **markdown phase**, where supply overwhelms demand and prices move lower.
Why Cycles Repeat
Technology changes.
Trading platforms improve.
New financial products appear.
But one thing remains remarkably consistent:
Human nature.
People still experience fear, greed, hope, regret, and overconfidence.
These emotions influence buying and selling decisions just as they did decades ago.
Because human psychology changes very little, market cycles continue to repeat across stocks, forex, cryptocurrencies, commodities, and other financial markets.
The names of the assets may change, but the emotional journey remains surprisingly familiar.
News Usually Follows the Trend
One of the biggest surprises for new traders is realizing that markets often move **before** the headlines explain why.
Positive news frequently appears after a strong rally has already begun.
Negative headlines often dominate after prices have fallen significantly.
This doesn't mean news is unimportant.
It means markets are forward-looking.
Prices reflect expectations about the future, not simply current events.
Understanding this helps traders avoid chasing headlines after much of the move has already occurred.
Recognizing the Stage Matters More Than Predicting the Exact Top
Many traders become obsessed with calling the exact market top or bottom.
In reality, that is rarely necessary.
A more useful approach is asking:
Is the market accumulating or distributing?
Is momentum strengthening or weakening?
Are emotions driven by fear or greed?
Is participation expanding or fading?
These questions provide context.
And context often leads to better decisions than trying to predict exact turning points.
Final words:
Markets don't move randomly from one candle to the next.
They progress through repeating cycles shaped by supply and demand, changing expectations, and human emotion.
Every major trend begins quietly.
It grows as confidence spreads.
It reaches a point where optimism becomes excessive.
Eventually, it weakens as emotions shift and a new cycle begins.
The traders who consistently succeed are not the ones trying to predict every twist and turn.
They are the ones who understand where the market is within the cycle and adapt their decisions accordingly.
Because while markets constantly change, the behavior of the people participating in them rarely does.
DON'T TRADE GOLD TODAY UNTIL YOU READ THIS!For the past two days, I have been consistently saying that sellers remain in control of Gold and that the overall market structure is still bearish. Based on that, I expected a strong selling move, and that's exactly what we witnessed. We finally got a solid bearish continuation along with a daily close below $4000.
Now the big question is: What should we expect on the last trading day of the week?
Make sure you read this psychological analysis carefully because it will not only help you understand the market psychology but also give you a clear trading plan for today's session.
We have now reached a very important area, and the close below $4000 has changed market sentiment significantly. As soon as the market closed below this major psychological level, many retail traders randomly jumped into selling positions. At the same time, another group of traders is still trying to fight for buying opportunities above $3950, mainly because the $3944-$3975 zone has acted as a strong demand area in the past.
Even today, you can see Gold attempting to hold support around $3970. This is the same area from which Gold previously delivered a short-term reversal, and because of that, many emotional buyers are entering the market with stop losses below $3950, hoping that another bullish reversal will happen.
However, I believe those expectations are likely to be disappointed.
Despite the aggressive bullish rallies we have seen over the last several days, my view has remained unchanged. Those sharp buying moves were never enough to change the higher-timeframe trend. Instead, I believe they were simply inducement moves designed to attract buyers into the market before another wave of selling.
The overall higher-timeframe structure is still strongly bearish, and as long as that structure remains intact, I will continue to favor selling opportunities over buying. If you decide to buy, I believe it is much safer to trade with smaller position sizes. My main focus is still on catching the next larger bearish move.
Friday Trading Plan
For Friday, I prefer to be slightly less aggressive because Gold is already trading below $4000 and very close to this year's lows. At these levels, both buyers and sellers become extremely emotional, which usually increases volatility and creates false moves.
Because of that, my focus today will mainly be on smaller intraday scalps rather than chasing aggressive positions.
I believe Gold is likely to spend most of today's session trading above $3960 and below $4017.
Just as the market repeatedly trapped buyers above $4000 before delivering the recent sell-off, there is a good possibility that Gold may now spend some time above $3950, keeping buyers interested while simultaneously frustrating sellers before the next impulsive bearish move begins.
Today's session could simply become a battle between buyers and sellers inside this lower price range.
However, my overall bias remains unchanged.
I still consider $4017 to be an excellent selling zone, and I remain strongly bearish below $4028. From those levels, I will continue looking for selling opportunities targeting $3944, $3921, $3908, and eventually $3890.
Until then, I have no interest in planning any short-term buying trades. My focus remains entirely on following the higher-timeframe bearish trend.
I hope you found this analysis logical, valuable, and educational. My goal is not only to share a trading plan but also to help you understand the psychology behind every move the market makes.
Good luck for the final trading day of the week. I wish everyone a profitable trading session.
What is your view on Gold? Do you think the bearish trend will continue, or are you expecting a reversal?
Let me know your opinion in the comments.
NIFTY 50 | Compression Before Expansion? | 15-Minute Trade PlanNIFTY continues to trade inside a tight consolidation range, forming a sequence of lower highs while repeatedly defending the 24,000–24,050 support zone. This type of price compression often precedes a sharp directional move, making the next breakout critical.
The broader market remains supported by domestic liquidity, but global sentiment is still driven by U.S. rate expectations, FII flows, earnings season, and geopolitical developments. A decisive move beyond the current range is likely to determine the next intraday trend.
Key Levels
🟢 Bullish Trigger: Sustained breakout above 24,082
🎯 Upside Targets: 24,199 → 24,250 → 24,293
🔴 Bearish Trigger: Sustained breakdown below 24,100
🎯 Downside Targets: 24,008 → 23,953 → 24,904
Chart Highlights
✔ Lower Highs indicate weakening buying momentum.
✔ Strong support around 24,000–24,050 remains intact.
✔ Range-bound structure suggests volatility expansion is approaching.
✔ Wait for confirmation—avoid trading inside the range.
"The market is building energy, not direction. Let price confirm the breakout before committing capital."  Long
Long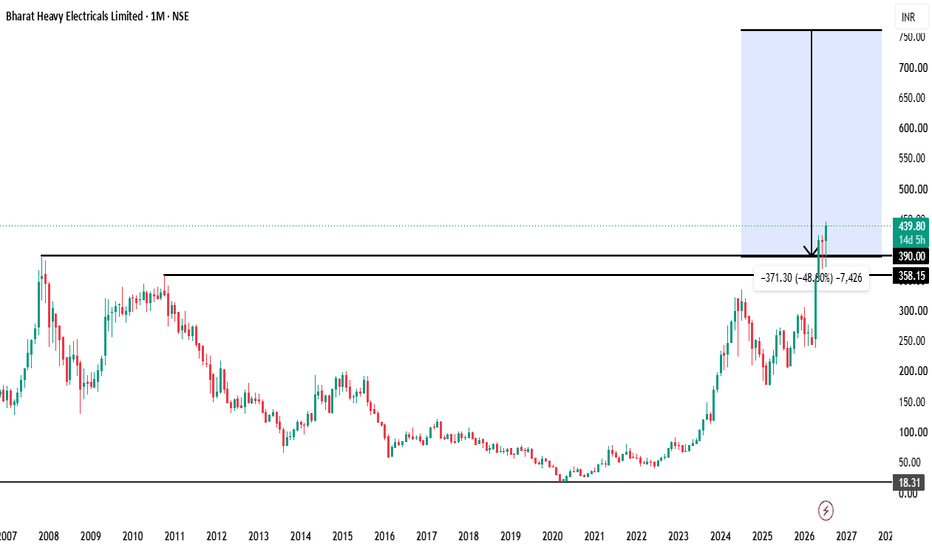
XAUUSD 3970 sweep — 4021 first trap XAUUSD 3970 sweep — 4021 first trap
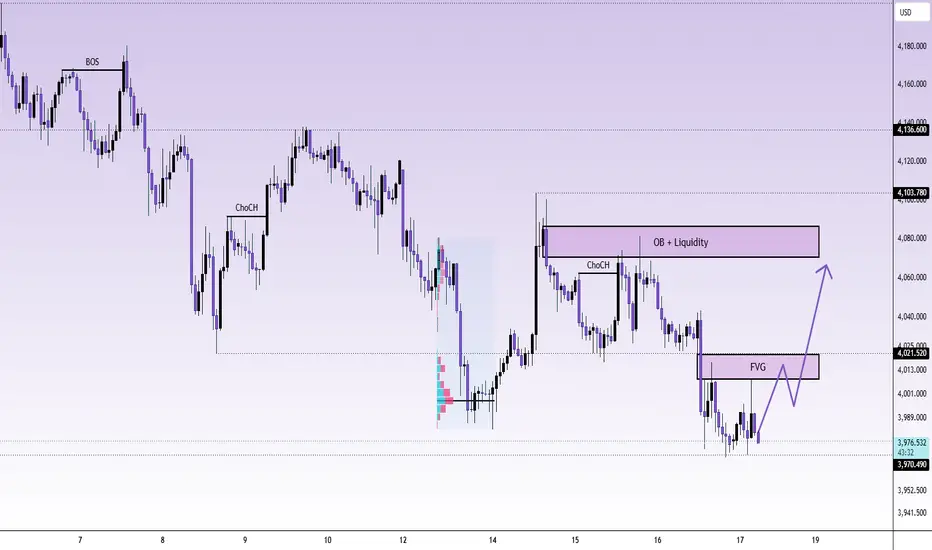
That 3,970 sweep is the whole setup now.
Gold dropped into the monthly low area, bounced a bit, but don’t let that little recovery fool you too fast. The structure is still heavy. Lower highs. Breakdown. Weak reclaim. Sellers still pressing from above.
Macro is not helping bulls much either. US-Iran tension keeps risk messy, inflation fear is still alive, and Fed rate-hike talk gives USD a reason to stay bid. So yeah, gold can bounce. But the bounce can still be just bait.
Main bias stays bearish while price sits below 4,021 and 4,058.
The first trap zone is the FVG around 4,010 - 4,021. If price pushes into that area and starts rejecting, that’s where late buyers can get stuck. Above that, the bigger pain zone is 4,068 - 4,085, the OB + liquidity area. That is the cleaner premium zone for sellers.
I’m not chasing shorts at 3,970 though. Too late down there.
Trading scenario:
Sell idea only if gold pulls back into 4,010 - 4,021 and rejects, or stretches deeper into 4,068 - 4,085 and fails.
Entry zone: 4,010 - 4,021 after rejection
Deeper sell zone: 4,068 - 4,085
Stop loss: above 4,103
TP1: 3,970
TP2: 3,961
TP3: 3,943
No rejection, no sell. Simple.
If gold closes back above 4,103, this short idea gets messy. Then price can squeeze higher before sellers try again.
For now, this still looks like weak bounce into supply.
You selling the FVG retest, or waiting for 4,085?
Long 
 Long
Long
NIFTY : 8-Day Consolidation within one candle range ??
NIFTY Daily Analysis: 13-Day Consolidation Suggests a High-Probability Breakdown Setup
The market has now spent nearly 13 trading sessions consolidating within the range of a single large bearish candle. This is one of the strongest signs that buyers and sellers are locked in a battle, with neither side able to establish dominance.
When a market repeatedly fails to break above the high or below the low of one impulsive candle for several weeks, it usually indicates that institutions are accumulating or distributing positions before the next directional move.
What the chart is telling us
The entire price action after the sharp sell-off has remained trapped inside the range of one dominant bearish candle.
Every rally has been rejected before reaching higher resistance.
Every dip has found buyers near support, creating a compression pattern.
Volatility has contracted significantly, suggesting that a larger expansion phase could be approaching.
Markets generally do not remain inside such a narrow range forever. The longer the consolidation, the stronger the eventual breakout or breakdown tends to be.
Key Resistance 24,533
This is the immediate resistance zone where sellers have repeatedly defended price.
A sustained move above this level would invalidate the current bearish expectation and could trigger fresh buying momentum.
Key Breakdown Level 23,910 (Daily Closing Basis)
This is the most important level on the chart.
I am not interested in intraday breaks or temporary spikes below support.
The bearish setup activates only if NIFTY gives a daily close below 23,910.
A confirmed daily close below this level would indicate that sellers have finally absorbed demand and the consolidation has resolved to the downside.
Potential Target
If the breakdown confirms, Target: 23,080
This represents approximately a 3% downside move, offering close to a 1:1 risk-reward based on the current structure.
The projected decline also aligns well with the measured move of a possible AB = CD harmonic completion, adding further confluence to the bearish scenario.
Why I Prefer Waiting for Confirmation
One of the biggest mistakes traders make is anticipating a breakout before the market confirms it.
Inside prolonged consolidations, false breakouts are common.
Instead of predicting the move, I prefer reacting only after the market confirms direction with a daily closing breakdown.
Patience often provides cleaner entries and better probability trades.
Trading Plan
Bullish Scenario
Daily close above 24,533 (sellers stop loss level)
Bearish view becomes invalid.
Buyers regain control.
Bearish Scenario (Preferred)
Daily close below 23,910 Look for short opportunities.
Downside target around 23,080.
Until one of these levels breaks, NIFTY remains in a neutral consolidation phase.
Final Thoughts
This is not a prediction but a probability-based trading setup.
The market has spent almost three weeks respecting the range of a single candle, which often precedes a significant directional move.
The key is to stay patient, let price confirm the breakout or breakdown, and trade only after confirmation rather than trying to guess the next move.
Levels to Watch
🔴 Resistance: 24,533
🔵 Breakdown Trigger: 23,910 (Daily Close)
🟢 Downside Target: 23,080
 Short
Short
Thirteen Years Later, The Chart RememberedThe Timeframe
Each candle on this chart represents three months of price action. On this scale, what unfolds is not weeks or even years of behavior but multi decade structure.
2007: The Supply That Held for Thirteen Years
In 2007, this stock reached a high that would go on to define its ceiling for the next thirteen years. Every attempt to move above that level failed.
2020: The Breakout After Thirteen Years
In 2020, the stock finally broke through that same 2007 supply zone. This was not a minor technical event. Breaking a level that held for thirteen straight years carries real structural significance. Following the breakout, price sustained above the zone and went on to create a fresh all time high.
Consolidation Above the Breakout
Above this newly flipped zone, the chart shows a consolidation pattern. This refers to a series of candles moving in a relatively sideways manner following a strong rally, as the market pauses to hold and absorb the gains
The Trendline from 2013
A trendline drawn from 2013 has continued upward and is still relevant on the chart today. A trendline is simply a line connecting a series of highs or lows that reflects the underlying direction and structure of price over time
Disclaimer: This post is purely educational and observational in nature based on historical price action on a three month timeframe. It does not constitute financial advice, a forecast, or a recommendation to buy, sell, or hold any security
 Long
Long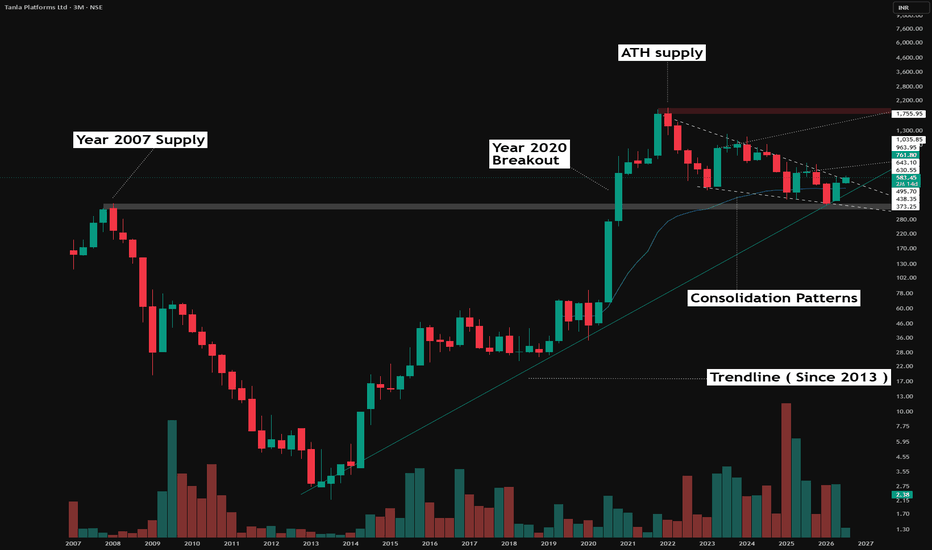
XAUUSD: Demand Reacts, But Sellers Still Wait Above XAUUSD: Demand Reacts, But Sellers Still Wait Above
Market Context
Gold is recovering slightly from the monthly low area, but the upside still looks limited. US-Iran tensions, inflation concerns, and stronger USD demand continue to pressure gold, while expectations of a more restrictive Fed stance keep buyers cautious.
The market is not showing a clean bullish reversal yet. The current bounce is more like a technical reaction from demand, not a confirmed trend shift.
Key point: gold is reacting from demand, but sellers may return if price rebounds into 4,055 - 4,080.
Technical Structure
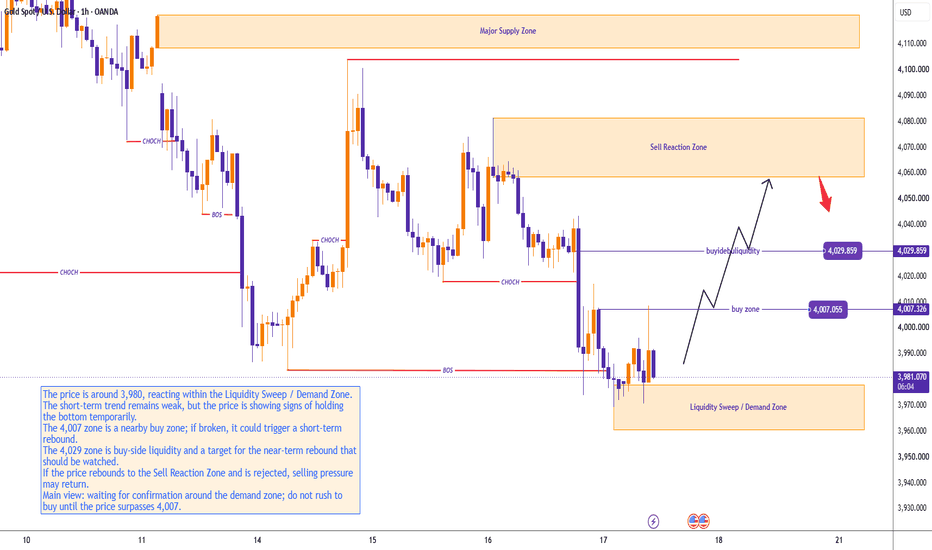
Gold is trading around 3,983 after reacting inside the Liquidity Sweep / Demand Zone.
The short-term trend remains weak. Price is holding the bottom temporarily, but buyers still need to reclaim 4,007 first before a stronger rebound can develop.
Above that, 4,029 is the next buy-side liquidity target. If price reaches this area and keeps momentum, gold may extend toward the Sell Reaction Zone at 4,055 - 4,080.
However, as long as price remains below the major supply structure, rallies should still be treated carefully. The broader bearish setup still supports fresh selling pressure at higher prices.
Key Levels
Current Price: 3,983
Demand Zone: 3,960 - 3,980
Buy Zone: 4,007
Buy-side Liquidity: 4,029
Sell Reaction Zone: 4,055 - 4,080
Major Supply Zone: 4,105 - 4,120
Bullish Above: 4,029
Bearish Below: 3,960
Trading Plan
Buy Scenario
Entry: Above 4,007 after bullish confirmation
SL: Below 3,960
TP: 4,029 / 4,055 / 4,080
Condition: Price must hold the demand zone, reclaim 4,007 with strength, and form a clear bullish CHOCH. This is only a short-term rebound setup, not a full reversal.
Sell Scenario
Entry: 4,055 - 4,080 after bearish confirmation
SL: Above 4,105
TP: 4,029 / 4,007 / 3,980
Condition: Price rebounds into the Sell Reaction Zone but fails to continue higher. Bearish rejection from this area would confirm that sellers are still defending the structure.
Sell at Major Supply
Entry: 4,105 - 4,120
SL: Above 4,140
TP: 4,080 / 4,029 / 4,007
Condition: Price sweeps higher into major supply and gets rejected. This would be a stronger sell setup if the rebound becomes extended.
Breakdown Sell
Entry: Below 3,960
SL: Above 3,983
TP: 3,940 / 3,920 / 3,900
Condition: Demand fails, retest is rejected, and bearish momentum continues. This would confirm that the bounce has failed.
Overall Bias
Gold is reacting from demand, but the structure is still not bullish. Buyers need to reclaim 4,007 and 4,029 before the recovery can become stronger.
Until then, the main plan is to watch for a short-term rebound first, then look for seller reaction around 4,055 - 4,080.
Best approach: wait for confirmation at demand or resistance. Do not chase the bounce while gold is still below the sell reaction zone.
Will buyers reclaim 4,029, or will sellers use this rebound to push gold back below demand?
Long