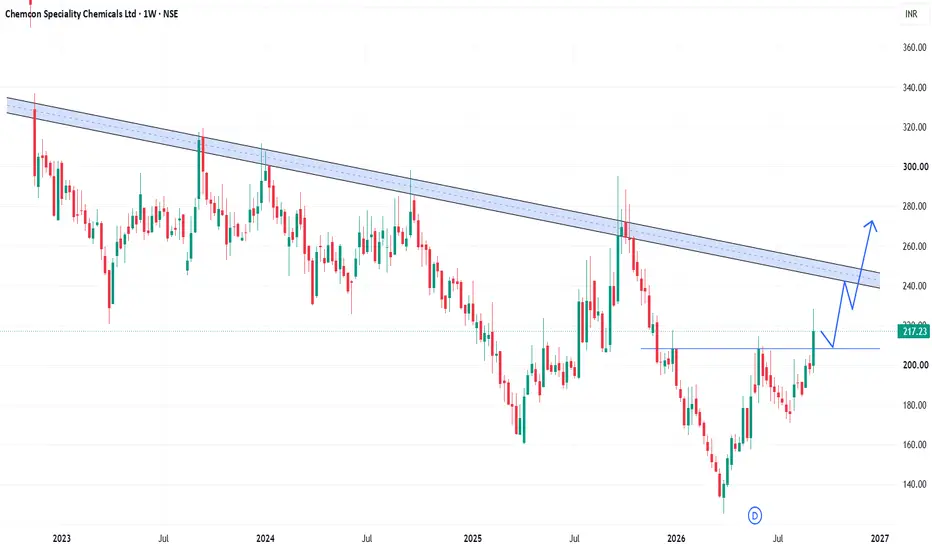
Banknifty Intraday Analysis for 15th September 2026NSE:BANKNIFTY
Uptrend will be formed if index sustains above 57000 and on the contrary index has strong support near 56000 level.
The upward moment may lead the Index to 57300 – 57400 resistance range in upward momentum and if the index crosses and sustains above this level then may reach near 58000 – 58100 range.
On the contrary, The downward moment may drag the Index to 55900 – 55800 support range in downward momentum and if this support is broken then the index may tank near the 55200 –
Trend Lines
Finnifty Intraday Analysis for 15th September 2026NSE:CNXFINANCE
Index is near 25500 support and uptrend momentum expected to be formed if the index breaks and sustains above 25800. On the contrary, if 25500 support is broken again the downward risk upto 25000 level is expected.
The upward movement may lead the Index to 25800 - 25850 resistance range and if the index crosses and sustains above this level then may reach near 26100 - 26150 range.
On the contrary, The downward moment may drag the to 25300 – 25250 support range and if th
Midnifty Intraday Analysis for 15th September 2026NSE:NIFTY_MID_SELECT
The index is in the 14500 - 14800 range and the decisive trend on either side will be confirmed if the index breaks and sustains on either side of the range.
The upward movement may lead the Index near 14725 – 14750 resistance range and if the index crosses and sustains above this level then may reach 14900 – 14925 range.
On the contrary, The downward moment may drag the index to 14425 – 14400 support range and if this support is broken then index may tank near 14250
WELINV: The Ascending Pressure Cooker and Explosive Vertical Bre1. The Macro Perspective: The Aggressive Accumulation Trend
I am taking a LONG bias on Welspun Investments & Commercials Ltd. (WELINV) on the weekly (1W) timeframe.
When analyzing pure market structure, the steepness of a trendline tells you everything you need to know about institutional urgency. Look at the massive structural development on this chart. After recovering from its macro lows, the stock established a steep, unbroken ascending trendline. Every single time the price pulled back, he
STARHEALTH : A Demand and Supply StudyNSE:STARHEALTH was being weak since its IPO debut but on Apr-2025 the down move was being hold with nice volume expansion which can be consider as a top notch demand area/zone at bottom. Afterward, price had move upward with strength that neutralized near by weekly / monthly supply zone. Each pull back resulted from the supply zone get supported / respected from the nearest demand area that was being freshly formed, expressed as Demand was Stronger then the Supply at that time phrase of price
ANOTHER BUY ATTEMPT IN AUDUSDIn our previous trade, we were failed. The trade was executed but stopped out when the price hovered the Yellow trendline drawn on 4H Timeframe.
Why I am going Bullish again? its just because of:
Bullish Divergence at 4H Timeframe.
Bullish Divergence at Hourly timeframe.
Both of the above are supported by 4H Trendline.
Nice HH and LH on both Daily and 4H Time frames.
Price above 50 EMA and 89 EMA.
the prvious Bearish Divergence is now converted into Bullish Divergence.
Trade se
Bullish Setup - EURUSDBullish Score
Double bottom on 4H with RSI divergence.
Retracement from Lower trendline on 4h
4h and Daily Bias is Bullish
Bearish Score:
Price is still below 50 EMA on 1H Time frame
1H Biash is Bearish.
Once the above bearish score converts into Bullish score then we will buy on the suggested swing after 1H forming its first Higher High and closing above 50 EMA. We will then take our position on the breakout of new Higher High probably at 1.16121
SL is 1.15692. If price breaks this SL withou
JSWINDRA: Contraction before Expansion ?NSE:JSWINFRA is currently showing a clear price-compression structure , with successive reactions occurring between a descending overhead resistance near ₹355–360 and a rising support structure around ₹330–335.
The Price is holding above the 20/50/100/200-day EMAs, expressing The Broader Trend remains constructive. The price also holding above LOC as well as Trend cloud expressing an additional confirmation towards the hypothesis.
The current price action on daily chart expressing price c
Nifty 50 : Trendline Support Holding, 50 EMA Still the Big TestOverview
Quick weekend look at the bigger picture on Nifty. On the weekly chart, two things stand out right now: a rising trendline support that's been holding nicely, and a resistance zone around the Weekly 50 EMA that price keeps trying (and failing) to clear.
What's Happening
Since the March low, Nifty has been climbing steadily along a rising trendline, currently sitting under the price. That trendline has done its job well so far — every dip toward it has found buyers.
At the same time, p
NIFTY Weekly View — Doji at Resistance Signals IndecisionOverview
Nifty closed the week at 24,570.65, up 187 points or 0.77%. But the real story isn't the small gain, it's the shape of this week's candle. Nifty printed a doji right at the resistance zone, open and close almost identical, after tagging a high of 24,774.30. That's a classic sign of hesitation at a decision point, and it comes exactly where we expected the market to be tested.
Follow-up on Last Week's View
Last week we flagged Nifty right at the descending resistance line, needing a c
NIFTY : Key Fibonacci Levels & Trading Plan for TomorrowNIFTY closed at 23,431.50, continuing the recent weakness from the upper portion of the rising-wedge structure. Tomorrow, the reaction around the key Fibonacci levels will be important.
Key Fibonacci Levels
38.2% — 23,784.25
50% — 23,478.45
61.8% — 23,172.60
The 50% Fibonacci level at 23,478 is the immediate decision zone, while 61.8% at 23,172 is the next major downside reference.
🟢 Bullish Scenario — Confirmation Required
Do not chase the first move.
If NIFTY reclaims 23,478–23,500 and g
XAUUSD — Bearish Channel Toward 4,175XAUUSD — Bearish Channel Toward 4,175
Gold is still moving inside a clear bearish channel after failing to reclaim the upper resistance trendline. From Kelly’s view, the chart suggests that XAUUSD remains under downside pressure, and the current recovery may only be a short correction before the next bearish wave continues.
The key idea is simple: gold is trading near the sell zone, and if buyers fail to break above this area, sellers may push price back toward lower support and the final targ
Parag Milk - Trend Line & Consolidation BOParag Milk is taking a bounce from weekly Trend line and it has done the same. It has also consolidated over 2+ months and then give a breakout. Few things which make this stock interesting:
Fundamental:
1. Highest Q1 topline, which used to be a weak quarter
2. 2 of its products are growing by 60%
3. Moving away from conventional mikl company - moving towards higher margin product
Technical:
1. Respecting weekly trend-line
2. Consolidation for 2+ weeks and BO
This stock is posed to a go
XAUUSD — Medium-Term Bearish Wave Toward 3,836
Gold is showing a medium-term bearish Elliott Wave structure after failing to recover above the descending channel resistance. From Kelly’s view, the chart suggests that XAUUSD is still moving inside a broader downside trend, and the current rebound may only be a correction before the next bearish wave continues.
The key idea is simple: gold may retest support first, then create a short recovery, but as long as price stays below the descending trendline and resistance structure, the priority
XAUUSD — Bullish Retest Toward 4,425XAUUSD — Bullish Retest Toward 4,425
Gold is showing a short-term bullish recovery after completing the previous downside wave near the lower support area. From Kelly’s view, the current chart suggests that XAUUSD may be forming a corrective bullish structure, with price now reacting from the 4,334–4,340 buy retest support zone.
The key idea is simple: if gold holds above this support, the next recovery leg may continue toward the 4,420–4,435 strong resistance area.
⟡ Market structure
Gold r
Nifty Intraday Analysis for 11th September 2026NSE:NIFTY
Index is near 23500 resistance level and uptrend momentum expected to be formed as long as the index sustains above 23500 and if 23500 resistance is not broken, the downward risk upto 23250 - 23200 range is expected.
The upward movement may lead to 23700 – 23750 resistance range and if the index crosses and sustains above this level then may reach near 23950 – 24000 range.
On the contrary, The downward moment may drag the Index to 23250 – 23200 support range in downward mom
Banknifty Intraday Analysis for 11th September 2026NSE:BANKNIFTY
Index is near resistance and uptrend momentum expected to be formed as long as the index sustains above 56700 - 56800 range, else, the downward risk upto expected if 56200 - 56000 support range broken.
The upward moment may lead the Index to 57200 – 57300 resistance range in upward momentum and if the index crosses and sustains above this level then may reach near 57900 – 58000 range.
On the contrary, The downward moment may drag the Index to 55800 – 55700 support range in d
Finnifty Intraday Analysis for 11th September 2026NSE:CNXFINANCE
Index is near 25500 support and uptrend momentum expected to be formed as long as the index sustains above 25500 and if 25500 support is broken again the downward risk upto 25000 level expected.
The upward movement may lead the Index to 25800 - 25850 resistance range and if the index crosses and sustains above this level then may reach near 26100 - 26150 range.
On the contrary, The downward moment may drag the to 25250 – 25200 support range and if this support too is bro
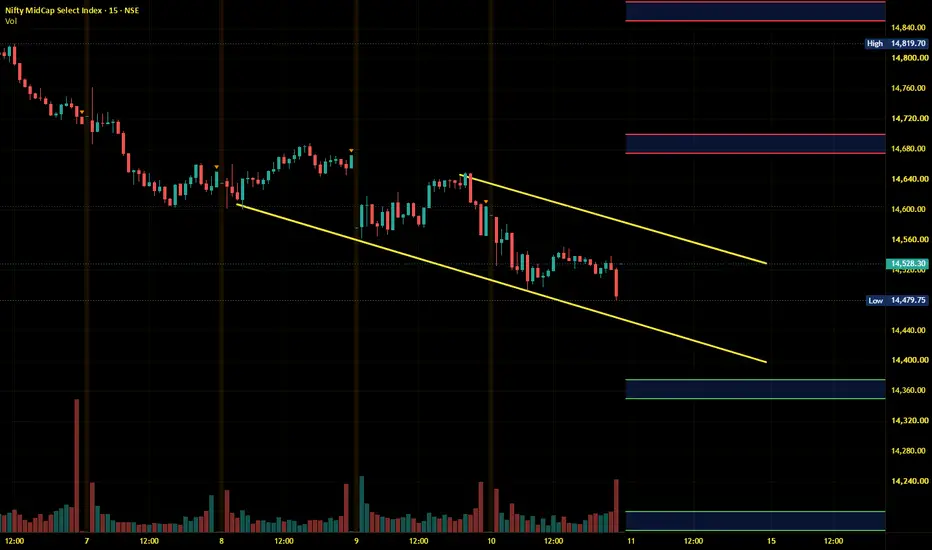
Midnifty Intraday Analysis for 11th September 2026NSE:NIFTY_MID_SELECT
Index is near 14500 support level and bounce from the support level is expected as long as the support is not broken. However, the range bound moment is expected between 14500 - 14800 range.
The upward movement may lead the Index near 14675 – 14700 resistance range and if the index crosses and sustains above this level then may reach 14850 – 14875 range.
On the contrary, The downward moment may drag the index to 14375 – 14350 support range and if this support is bro
Gold Aiming Bullish setup towards 4639 and 4840
PEPPERSTONE:XAUUSD is currently consolidating beneath a descending trendline resistance, while a strong horizontal resistance is also sitting around 4,443.77 .
The price is approaching a critical decision zone. A confirmed breakout above 4,443.77 , together with a break of the descending trendline, could open the way for a larger bullish move.
I am bullish on Gold because of:
Descending trendline has been acting as dynamic resistance.
4,443.77 is the key horizontal resistance.
Pr
AUDUSD Bullish Move expectedDaily TF is strongly bullish.
4H is also bullish enough to be traded.
Bullish Triggers
4H Trendline respected multiple times
Nice HH and LH on both Daily and 4H Time frames.
Price above 50 EMA and 89 EMA
Bearish Triggers
RSI on 4H time frame.
Trade
Time frame: 1H
Buy Stop: 0.72177
SL: 0.71551
TP 1: 0.72939
TP 2: 0.7400