


Nifty 50: The Breakdown is ConfirmedThe Nifty 50 Index has definitively broken below its multi-month rising trendline and the immediate 23,800 support level. Currently trading at 23,779.15, the bearish structure is fully intact.
Trade Setup: Bearish Continuation (~65% Probability)
Trigger: The breakdown is already active. Look to "sell on rise," shorting any minor relief bounce toward the 23,800 – 23,850 resistance zone.
Target: 23,700 (immediate support), followed by the major structural target of 23,600.
Stop-Loss: A strict daily close back above 23,900.
Invalidation: A sharp recovery that decisively reclaims the 23,900 level traps the bears and invalidates the continuation setup, shifting the focus to a relief rally.
Disclaimer: Technical analysis deals in probabilities. Always employ strict risk management and utilize stop-losses to protect your capital.  Short
Short
XAU/USD - Rounding Bottom Builds Structure, Next BullsHi Traders!
OANDA:XAUUSD is trying to build a bullish recovery after forming a clear rounding bottom around the recent lows. Price is now holding inside the 4,370–4,430 buy zone, while the descending trendline remains the main barrier overhead.
For me, the bullish setup becomes much cleaner if buyers continue defending this zone and price breaks and holds above the trendline. That would confirm a stronger shift in short-term structure and open the way toward:
🎯 Target 1: 4,550
🎯 Target 2: 4,600
The key point is that I’m not interested in chasing before resistance gives way. The better sequence is support holds → trendline breaks → continuation.
A sustained H1 move below 4,370 would weaken the recovery setup and suggest sellers still have control.
AURICVERSE View: the base is forming, but the breakout is the confirmation. If 4,370–4,430 holds and the descending trendline finally breaks, 4,550–4,600 becomes the next area on my radar.
Breakout next, or one more test of the buy zone first?  Long
Long
 Short
Short
BTCUSDT: Next Upward SessionBTCUSDT is trading around 79,835 USDT after breaking out of a descending channel and surging to the 81,800–82,000 range. Despite a current pullback, the H4 structure remains bullish as BTC holds above the EMA34 (around 79,440) and EMA89 (around 77,620).
The 78,500–79,500 zone now serves as key support, situated near the previous breakout area. If BTC pulls back to this level but finds continued buying support, I expect the price to rebound to 82,000 and subsequently extend toward the 83,500–84,000 USDT target zone.
The bullish scenario would weaken if BTC loses the 78,500 level, particularly if it falls back deep into the descending channel.
Will BTC hold the breakout zone and continue its push toward 84K? Long 
 Long
Long
NIFTY : Trading levels and Plan for 08-Sep-2026📊 NIFTY 50 — INTRADAY TRADING PLAN
📅 08-SEP-2026
⏱️ Timeframe: 15-Minute
📌 Previous Close: 23,759.40
━━━━━━━━━━━━━━━━━━━━━━━━━━━━━━
🔑 KEY LEVELS
━━━━━━━━━━━━━━━━━━━━━━━━━━━━━━
🔴 Major Resistance: 24,043–24,061
🔴 Last Intraday Resistance: 23,903
🔴 Opening Resistance: 23,839
⚪ Previous Close / Reference: 23,759
🟢 Opening Support: 23,721–23,757
🟢 Gap-Down Opening Support: 23,631
🟢 Last Intraday Support: 23,557
🔴 Major Downside Level: 23,435
━━━━━━━━━━━━━━━━━━━━━━━━━━━━━━
📈 MARKET STRUCTURE
━━━━━━━━━━━━━━━━━━━━━━━━━━━━━━
NIFTY is positioned between immediate support and resistance.
Bullish path:
23,839 → 23,903 → 24,043–24,061
Bearish path:
23,721 → 23,631 → 23,557 → 23,435
The strategy is to wait for price confirmation rather than predicting the direction at the open.
━━━━━━━━━━━━━━━━━━━━━━━━━━━━━━
🟡 SCENARIO 1 — FLAT / NEAR-FLAT OPEN
━━━━━━━━━━━━━━━━━━━━━━━━━━━━━━
If NIFTY opens around 23,700–23,820:
Avoid immediate entries during the initial range.
🟢 LONG SETUP:
Wait for a 15-minute candle to sustain above 23,839.
Preferred sequence:
Breakout → Retest → Bullish rejection → LONG
Entry:
Above confirmed 23,839 breakout/retest.
Stop Loss:
Below the retest low.
Targets:
T1: 23,903
T2: 24,043
T3: 24,061
If 23,903 breaks with strong acceptance, the bullish move can extend toward 24,043–24,061.
🔴 SHORT SETUP:
If price rejects 23,839–23,903 and subsequently breaks below 23,721:
Entry:
Below confirmed 23,721 breakdown.
Stop Loss:
Above the rejection swing.
Targets:
T1: 23,631
T2: 23,557
T3: 23,435 on sustained weakness.
━━━━━━━━━━━━━━━━━━━━━━━━━━━━━━
🚀 SCENARIO 2 — 100+ POINT GAP-UP
━━━━━━━━━━━━━━━━━━━━━━━━━━━━━━
A 100+ point gap-up would place NIFTY around 23,859 or higher.
⚠️ DO NOT CHASE THE GAP-UP.
First observe whether the market accepts or rejects the higher opening.
🟢 GAP-UP BULLISH SETUP:
If NIFTY opens above 23,839 and sustains above 23,903:
Wait for breakout + retest confirmation.
Entry:
Above 23,903 after successful retest.
Stop Loss:
Below the retest low.
Targets:
T1: 24,043
T2: 24,061
The 24,043–24,061 zone is a major resistance/supply area.
🔴 GAP-UP REJECTION SETUP:
If NIFTY opens above resistance but fails to sustain above 23,903 and produces strong bearish rejection:
Wait for opening-range breakdown.
Possible targets:
23,839 → 23,759 → 23,721
Do not short merely because the market opened with a gap-up. Wait for confirmation.
━━━━━━━━━━━━━━━━━━━━━━━━━━━━━━
🔻 SCENARIO 3 — 100+ POINT GAP-DOWN
━━━━━━━━━━━━━━━━━━━━━━━━━━━━━━
A 100+ point gap-down would place NIFTY around 23,659.
This would bring price close to the 23,631 support zone.
⚠️ DO NOT BLINDLY SHORT A LARGE GAP-DOWN.
🟢 GAP-DOWN RECOVERY SETUP:
If NIFTY opens near 23,631–23,659 and quickly reclaims 23,631 and then 23,721:
Wait for:
Reclaim → Retest → Higher Low → LONG
Possible targets:
23,757 → 23,839 → 23,903
🔴 GAP-DOWN CONTINUATION SETUP:
If NIFTY opens below 23,631, fails to reclaim it and breaks the opening-range low:
Entry:
Below confirmed breakdown.
Stop Loss:
Above failed-reclaim / opening-range high.
Targets:
T1: 23,557
T2: 23,435
━━━━━━━━━━━━━━━━━━━━━━━━━━━━━━
🟡 SCENARIO 4 — OPENING INSIDE 23,721–23,757
━━━━━━━━━━━━━━━━━━━━━━━━━━━━━━
This is the immediate opening-support zone.
If price remains inside this range:
NO TRADE.
Wait for directional confirmation.
Bullish trigger:
23,757 → 23,839
Bearish trigger:
23,721 → 23,631
Avoid taking trades in the middle of the range without confirmation.
━━━━━━━━━━━━━━━━━━━━━━━━━━━━━━
🚫 NO-TRADE / CHOPPY ZONE
━━━━━━━━━━━━━━━━━━━━━━━━━━━━━━
When price is moving sideways between support and resistance without a clear breakout or rejection:
AVOID OVERTRADING.
The objective is not to trade every candle.
The objective is to trade only when:
LEVEL + PRICE ACTION + CONFIRMATION = TRADE
━━━━━━━━━━━━━━━━━━━━━━━━━━━━━━
📈 BULLISH TRADE ROADMAP
━━━━━━━━━━━━━━━━━━━━━━━━━━━━━━
23,721–23,757 holds
↓
Higher Low
↓
23,839 breakout
↓
Retest
↓
23,903
↓
24,043–24,061
━━━━━━━━━━━━━━━━━━━━━━━━━━━━━━
📉 BEARISH TRADE ROADMAP
━━━━━━━━━━━━━━━━━━━━━━━━━━━━━━
23,721 breakdown
↓
Failed Retest
↓
23,631
↓
23,557
↓
23,435
━━━━━━━━━━━━━━━━━━━━━━━━━━━━━━
🧠 FIRST 15-MINUTE RULE
━━━━━━━━━━━━━━━━━━━━━━━━━━━━━━
The first 15 minutes should be used to identify:
• Opening Range High
• Opening Range Low
• Acceptance or rejection of key levels
• Breakout / breakdown structure
• Higher High + Higher Low
• Lower High + Lower Low
• Volume expansion
Avoid:
❌ Chasing gap-up openings
❌ Chasing gap-down openings
❌ Buying directly into resistance
❌ Shorting directly into support
❌ Trading in the middle of the range
❌ Revenge trading after a stop-loss
❌ Increasing position size after a loss
━━━━━━━━━━━━━━━━━━━━━━━━━━━━━━
🎯 TRADE MANAGEMENT
━━━━━━━━━━━━━━━━━━━━━━━━━━━━━━
Always define Entry, Stop Loss and Target BEFORE entering the trade.
Prefer setups offering approximately 1:2 or better risk/reward, depending on volatility and market structure.
After T1:
• Consider partial profit booking.
• Protect the remaining position.
• Trail the stop behind logical swing points.
• Never widen the original stop-loss to avoid taking a loss.
━━━━━━━━━━━━━━━━━━━━━━━━━━━━━━
📌 QUICK DECISION MATRIX
━━━━━━━━━━━━━━━━━━━━━━━━━━━━━━
Above 23,903 + sustain
→ BULLISH
→ Targets: 24,043–24,061
23,839–23,903
→ WAIT FOR BREAKOUT / REJECTION
23,721–23,757
→ OPENING SUPPORT / WAIT
Below 23,721
→ BEARISH
→ Targets: 23,631 → 23,557
Below 23,557 + sustain
→ STRONG BEARISH
→ Target: 23,435
100+ GAP-UP
→ DO NOT CHASE
→ Watch 23,903
100+ GAP-DOWN
→ DO NOT CHASE
→ Watch 23,631
━━━━━━━━━━━━━━━━━━━━━━━━━━━━━━
🏁 FINAL TRADE PLAN
━━━━━━━━━━━━━━━━━━━━━━━━━━━━━━
🟢 BUY ABOVE 23,839
Only after breakout + confirmation/retest.
Targets:
23,903 → 24,043 → 24,061
🚀 STRONG BUY ABOVE 23,903
Only after sustained breakout + successful retest.
Target:
24,043–24,061
🔴 SELL BELOW 23,721
Only after breakdown + confirmation.
Targets:
23,631 → 23,557
🔻 STRONG SELL BELOW 23,557
Only after sustained breakdown.
Target:
23,435
⚠️ AVOID:
Random entries between key levels without confirmation.
━━━━━━━━━━━━━━━━━━━━━━━━━━━━━━
📚 EDUCATIONAL DISCLAIMER
━━━━━━━━━━━━━━━━━━━━━━━━━━━━━━
This trading plan is based on support, resistance, market structure and opening-range behavior. It is designed for educational purposes and scenario planning, not for predicting the market with certainty.
A level is NOT an automatic buy or sell signal.
Always wait for price action confirmation.
Trade the reaction, not the expectation.
NO SETUP = NO TRADE.
Capital protection comes first.
⚠️ DISCLAIMER:
This content is for educational purposes only and should not be considered investment advice, a recommendation, or a guarantee of future market performance. Trading in futures and options involves substantial risk. Please conduct your own analysis and follow appropriate risk management before taking any trade.  Long
Long

XAUUSD — Bullish Wave 3 From Buy Zone
Gold is building a bullish recovery structure after completing the previous bearish wave near the lower area. From Kelly’s view, the current chart suggests that XAUUSD may be preparing for a new upside continuation while price is holding around the Buy zone wave 3.
The key idea is simple: gold may be forming wave (2) correction now, and if buyers defend the current buy zone, wave (3) can start pushing toward the upper liquidity levels.
⟡ Market Structure
Gold reacted strongly from the previous low near 4,280–4,300, showing that sellers lost momentum and buyers started to rebuild structure.
Price is now trading around 4,411, right above the Buy zone wave 3 near 4,390–4,410. This zone is important because it may act as the base for the next bullish impulse.
If this support holds, gold may continue higher toward 4,441, 4,476, and the strong liquidity zone near 4,510. A clean break above 4,510 would strengthen the bullish continuation toward the Resistance Fibonacci + FVG / Sell zone wave 4 around 4,585–4,605.
➤ Key Levels
◌ Current price area: 4,411
◌ Buy zone wave 3: 4,390–4,410
◌ First liquidity: 4,441
◌ Second liquidity: 4,476
◌ Strong liquidity: 4,510
◌ Resistance Fibonacci + FVG: 4,585–4,605
◌ Final wave 5 target: 4,725–4,740
◌ Bullish invalidation: below 4,360
⌁ Elliott Wave View
The chart shows a possible bullish Elliott Wave recovery.
Wave (1) formed after gold bounced from the lower demand area.
Wave (2) is now correcting back into the 4,390–4,410 buy zone.
If this zone holds, wave (3) may push price toward 4,510 and then 4,585–4,605.
After that, wave (4) may create a short pullback.
The final wave (5) target remains near 4,725–4,740.
This is why Kelly is not chasing buys too late. The cleaner plan is to wait for confirmation around the buy zone, then follow the bullish structure step by step.
▸ Trading Scenario
Preferred bullish scenario
Entry: Buy around 4,390–4,410 if price gives bullish confirmation from the Buy zone wave 3
Stop Loss: Below 4,360
Take Profit 1: 4,441
Take Profit 2: 4,476–4,510
Take Profit 3: 4,585–4,605
Take Profit 4: 4,725–4,740
Alternative entry
If gold breaks above 4,510 and retests this level as support, buyers may look for continuation toward 4,585–4,605.
◌ Invalidation
The bullish view becomes weaker if gold breaks below 4,360 and fails to reclaim the buy zone. In that case, wave (2) may extend lower and the bullish setup needs more confirmation.
⌁ Kelly’s View
Kelly’s main view remains bullish while gold holds above 4,390–4,410. The market is showing a recovery structure, and the current pullback may be only a correction before wave (3) continues higher.
If buyers defend the buy zone, gold may continue toward 4,441, 4,510, then the larger upside zone around 4,585–4,605. The bigger Elliott target remains near 4,725–4,740.
Do you think gold will start wave (3) from this buy zone, or retest lower before the next rally? Long 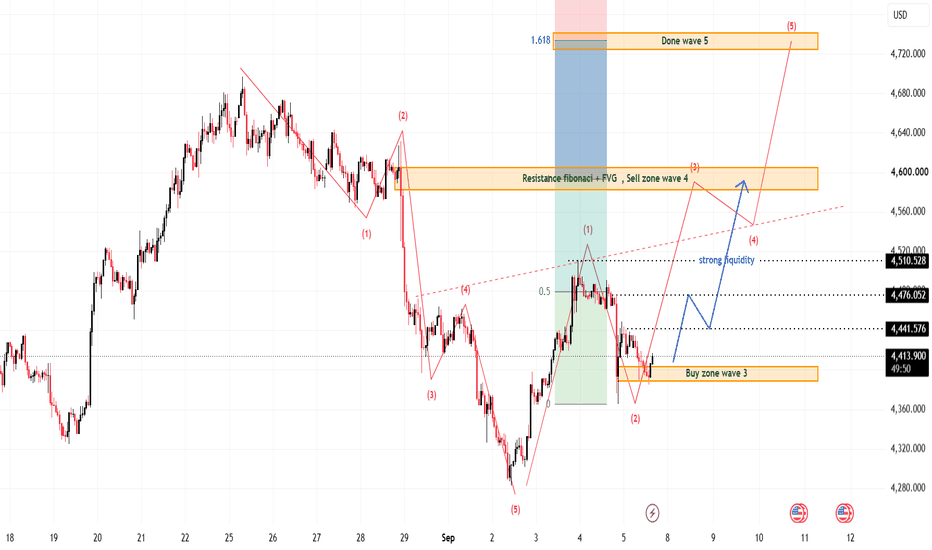
Long 
Education

 Education

 Education

 Education

#BANKNIFTY Intraday PE & CE Levels(07/09/2026)Bank Nifty is expected to open flat around the 57,370–57,400 zone, keeping the index close to the immediate support-resistance area. The recent price structure shows that the index has been moving in a range, with repeated attempts to sustain above 57,550 facing resistance. At the same time, the 57,050–57,150 zone has acted as an important support area, indicating that the market is currently waiting for a decisive breakout or breakdown.
On the bullish side, the first important level to watch is 57,450, followed by the stronger resistance at 57,550. If Bank Nifty manages to sustain above 57,550, buying momentum can strengthen and the index may move toward 57,750, followed by 57,850 and 57,950. A decisive move above 57,950 could further improve the overall structure and bring higher levels into focus.
On the bearish side, weakness is likely to increase if the index fails to hold 57,450 and sustains below this level. In that case, Bank Nifty can move toward 57,250, 57,150 and the key support around 57,050. A decisive breakdown below 56,950 would indicate further weakness, potentially opening the way toward 56,750, 56,650 and 56,550.
The 57,450–57,550 zone is therefore the key decision area for the session. A breakout above this range can favour an upside move, while rejection from this zone followed by a break below 57,450 can bring selling pressure. Until either side is decisively broken, traders may see continued consolidation and should avoid taking aggressive directional positions in the middle of the range. Maruti Bearish Setup### Maruti Analysis for Monday Trade
#### Current Market Data
- **Current Price**: ₹12,694.00 (down by 1.27% today)
*SOURCE: Yahoo Finance*
#### Open Interest & Price Change
- **Price Change**: -1.2%
- **Put Call Ratio (PCR)**: 0.41
- **Call OI Change**: +19.0%
- **Put OI Change**: +10.2%
- **Futures OI Change**: +5.4%
*SOURCE: Our Database (bhavcopy)*
#### Financial Metrics
- **P/E (Trailing)**: 27.86
- **P/E (Forward)**: 20.95
- **PEG Ratio**: 0.77
- **Revenue Growth**: +35.90%
- **52-Week Range**: ₹12,201.00 — ₹17,370.00
*SOURCE: Yahoo Finance*
#### Global Market Cues
- **Nifty 50**: 23,897.70 (+0.10%)
- **Bank Nifty**: 57,369.65 (-0.02%)
- **India VIX**: 10.68 (-6.11%)
- **S&P 500**: 7,718.60 (-0.38%)
- **Dow Jones**: 53,414.25 (-0.51%)
- **Nasdaq**: 26,506.99 (-0.29%)
- **Nikkei 225**: 65,020.94 (+1.17%)
*SOURCE: Internet (live)*
#### Analysis & Prediction for Monday
- **Directional Bias**: **Bearish**
- **Reasoning**: Significant call writing (+19.0% in Call OI) indicates bearish sentiment. The low PCR of 0.41 also supports a bearish outlook.
- **Global Cues**: Mixed signals with a slight negative bias from US markets, but positive cues from Asian markets.
- **Financials**: The stock is trading closer to its 52-week low, indicating potential support around ₹12,201.00.
#### Key Support & Resistance Levels
- **Support**: ₹12,201.00 (52-week low)
- **Resistance**: ₹13,000.00 (psychological level)
#### Trade Idea
- **Bearish Strategy**: Consider a **Bear Put Spread** to capitalize on the bearish sentiment.
- **Buy**: ATM Put Option (e.g., ₹12,700 Put)
- **Sell**: Lower Strike Put Option (e.g., ₹12,500 Put)
- **Rationale**: This strategy limits risk while allowing for profit if Maruti continues to decline.
#### Additional Considerations
- **Risk Management**: Adhere to your trading rules, especially the stop-loss and position sizing guidelines.
- **Technical Confirmation**: Ensure the setup aligns with your technical indicators, such as BB SuperTrend and moving averages, before entering the trade.
*SOURCE: Your Knowledge Base*
This analysis provides a comprehensive view of Maruti's current situation and offers a practical trade idea for Monday. Always ensure to cross-verify with live data and your own trading rules before executing any trade.  Short
Short
Silver Touch TechnologiesDate 05.09.2026
Silver Touch Technologies
Timeframe : Weekly Chart
Business segment mix
(a) Software Services (51%)
Custom apps, digital platforms, AI & cloud solutions, IT Staffing & Workforce Management
(b) E-Governance Services (20%)
Digital India & state portals, smart city and citizen services
(c) System Integration (15%)
LAN/WAN, IT infra & security solutions with global tech partners
(d) ERP Implementation Services (9%)
SAP, Odoo & Microsoft Dynamics for process automation
(e) Cloud & Facility Management Services (5%)
Cloud migration, data center & IT infrastructure support
Clientele
National Information Centre, RITES, RAILTEL, STPI, BSNL, Industrial Extension Bureau, Gujarat Informatics Limited, and others.
The company also provides IT services to major domestic private players in the banking, manufacturing, and trading sectors.
Order Book:
The company reports ₹650 crore revenue, with 60% from recurring orders and 40% from fresh orders, supported by long-term government/PSU contracts with 5+ year project duration.
Valuations
(1) Stock Pe 51
(2) Roce 30%
(3) Roe 24%
(4) Book Value 12X
(5) Sales Growth (ttm) 21%
(6) Profit Growth (ttm) 82%
(7) Cfo/Op 47%
(8) Opm 20%
(9) Peg 0.92
(10) Ev/Ebita 30
Note*
(1) 82% profit growth (ttm) is puerly organic, no exceptional items or other incomes
(2) Promoter holding 74%
(3) Debt free
(4) Daily avg traded volume, 4.23 lac shares
Regards,
Ankur SIngh
 Long
Long
 Long
Long
 Long
Long


