CADJPY | 15min Timeframe Analysis | Bullish Side Direction After long time trend continue to the bearish side. Then it's time to reversal of this trend. Now shall I waiting after the MSS (Market Structure Shift). After some confirmation to trend reversal to the major identity on first bottom need a lower low liquidity sweep then market bullish momentum gene
Canadian Dollar / Japanese Yen
No trades
No trades
Peers for comparison
Pair info
The Canadian Dollar vs. the Japanese Yen. When a trader is unsure about trading the US Dollar, the CADJPY is often determined to be a suitable replacement. However, the historically higher yield of the Canadian dollar in the past has made the CADJPY more sensitive to market wide sentiment changes than the USDJPY. Also, Canada’s large amount of energy exports, most notable oil, causes it to be affected by crude oil prices.
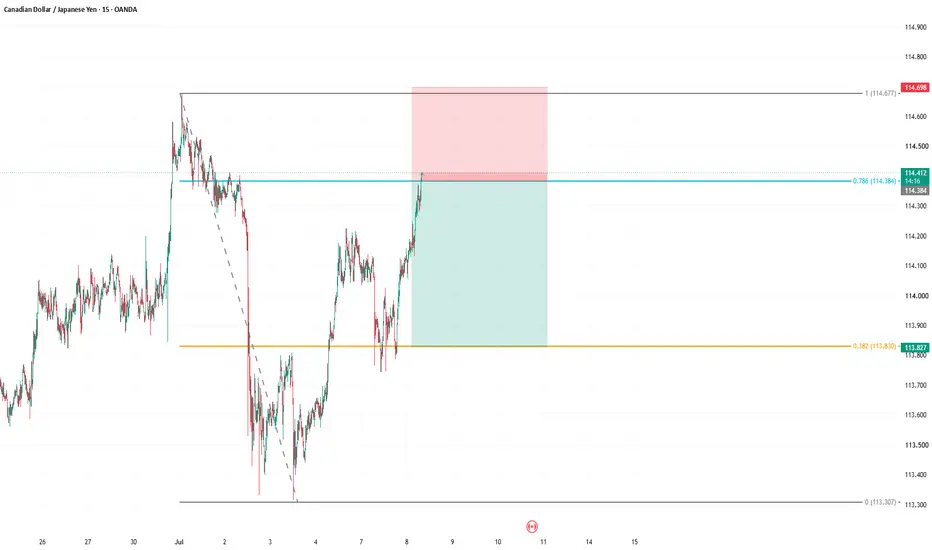
CADJPY | 15min Timeframe Analysis | Bearish Side DirectionLet's follow the bearish trend market. This resistance zone also important. Need a "M" / "Double Top" type structure. Then second top also need a bearish engulfing 2cp candlestick pattern. Then go with the bearish trend.
Important Area :-
1) Resistance Zone = 111.407 - 111.422
2) Need a "M" / "Doub
CADJPY Finds Strong Support – Buyers Step InCADJPY has taken quite a hit recently, but the interesting part is where the selling started to slow down. Price has reached an important support zone around 111.40–111.60, and we're finally seeing buyers step back in after that sharp decline.
Looking at the 2H chart, this area has already been tes
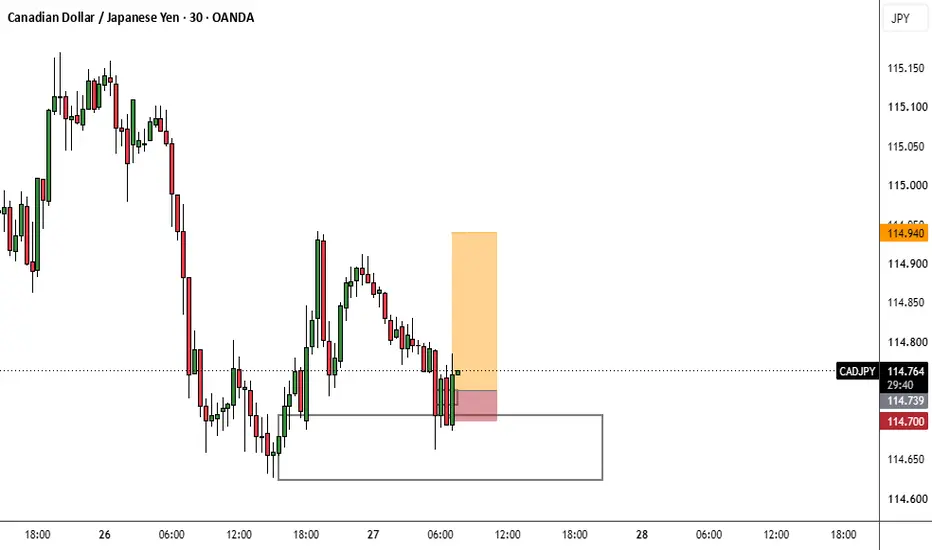
CADJPY | 30min Timeframe Analysis | Bullish Side DirectionAfter Long time trend continue to the bearish side, Then it's time to reversal of this trend. Now shall I waiting after the MSS (Market Structure Shift) . After some confirmation to trend reversal to the major identification on first need a lower low liquidity sweep then market bullish momentum gene
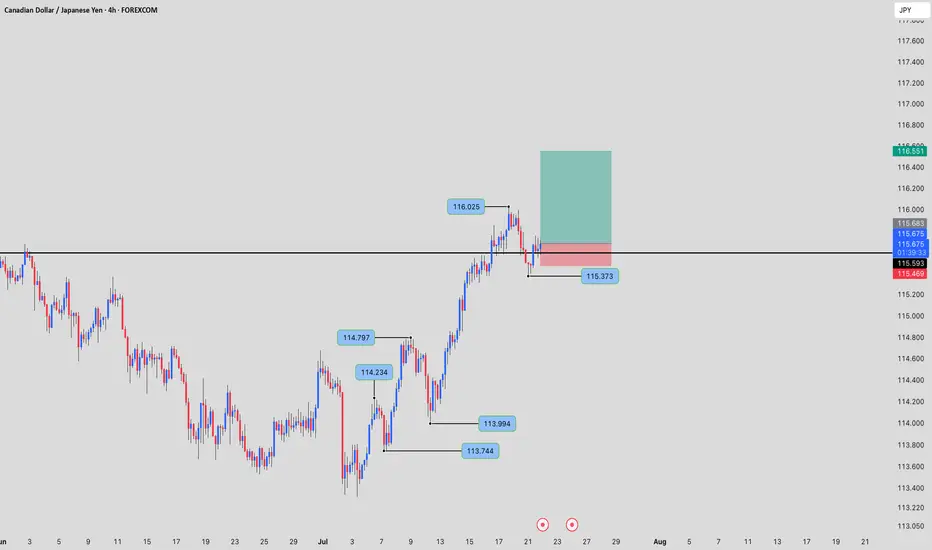
CAD/JPY: The Big Reversal PlayMomentum is shifting — CAD/JPY has snapped out of its bearish grip and is climbing inside a sharp green channel. With price teasing the 111.200 mark, traders are staring at a setup that screams opportunity: a tight red stop zone guarding the downside, and a massive green profit window stretching tow
CADJPY TRADEEHere i have applied MS, LQ, and PROPER RISKMANEGEMENT, SO IM HOPING YOU APPLY YOUR OWN RISKMANAGEMNT HERE, it's a 1:5 rr trade, and my stategy have 40-50% win ratio, here also im targeting the liquidity above and waiting for the OB to hit, and in daily timeframe if you see, it has moved down alot, s
Adding CADJPY And EURUSD in my watchlist Hello traders , here is the full multi time frame analysis for this pair, let me know in the comment section below if you have any questions , the entry will be taken only if all rules of the strategies will be satisfied. wait for more price action to develop before taking any position. I suggest yo
See all ideas
Summarizing what the indicators are suggesting.
Oscillators
Neutral
Oscillators
Neutral
Summary
Neutral
Summary
Neutral
Summary
Neutral
Moving Averages
Neutral
Moving Averages
Neutral
Displays a symbol's price movements over previous years to identify recurring trends.
Frequently asked questions
Today, CAD/JPY rate is 110.556 JPY.
For broader market analysis, dive into the technicals on the CADJPY live chart and read the latest CADJPY news:
– investingLive Asia-pacific FX news wrap 19 Aug: Like watching paint dry
– Important implied volatility levels for USDCAD, EURCAD, GBPCAD and CADJPY
– JP Morgan favour short CAD, long JPY
For broader market analysis, dive into the technicals on the CADJPY live chart and read the latest CADJPY news:
– investingLive Asia-pacific FX news wrap 19 Aug: Like watching paint dry
– Important implied volatility levels for USDCAD, EURCAD, GBPCAD and CADJPY
– JP Morgan favour short CAD, long JPY
Markets don't sleep, here's what's going on with CADJPY at the moment:
– investingLive Asia-pacific FX news wrap 19 Aug: Like watching paint dry
– Important implied volatility levels for USDCAD, EURCAD, GBPCAD and CADJPY
– JP Morgan favour short CAD, long JPY
See more updates in real-time with our News Flow.
– investingLive Asia-pacific FX news wrap 19 Aug: Like watching paint dry
– Important implied volatility levels for USDCAD, EURCAD, GBPCAD and CADJPY
– JP Morgan favour short CAD, long JPY
See more updates in real-time with our News Flow.
The safest way to trade CADJPY is through a reliable broker. Create an account, fund it, and place a buy order.
You can trade CADJPY directly from TradingView:
– Choose a broker: Explore our supported trading partners and pick one that fits your needs
– Compare options: View available brokers side by side to evaluate fees and features
– Connect your account: Open Supercharts, click "Trade", select your broker, and log in
– Start trading: Place orders without leaving the chart
Tip: If you're new to trading, try paper trading first — it lets you practice strategies in real market conditions without risking funds.
You can trade CADJPY directly from TradingView:
– Choose a broker: Explore our supported trading partners and pick one that fits your needs
– Compare options: View available brokers side by side to evaluate fees and features
– Connect your account: Open Supercharts, click "Trade", select your broker, and log in
– Start trading: Place orders without leaving the chart
Tip: If you're new to trading, try paper trading first — it lets you practice strategies in real market conditions without risking funds.
It's worth checking CADJPY rate change for various periods to get the full picture:
– 1 day — −0.74%
– 1 week — −1.41%
– 1 month — −1.79%
CADJPY's all-time low was 68.400 JPY (Jan 21, 2009), and its highest price is 125.577 JPY (Nov 7, 2007). Track the dynamics with the latest forex news right on TradingView.
– 1 day — −0.74%
– 1 week — −1.41%
– 1 month — −1.79%
CADJPY's all-time low was 68.400 JPY (Jan 21, 2009), and its highest price is 125.577 JPY (Nov 7, 2007). Track the dynamics with the latest forex news right on TradingView.
When trading CADJPY, one should keep in mind many factors.
First, analyze the fundamentals:
– Macroeconomic data: Inflation, GDP, employment, and other key indicators in the economies behind both currencies
– Central bank policy: Interest rate decisions and monetary policy from the respective central banks
– Market sentiment: Check what other traders anticipate
– News flow: Geopolitical events and economic releases
Then check technical ratings:
– Today — strong sell
– 1-week — sell
– 1-month — neutral
Identify the trend, watch key levels (support and resistance), consider volatility and upcoming economic events. Then, you'll be closer to an informed decision.
First, analyze the fundamentals:
– Macroeconomic data: Inflation, GDP, employment, and other key indicators in the economies behind both currencies
– Central bank policy: Interest rate decisions and monetary policy from the respective central banks
– Market sentiment: Check what other traders anticipate
– News flow: Geopolitical events and economic releases
Then check technical ratings:
– Today — strong sell
– 1-week — sell
– 1-month — neutral
Identify the trend, watch key levels (support and resistance), consider volatility and upcoming economic events. Then, you'll be closer to an informed decision.
CADJPY is a minor currency pair (also known as a cross pair), meaning it includes two major currencies but doesn't involve the US dollar.
What it means for traders:
– No USD exposure: Reflects the relative strength of two non-USD economies
– Lower liquidity than major pairs: Generally traded less than major currency pairs, but still widely available
– Potentially wider spreads: Trading costs may be higher than for major pairs
What to keep in mind about cross pairs:
– Region-focused moves: Often influenced by economic data and monetary policy in the two regions involved
– Direct currency comparison: Useful for comparing currencies without the influence of the US dollar
– Different volatility profile: May behave differently from major pairs, especially during regional events
Track rate movements on the CADJPY chart and follow the latest forex news to stay informed.
What it means for traders:
– No USD exposure: Reflects the relative strength of two non-USD economies
– Lower liquidity than major pairs: Generally traded less than major currency pairs, but still widely available
– Potentially wider spreads: Trading costs may be higher than for major pairs
What to keep in mind about cross pairs:
– Region-focused moves: Often influenced by economic data and monetary policy in the two regions involved
– Direct currency comparison: Useful for comparing currencies without the influence of the US dollar
– Different volatility profile: May behave differently from major pairs, especially during regional events
Track rate movements on the CADJPY chart and follow the latest forex news to stay informed.
CADJPY volatility measures how much the exchange rate fluctuates over time, i.e. how quickly and how strongly it moves up or down.
The current volatility rating is 0.91%.
What it means for traders:
– Higher volatility: Larger and faster price swings → higher risk and opportunity
– Lower volatility: More stable price movement → smaller trading ranges
– Market behavior: Volatility often increases during major economic news or central bank decisions
Volatility helps traders estimate risk and position sizing. It's also useful for adapting strategies to market conditions.
How to use volatility:
– Compare volatility across other currency pairs
– Combine with technical analysis (trends, support/resistance)
– Monitor economic events that may increase market movement
The current volatility rating is 0.91%.
What it means for traders:
– Higher volatility: Larger and faster price swings → higher risk and opportunity
– Lower volatility: More stable price movement → smaller trading ranges
– Market behavior: Volatility often increases during major economic news or central bank decisions
Volatility helps traders estimate risk and position sizing. It's also useful for adapting strategies to market conditions.
How to use volatility:
– Compare volatility across other currency pairs
– Combine with technical analysis (trends, support/resistance)
– Monitor economic events that may increase market movement
CADJPY is quoted as how many JPY (quote currency) it takes to buy one CAD (base currency).
For example, if the pair trades at 1.50, it means 1 CAD = 1.50 JPY.
What can influence the rate:
– Supply and demand: Driven by trade, investment flows, and speculation
– Economic data: Inflation, GDP, employment reports
– Central bank policy: Interest rates and monetary decisions
Follow these and more events in the Economic Calendar.
For example, if the pair trades at 1.50, it means 1 CAD = 1.50 JPY.
What can influence the rate:
– Supply and demand: Driven by trade, investment flows, and speculation
– Economic data: Inflation, GDP, employment reports
– Central bank policy: Interest rates and monetary decisions
Follow these and more events in the Economic Calendar.