Institution Option Trading Part-1PCR means Put Call Ratio
It tells us how many Put options and Call options people are buying or trading.
Why it matters for institution trading
Big players mostly use options. So PCR helps us understand what big money may be thinking.
If PCR is high
More puts than calls.
Means traders are scared or taking protection.
Sometimes big players expect weakness.
If PCR is low
More calls than puts.
Means confidence in upside.
Sometimes market is bullish.
In-depth trading ideas
GOLD COMEX – TECHNICAL VIEW📊 GOLD COMEX – TECHNICAL VIEW
GOLD COMEX has given a breakout from a Falling Wedge pattern on the Daily Chart. Following the breakout near $4,100, Gold witnessed a strong rally of nearly $300.
After this sharp upmove, the price has consolidated over the last two trading sessions. We expect this consolidation to be followed by a resumption of the upward rally.
🔹 FIBONACCI ANALYSIS
Applying Fibonacci retracement from the recent high of $5,626.80 to the low of $3,955.40, we identify the 0.236 Fibonacci level at approximately $4,349.50 as a key support zone.
As long as Gold COMEX Futures sustain above the $4,320 level, the broader bullish structure remains intact and the uptrend is expected to resume.
📌 TRADING STRATEGY
BUY GOLD COMEX FUTURES
Around: $4,350
Stop Loss: $4,320
The $4,320 level will be crucial. Sustaining above this level can trigger the next leg of the upward rally.
⚠️ Trading involves market risk. Please trade with appropriate position sizing and risk management.
Intraday AnalysisOption Chain Analysis: Decoding Open Interest (OI) to find where the "Big Players" are positioned.
FII/DII Data: Understanding institutional activity and its impact on market direction.
Intraday Strategies: Scalping and swing setups using Price Action and key EMAs.
Global Market Cues: How GIFT Nifty and US Markets might influence our opening.
Institution Option Trading Part-1PCR means Put Call Ratio
It tells us how many Put options and Call options people are buying or trading.
Why it matters for institution trading
Big players mostly use options. So PCR helps us understand what big money may be thinking.
If PCR is high
More puts than calls.
Means traders are scared or taking protection.
Sometimes big players expect weakness.
If PCR is low
More calls than puts.
Means confidence in upside.
Sometimes market is bullish.
Technical AnalysisCore of Technical Analysis
Technical Analysis is the study of past price movements, volume, and market trends to predict future price direction.
3 Main Principles:
Market Discounts Everything
All news, emotions, and fundamentals are already reflected in price.
Prices Move in Trends
Markets usually move in uptrend, downtrend, or sideways trends.
History Repeats Itself
Human psychology creates repeating chart patterns.
Key Tools:
Charts (Candlestick, Line, Bar)
Support & Resistance
Trendlines
Indicators (RSI, MACD, Moving Averages)
Volume Analysis
GOLD | Big Decision Zone — 4,150 Breakout or 3,900 Breakdown?Gold Futures — Daily Chart Study
COMEX: Gold Futures
Gold is currently trading near an important decision zone. Price is trying to hold the major support area, while the falling trendline resistance is still creating pressure on the upside.
The key support zone to watch is 3,900–3,960. As long as Gold holds this area, the structure is not fully broken and a recovery attempt can remain active.
Chart observations:
Gold is holding near an important support zone.
Falling trendline resistance is still visible on the daily chart.
3,900–3,960 is the major support belt.
4,120–4,150 is the key breakout confirmation zone.
A sustained move above 4,150 can shift the structure toward bullish recovery.
On the upside, if Gold manages to cross and sustain above 4,120–4,150, the bearish pressure can reduce. In that case, the next important zones to track are 4,300–4,350, followed by 4,600, and then 4,800–5,000 as broader resistance/reference zones.
On the downside, if Gold breaks below 3,900, the current support structure may weaken. Below this level, the next downside zones are 3,750–3,600. A move toward 3,500–3,300 looks like a rare panic scenario only if global sentiment turns sharply negative.
Key levels:
Support zone: 3,900–3,960
Breakdown risk below: 3,900
Downside zones: 3,750–3,600 / 3,500–3,300
Breakout confirmation zone: 4,120–4,150
Upside resistance zones: 4,300–4,350 / 4,600 / 4,800–5,000
For now, Gold is in a breakout-or-breakdown decision zone. A sustained move above 4,150 can strengthen the bullish recovery structure, while a breakdown below 3,900 can increase downside risk.
Shared only for educational study and chart-tracking purpose. This is not a buy/sell recommendation, trading advice, or investment advice. I am not a registered financial advisor. Please do your own research or consult a qualified financial advisor before taking any market decision. I am not responsible for any profit or loss based on this post.
#GOLD #GoldFutures #COMEX #GoldAnalysis #CommodityMarket #DailyChart #BreakoutWatch #SupportAndResistance #TechnicalAnalysis #TradingView
Oversold MarketsOption Chain Analysis: Decoding Open Interest (OI) to find where the "Big Players" are positioned.
FII/DII Data: Understanding institutional activity and its impact on market direction.
Intraday Strategies: Scalping and swing setups using Price Action and key EMAs.
Global Market Cues: How GIFT Nifty and US Markets might influence our opening.
XAUUSD BUY Setup| SMC + LuxAlgo + Liquidity Analysis
Welcome back traders! 👋
In today's XAUUSD (Gold) analysis, we're looking at a high-probability BUY setup using Smart Money Concepts (SMC), LuxAlgo, and Price Action. Gold has shown strong bullish momentum after breaking market structure, and price is currently reacting around a key liquidity zone.
The chart suggests that institutions may be accumulating positions before another expansion to the upside. If buyers maintain control, we could see a continuation toward the next premium liquidity area.
📊 Chart Breakdown
✅ Bullish Market Structure (BOS & CHoCH Confirmation)
✅ Price holding above the 9 SMA
✅ Strong demand zone acting as support
✅ Weak High liquidity identified above current price
✅ Institutional order flow remains bullish
✅ LuxAlgo Smart Money Concepts confirming trend strength
🎯 Trade Plan
📍 Entry Zone: Around 4154 - 4157
🛑 Stop Loss: Below the recent demand/support zone
🎯 Target 1 (A): Initial resistance area
🎯 Target 2 (B): Retest after liquidity sweep (possible pullback)
🎯 Final Target (C): Major premium liquidity zone around 4190+
Scenario Explained:
Price may first break above resistance (A), then perform a healthy pullback (B) to collect liquidity before continuing toward the final bullish target (C). This is a common institutional trading pattern observed in Smart Money Concepts.
📚 Indicators Used
LuxAlgo Smart Money Concepts
SMA (9)
Market Structure (BOS & CHoCH)
Liquidity Zones
Premium & Discount Zones
Supply & Demand
Price Action Analysis
⚠️ Risk Management
✔️ Always wait for candle confirmation before entering.
✔️ Never risk more than 1–2% of your trading capital on a single trade.
✔️ Use proper stop loss and avoid emotional trading.
✔️ Every setup has a probability—not a guarantee.
📢 Disclaimer
This video is created only for educational and informational purposes. The analysis shared here reflects personal market observations and should not be considered financial or investment advice. Always perform your own research before taking any trade. Trading Forex, Gold, and CFDs involves substantial risk and may not be suitable for every investor.trade when create any BOS.
Institutional Trading MasterclassCore Structure of Institutional Option Trading
Institutions focus on 4 pillars:
A. Direction
Will market go up, down, sideways?
B. Volatility
Will movement increase or decrease?
C. Time Decay
How much premium melts daily?
D. Risk Exposure
How much capital at risk?
Rules to Become Consistent
Never trade without plan
Never increase size emotionally
Smart Money Concepts (SMC) + LuxAlgo Analysis | Gold Short Trade📈 Description
Gold (XAUUSD) is showing a high-probability SELL setup based on Smart Money Concepts (SMC) and LuxAlgo analysis.
In this chart:
✅ Weak High liquidity identified
✅ Premium Supply Zone respected
✅ Bearish market structure
✅ High Risk : Reward setup
✅ Targeting lower demand/liquidity zone
✅ SMA (9) used for trend confirmation
✅ LuxAlgo SMC concepts for institutional analysis
Trade Details:
📍 Entry: 4134.5
🛑 Stop Loss: 4160.2
🎯 Target: 4052.2
⚠️ Risk Management is essential. Wait for confirmation before entering any trade.
This analysis is for educational purposes only and is not financial advice.
Oversold MarketsWhat is overbought?
When the market goes up too much, too fast — like it got overexcited. RSI crosses above 70. This means most people who wanted to buy have already bought. Not many buyers left. So the market will likely slow down or fall a bit.
What you do: don't buy now. If you're already in profit, book some of it. Keep your stop loss tight.
What is oversold?
When the market falls too much, too fast — like everyone panicked and sold everything. RSI drops below 30. Most of the panic selling is already done. So a bounce or recovery is likely coming.
What you do: don't rush in all at once. Wait for one green candle or a volume pickup as confirmation. Then buy in small parts.
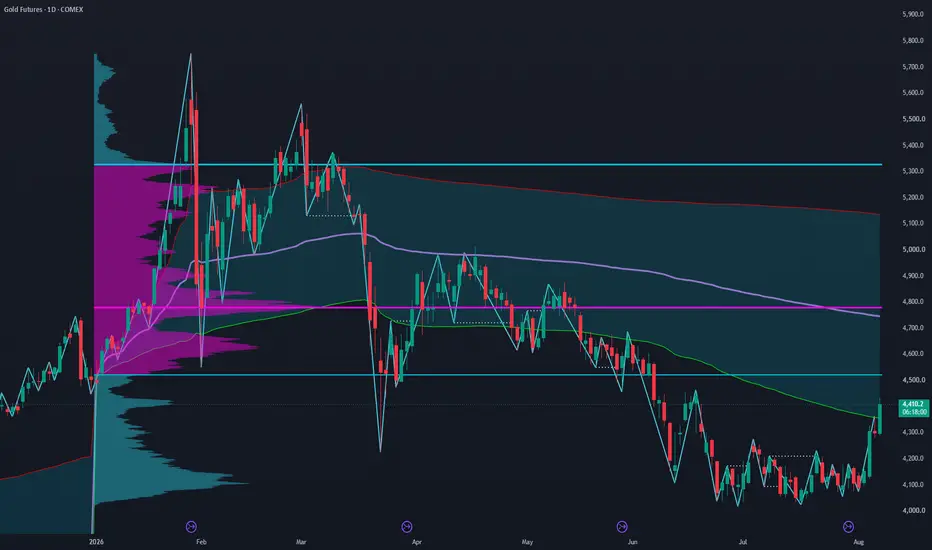
Gold Futures (GC): Daily Structure Suggests a Bottom Is In
Gold futures have spent the last several weeks carving out what looks like a genuine change of character on the daily chart, and price action over the last few sessions has confirmed it. Here's the structural read and what I'm watching next.
Market structure shift
Since the swing high in the 5,300–5,600 area earlier this year, GC has been in a clean sequence of lower highs and lower lows, with the decline accelerating into the 4,000–4,100 zone in July. That's where the character started to change.
The key event was a displacement through the last major lower high. Instead of the usual grinding rally that gets sold back into the range, price broke above the prior swing high with real momentum - the kind of move that shows aggressive buyers stepping in rather than short-covering drift. That displacement is what flips the daily structure from bearish to constructively bullish.
Just as important: the low that formed alongside that shift has now been protected for roughly 33 trading days. Every pullback since has held above it, which tells me sellers haven't been able to reclaim control even after the initial breakout momentum faded. A single higher low isn't proof of anything on its own, but one that survives multiple retests over a month starts to look like actual support, not a random print.
Put together: a displaced lower high plus a protected low - this is a textbook bullish market structure shift on the daily timeframe.
Where price is now:
GC has pushed back up into the first standard deviation band of the anchored VWAP, which is typically the first real resistance test after a structure shift like this. How price behaves here matters: a clean acceptance above the band supports continuation, while repeated rejection would be the first sign the move needs more time to consolidate before it can extend.
Targets: VWAP and yearly POC:
With the low now protected and structure bullish, the next two logical draws on liquidity are:
1. Anchored VWAP: the mean-reversion magnet price has been trading below since the decline began
2. Yearly volume profile POC (Point of Control): the price level with the heaviest traded volume over the past year, sitting well above current price and acting as a natural high-volume node for price to gravitate toward
Both levels represent areas where a large amount of prior business was transacted, which is exactly the kind of level a structurally bullish market tends to seek out once it starts trending.
The obstacle in between:
Before either target comes into play, price has to deal with the volume profile Value Area Low (VAL). This is the lower boundary of where 70% of volume traded over the reference period, and it often acts as short-term resistance on the first test - it's essentially the "floor of business" from the prior range, now being tested from below.
My expectation is that this level gets tested and ultimately breached, rather than holding as a hard ceiling. As long as the higher-low structure remains intact on any pullback into or through this zone, the broader bullish read stays valid. A breach of VAL followed by continued higher lows would be a strong confirmation signal on the way toward VWAP and the yearly POC.
What would invalidate this idea
Structure-based ideas live and die by the structure itself. If price closes back below the protected low that's held for the last 33 days, the bullish shift is broken and the picture reverts to "still building a base" rather than "trending higher." Watching how price handles VAL and the VWAP first SD band in the meantime will give the earliest clues either way.
This is a technical/structural analysis for educational discussion, not financial advice. Futures trading involves substantial risk of loss and is not suitable for all investors. Always do your own research and manage risk according to your own plan.
XAUUSD / Gold Futures BUY Setup | Smart Money Concepts (SMC) Welcome to today's XAUUSD (Gold Futures / COMEX) BUY analysis, where we break down a high-probability bullish setup using Smart Money Concepts (SMC), LuxAlgo Smart Money Concepts, LuxAlgo Sessions, and advanced Price Action techniques.
After sweeping liquidity and respecting a key institutional demand zone, Gold is showing signs of continuing its bullish market structure. The chart highlights multiple Breaks of Structure (BOS), liquidity grabs, and premium/discount zones that indicate buyers may remain in control if confirmation is received.
📊 What You'll Learn in This Video
✅ XAUUSD BUY Setup Explained
✅ Smart Money Concepts (SMC) Analysis
✅ LuxAlgo Smart Money Concepts Indicator Analysis
✅ LuxAlgo Sessions (London, New York, Tokyo & Sydney) Breakdown
✅ Break of Structure (BOS) Confirmation
✅ Change of Character (ChoCH) Analysis
✅ Liquidity Sweep & Liquidity Grab Concepts
✅ Institutional Demand Zone Identification
✅ Risk-to-Reward Trade Planning
✅ Gold Futures (COMEX) Technical Analysis
📈 Trade Plan
Bias: BUY 🟢
Bullish market structure remains intact.
Price is expected to retrace into the highlighted demand/FVG area before continuation.
Buyers may step in around the institutional demand zone.
Confirmation through bullish price action or BOS on lower timeframes can improve the setup.
Upside targets include previous session highs and external liquidity.
⚠️ Always wait for confirmation before entering any trade. Never risk more than you can afford to lose.
🛠️ Indicators Used
TradingView
LuxAlgo Smart Money Concepts Indicator
LuxAlgo Sessions Indicator
Price Action
Institutional Market Structure
Supply & Demand
Fair Value Gap (FVG)
Liquidity Concepts
⚠️ Disclaimer
This analysis is shared for educational purposes only and does not constitute financial advice. Trading Forex, Gold, and Futures involves significant risk. Always perform your own analysis and use proper risk management before taking any trade.Welcome to today's XAUUSD (Gold Futures / COMEX) BUY analysis, where we break down a high-probability bullish setup using Smart Money Concepts (SMC), LuxAlgo Smart Money Concepts, LuxAlgo Sessions, and advanced Price Action techniques.
After sweeping liquidity and respecting a key institutional demand zone, Gold is showing signs of continuing its bullish market structure. The chart highlights multiple Breaks of Structure (BOS), liquidity grabs, and premium/discount zones that indicate buyers may remain in control if confirmation is received.
📊 What You'll Learn in This Video
✅ XAUUSD BUY Setup Explained
✅ Smart Money Concepts (SMC) Analysis
✅ LuxAlgo Smart Money Concepts Indicator Analysis
✅ LuxAlgo Sessions (London, New York, Tokyo & Sydney) Breakdown
✅ Break of Structure (BOS) Confirmation
✅ Change of Character (ChoCH) Analysis
✅ Liquidity Sweep & Liquidity Grab Concepts
✅ Institutional Demand Zone Identification
✅ Risk-to-Reward Trade Planning
✅ Gold Futures (COMEX) Technical Analysis
📈 Trade Plan
Bias: BUY 🟢
Bullish market structure remains intact.
Price is expected to retrace into the highlighted demand/FVG area before continuation.
Buyers may step in around the institutional demand zone.
Confirmation through bullish price action or BOS on lower timeframes can improve the setup.
Upside targets include previous session highs and external liquidity.
⚠️ Always wait for confirmation before entering any trade. Never risk more than you can afford to lose.
🛠️ Indicators Used
TradingView
LuxAlgo Smart Money Concepts Indicator
LuxAlgo Sessions Indicator
Price Action
Institutional Market Structure
Supply & Demand
Fair Value Gap (FVG)
Liquidity Concepts
⚠️ Disclaimer
This analysis is shared for educational purposes only and does not constitute financial advice. Trading Forex, Gold, and Futures involves significant risk. Always perform your own analysis and use proper risk management before taking any trade.
XAUUSD SELL SETUP | Smart Money Concepts (SMC) Analysis 📈 Description
In this video, we analyze a high-probability XAUUSD SELL setup using Smart Money Concepts (SMC), LuxAlgo Smart Money Concepts Indicator, and institutional price action.
Gold is currently trading near a major supply zone where sellers have previously entered the market. Price is approaching a key resistance area, making this a potential location for a bearish reaction. Instead of chasing the market, the focus is on waiting for confirmation before taking a short position.
The setup is based on market structure, liquidity, and risk management—not predictions.
🔍 Analysis Includes
✅ Smart Money Concepts (SMC)
✅ LuxAlgo Smart Money Concepts Indicator
✅ Supply Zone Analysis
✅ Liquidity & Equal Highs (EQH)
✅ Change of Character (CHoCH)
✅ Break of Structure (BOS)
✅ Institutional Price Action
✅ Risk-to-Reward Planning
✅ High Probability Gold Trade Setup
📊 Trade Plan
Direction: SELL 🔴
Entry Zone: 4160 – 4170 (Supply Zone)
Stop Loss: Above the supply zone / recent swing high
Target 1: 4100 Area
Target 2: 4085 Area
Target 3: Lower liquidity zones if bearish momentum continues
⚠️ Important: Wait for bearish confirmation such as rejection candles, CHoCH, or BOS before entering. Never enter a trade without confirmation.
📌 Indicators Used
LuxAlgo Smart Money Concepts
Market Structure (BOS & CHoCH)
Liquidity Zones
Supply & Demand
Institutional Price Action
Risk Management
⚠️ Disclaimer
This video is for educational purposes only and should not be considered financial advice. Trading Gold and Forex carries significant risk. Always perform your own analysis and use proper risk management before placing any trade.
GC1! Analysis | LOOKING FOR LONGGC1! Analysis:-
The higher timeframe structure still suggests that the primary bullish trend remains intact. The recent downside move appears to be a retracement within that larger trend.
On the lower timeframe, I'm watching for an Inverse Head & Shoulders pattern to develop. If the pattern completes with a valid breakout and confirmation, I'll look to plan a long trade in the direction of the higher timeframe trend.
If the Inverse Head & Shoulders doesn't form, I'll wait for another clear bullish trend reversal before considering any long entries.
Patience is key—I'll only take the trade if the market confirms the setup.
Bias: Bullish (Higher Timeframe)
Institution Option Trading Part-1PCR means Put Call Ratio
It tells us how many Put options and Call options people are buying or trading.
Why it matters for institution trading
Big players mostly use options. So PCR helps us understand what big money may be thinking.
If PCR is high
More puts than calls.
Means traders are scared or taking protection.
Sometimes big players expect weakness.
If PCR is low
More calls than puts.
Means confidence in upside.
Sometimes market is bullish.
Advanced Intraday TradingOptions Trading is a type of financial trading where investors buy or sell contracts that give them the right, but not the obligation, to purchase or sell an asset at a fixed price before a specific date. Traders use options to earn profits, hedge risks, or speculate on market movements. Common strategies include call options, put options, straddles, and spreads. Options trading can provide high returns, but it also carries significant risk because prices can change rapidly due to market volatility.
Gold Update: Watching for a Potential Long OpportunityThe target on my previous Gold short trade has been achieved.
Now, I'm looking for a possible long setup, as I believe the 1-hour (higher timeframe) trend has shifted to bullish.
The earlier short trade was simply a retracement move within this larger bullish structure.
My current approach:
I have marked a key level (line) and an arrow on the chart.
My first condition is to see a strong candle close above that marked level.
At the same time, the recent swing low should remain intact.
If these conditions are met, I'll look for a long opportunity, aligning my trade with the higher-timeframe trend.
This post is purely for educational purposes and is not financial advice.
If you'd like, I can create a detailed post explaining:
Why I took the previous short trade,
Why I'm now looking for longs,
How I use higher-timeframe structure and confirmation for my entries.
Let me know in the comments if you'd like a detailed breakdown. 👇
GC | Head & Shoulders | ShortThe Head & Shoulders pattern takes time to develop, but that's what makes it a strong trend reversal pattern.
It typically begins with a sequence of:
Higher High → Higher Low → Higher High
As the trend weakens, the market shifts to:
Lower Low → Lower High
If this structure continues with Lower Lows and Lower Highs, it confirms that the trend has likely changed from bullish to bearish.
I recently identified this pattern on the Gold (GC) chart. Although the recognition came a bit late, it still offers valuable insight into understanding market structure and trend transitions.
I've marked two levels on the chart:
- Entry
- Stop Loss
This post is shared for educational purposes only. Please do your own analysis and trade responsibly according to your own strategy and risk management.