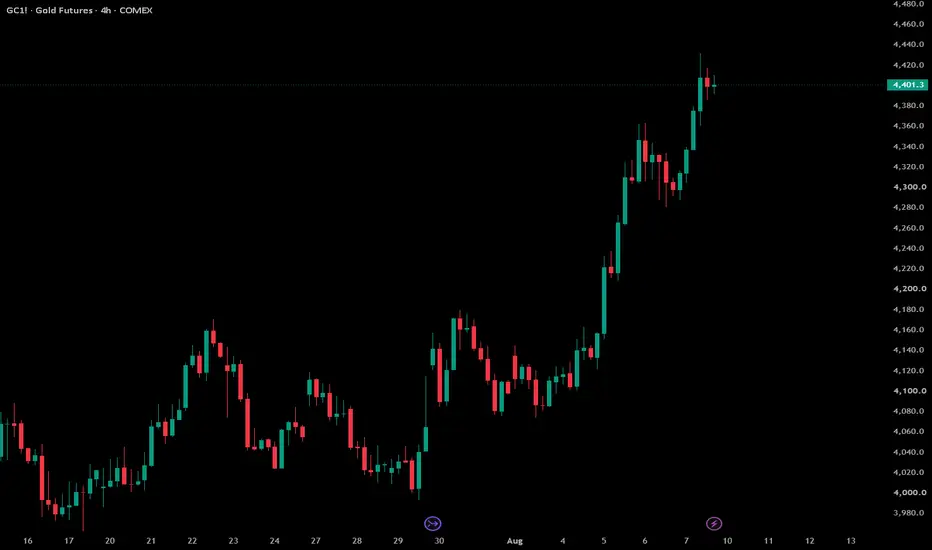
GOLD: A Superposition at $4,400 — Which State Collapses First?My own system is printing Sell on the weekly right now. On the monthly, the same
system prints Strong Buy with a first target near 5,195. Same indicator, same
data, opposite conclusions.
My indicators are private, so the chart here is clean price action and I am
quoting their readings instead of showing them. Every number below is a reading,
not a promise.
I am not going to hide one to make the other look smarter. Both states are alive
until something is measured.
ONE RULE ABOVE EVERYTHING: THE MARKET IS ALWAYS RIGHT
The market is not an opinion I get to argue with. It is the measurement. When
price closes, that is the observation, and the observation is never wrong. Only
my model can be wrong. Every rule below exists to make my model cheap to update
and expensive to defend.
WHAT 10,000 TICKS ACTUALLY MEANS
I say this on stream constantly: anything under 10,000 ticks is scalping.
That is not a price target. It is a unit of measurement. On COMEX GC one tick is
$0.10 per ounce, so 10,000 ticks is about $1,000 per ounce of travel. Below that
distance I am not looking at a trend - I am looking at noise with good lighting.
Above it, structure has to exist, because price cannot travel that far without
leaving evidence of who was buying and where.
So when I say gold has a 10,000-tick move in it, I am not promising a number. I
am naming the class of move I am measuring. Anything smaller does not qualify for
the thesis. Part of that distance has already printed, which does not make the
rest certain - it makes the rest a fresh decision.
NON-COMMUTING OBSERVABLES: WHY MY OWN TIMEFRAMES DISAGREE
In physics, measuring position precisely destroys precision in momentum. They
cannot both be sharp at once. Charts behave the same way, and today my own panel
demonstrates it better than any explanation I could write:
Monthly: Buy, strong reading, first target near 5,195, reward-to-risk about 1.5.
Weekly: Sell, first target below current price.
Daily: Buy - but reward-to-risk about 0.4.
Look at that daily line again, because it is the whole lesson. The direction is
right and the trade is still garbage. A 0.4 reward-to-risk means I am putting up
more than twice what I stand to make. Correct and unprofitable are not opposites.
That is what a shorter measurement window costs you. It sharpens timing and
destroys the distance you need for the payoff to exist. The longer window has the
payoff and cannot tell you when. Monthly up, weekly down, daily up is not a
contradiction. It is three measurement bases returning three valid answers.
The monthly carries the thesis. The weekly decides the entry. The daily is noise
until the weekly close agrees. A long-term view is allowed to sit through a
weekly pullback. What it is not allowed to do is rewrite its story afterwards and
pretend it always said that.
SUPERPOSITION: ALL DIRECTIONS STAY OPEN UNTIL SOMETHING IS MEASURED
Before the weekly close, gold is not going up or down in my model. It holds both,
with different weights. Almost every large loss I have watched, including my own,
came from collapsing that early - picking one branch because holding two felt
uncomfortable, then spending weeks defending the pick.
So I hold the distribution, not the conclusion, and I let the close do the
collapsing. My discomfort is not information.
ENTANGLEMENT: NEVER READ GOLD ALONE
Gold, silver, copper, platinum, palladium - I read the whole metals complex.
Correlated systems share information, so measuring one tells me something about
the others. When the complex moves together, the move has a body behind it. When
gold runs while silver and copper refuse, the correlation has broken, and that is
the earliest warning available. It arrives before any indicator says a word.
I read gold across five independent axes: price structure, macro, correlation,
news flow, and technicals. On the macro side for metal it is the dollar, long-end
yields, crude, and volatility. If I could keep one macro input and throw the rest
away, I would keep rates - metal is priced against the cost of holding money.
Here is the part most people will not like. My engine refuses to give a
directional call unless enough of those axes are fresh and agreeing. If several
inputs go stale, it returns neutral on purpose. It is built to be able to say "I
do not know."
A system that always has an opinion is not confident, it is lying to you. No
measurement means no collapse, and no collapse means no trade.
MEASUREMENT: WHAT ACTUALLY COUNTS AS AN OBSERVATION
Not a touch. A close.
I mark where price actually turned, repeatedly, and I never buy the first touch of
a level - a touch is a rumour. I wait for the reclaim close: price closing back
above the level is buyers proving they won, not hoping. Then at least 2:1 reward
to risk, or I pass. That single filter is why the daily setup above does not get
my money today.
I also do not trust a level only one source can see. A weekly level on the chart,
the same area in order-book depth from my domestic broker feed, and whether I
said it out loud on stream before it happened. Three independent looks. If two of
the three disagree, it is an opinion, not a level.
THE ANSWER TO THE QUESTION I GET MOST
Every stream, someone asks the same thing: when does it move?
My answer has not changed: it moves once you cut your loss.
That sounds harsh. It is mechanical. Price travels toward where positions have to
be closed, and the last cluster of stops sitting under an obvious level is fuel.
If you place your stop where everybody else placed theirs, you are not managing
risk - you are supplying it.
This is also the honest version of the quantum framing. You are not standing
outside the system observing it. You are part of what gets measured. Your
capitulation is one of the inputs. Size and stop placement are the only parts of
that you control.
THE STATE THAT ENDS THIS THESIS
A weekly close that loses the level the move launched from, or the metals complex
splitting apart while gold pushes alone. Either observation and the thesis is
gone - I stand down and re-mark. A thesis with no exit condition is not a thesis,
it is a wish.
Same long-term logic on my board: NQ 26,000 remains valid.
One honest note: this is a thinking framework, not a claim that quantum physics
moves price. I use it because it forces the two habits that actually pay - holding
several outcomes at once, and letting the measurement decide instead of me.
So here is what I want to hear, because I think it separates the people who last
from the people who do not: when your own system disagrees with your thesis,
which one do you obey - and what is your written rule for it? Put it in the
comments. I read all of them.
Educational content only. Not financial advice. Every entry, exit and outcome is
your own judgement, not mine. I publish the framework, never instructions.
In-depth trading ideas
GOLD: Bullish Going Into This Week. But Is It A Buy?In this Weekly Market Forecast, we will analyze Gold for the week of Aug 10-14th.
Gold enters the week with a bullish bias after a strong rally pushed prices near $4,400/oz, though the potential for high volatility looms.
As bullish as it may have ended last week, it closed in a potentially resistant area.
Enjoy!
May profits be upon you.
Leave any questions or comments in the comment section.
I appreciate any feedback from my viewers!
Like and/or subscribe if you want more accurate analysis.
Thank you so much!
Disclaimer:
I do not provide personal investment advice and I am not a qualified licensed investment advisor.
All information found here, including any ideas, opinions, views, predictions, forecasts, commentaries, suggestions, expressed or implied herein, are for informational, entertainment or educational purposes only and should not be construed as personal investment advice. While the information provided is believed to be accurate, it may include errors or inaccuracies.
I will not and cannot be held liable for any actions you take as a result of anything you read here.
Conduct your own due diligence, or consult a licensed financial advisor or broker before making any and all investment decisions. Any investments, trades, speculations, or decisions made on the basis of any information found on this channel, expressed or implied herein, are committed at your own risk, financial or otherwise.
Can the Precious Metals Maintain Momentum?Since the highs recorded in January of this year, the precious metals broadly have seen selling pressure after an almost extreme run to the upside. There was large central bank buying of Gold and Silver during the run higher and the momentum carried these markets to all time record highs. Looking at Gold since the top in January, prices have grinded lower similar to the rate of the rise, and prices have seemed to stabilize. The question is now lingering for the Gold market asking if the market will be able to see a rebound in the current Fed and interest rate environment or if prices are poised to move even lower.
Understanding the fibonacci retracements can help you see potential support and resistance levels where the market has traded in the past. Looking at a weekly Gold chart from the January highs to the breakout point from August of 2025, the price sold off to the 0.236 retracement point and found at least some support, and the prices have moved higher from there. Along with that, the 50-day exponential moving average had acted as a floor in this market going back to October of 2023, and now Gold is trading right at that level after closing below it a few days ago. This point is now acting as congestion, and traders will be watching this level this week with all of the economic data on jobs and inflation being released in the coming days.
If you have futures in your trading portfolio, you can check out on CME Group data plans available that suit your trading needs tradingview.com/cme/
*CME Group futures are not suitable for all investors and involve the risk of loss. Copyright © 2023 CME Group Inc.
**All examples in this report are hypothetical interpretations of situations and are used for explanation purposes only. The views in this report reflect solely those of the author and not necessarily those of CME Group or its affiliated institutions. This report and the information herein should not be considered investment advice or the results of actual market experience.
GOLD: A Superposition at $4,400 — Which State Collapses First?My own system is printing Sell on the weekly and Strong Buy on the monthly at the
same time. Same indicator, same data, opposite conclusions. Below are all three
timeframes exactly as my panel printed them, with what each one is actually saying.
Every probability stays open. I am not predicting. I am showing the frame I hold
and the condition that would end it.
ONE RULE ABOVE EVERYTHING: THE MARKET IS ALWAYS RIGHT
The market is not an opinion I get to argue with. It is the measurement. When
price closes, that is the observation, and the observation is never wrong. Only my
model can be wrong. Every rule below exists to make my model cheap to update and
expensive to defend.
Three things follow from that, and they are the only advice I would give anyone:
1. Write the invalidation before the entry. If you cannot name the exact close that
would prove you wrong, you do not have a thesis, you have a hope. Write it down
before you risk anything, because once the position is on, your memory becomes your
defence lawyer.
2. Never argue with a close - only with your own model. Losing money is expensive.
Defending a broken idea is far more expensive, because it also costs you the next
ten trades. When price disagrees with you, updating is the cheap option. Take it
early.
3. Size it so that being wrong is survivable and boring. A position that makes you
check the screen at three in the morning has already taken something the market
cannot pay back. If the stop hurts, the size is wrong, not the stop.
MONTHLY - THE THESIS LIVES HERE
Strong Buy, high conviction. First target 5,194.98, about 18 percent up, at roughly
1.5 reward to risk. Ceiling marked at 5,626.8, distance 27.89 percent.
This is the only timeframe allowed to hold the thesis. It is too slow to time an
entry and it does not pretend otherwise.
WEEKLY - THE ENTRY DECIDES HERE, AND IT SAYS NO
Sell, and the aggregate reading has gone slightly negative. First target sits below
the current price. Floor line 3,901.3, distance 11.33 percent.
Same system, one step down, opposite answer. This is not a contradiction and it is
not a refutation of the monthly. It is a timing statement. A long-term view is
allowed to sit through a weekly pullback. What it is not allowed to do is rewrite
its story afterwards and pretend it always said that.
DAILY - RIGHT DIRECTION, UNUSABLE TRADE
Strong Buy again. First target 4,492.3, only 2.1 percent away - and reward to risk
about 0.4.
Read that last number again, because it is the whole lesson. The direction is
correct and the trade is still garbage. A 0.4 reward to risk means risking more
than twice what I stand to make. Correct and profitable are not the same word.
WHY THE THREE DISAGREE - AND WHY THAT IS NORMAL
In physics, measuring position precisely destroys precision in momentum. They
cannot both be sharp at once. Charts behave the same way.
The more precisely I time an entry, the shorter the window I measure, and the less
that window can say about a trend. The more confident I want to be about the trend,
the longer the window, and the worse it is at timing. Monthly up, weekly down,
daily up is three measurement bases returning three valid answers.
The monthly carries the thesis. The weekly decides the entry. The daily is noise
until the weekly close agrees. Before that close, gold is not going up or down in
my model - it holds both, with different weights. Almost every large loss I have
watched, including my own, came from collapsing that early: picking one branch
because holding two felt uncomfortable, then spending weeks defending the pick.
WHAT 10,000 TICKS ACTUALLY MEANS
I will say it plainly: anything under 10,000 ticks is scalping.
That is not a price target, it is a unit of measurement. On COMEX GC one tick is
$0.10 per ounce, so 10,000 ticks is about $1,000 per ounce of travel. Below that
distance I am not looking at a trend, I am looking at noise with good lighting.
Above it, structure has to exist, because price cannot travel that far without
leaving evidence of who was buying and where.
NEVER READ GOLD ALONE
Gold, silver, copper, platinum, palladium - I read the whole metals complex.
Correlated systems share information, so measuring one tells me something about the
others. When the complex moves together, the move has a body behind it. When gold
runs while silver and copper refuse, the correlation has broken, and that is the
earliest warning available.
I also refuse to read price in isolation from the cost of money. If I could keep one
macro input and throw the rest away, I would keep rates - metal is priced against the
cost of holding money. That one relationship explains more gold behaviour than any
oscillator I have ever tested.
And my system is allowed to say nothing. When the inputs are not agreeing it returns
neutral on purpose, rather than manufacturing a call. A system that always has an
opinion is not confident, it is lying to you.
WHAT COUNTS AS AN OBSERVATION
Not a touch. A close. I mark where price actually turned, repeatedly, and I never
buy the first touch of a level - a touch is a rumour. I wait for the reclaim close:
price closing back above the level is buyers proving they won, not hoping. Then at
least 2:1 reward to risk, or I pass. That single filter is why the daily setup above
does not get my money today.
THE QUESTION THAT COMES UP MOST
When does it move? My answer has not changed: it moves once you cut your loss.
That sounds harsh. It is mechanical. Price travels toward where positions have to be
closed, and the last cluster of stops sitting under an obvious level is fuel. If you
place your stop where everybody else placed theirs, you are not managing risk, you
are supplying it. You are not standing outside the system observing it. You are part
of what gets measured.
THE STATE THAT ENDS THIS THESIS
A weekly close that loses the level the move launched from, or the metals complex
splitting apart while gold pushes alone. Either observation and the thesis is gone -
I stand down and re-mark. A thesis with no exit condition is not a thesis, it is a
wish.
One honest note on the framing. Superposition, measurement, entanglement - I use
these as a thinking tool, not as a claim that quantum physics moves price. I use
them because they force the two habits that actually pay: holding several outcomes
at once instead of one, and letting the measurement decide instead of me.
One honest note on the framing: this is a thinking tool, not a claim that quantum
physics moves price. I use it because it forces the two habits that pay - holding
several outcomes at once, and letting the measurement decide instead of me.
WHAT COMES NEXT
Gold is one instrument. The same three-timeframe reading works everywhere, and the
disagreements between the three are just as informative. Long term I am watching
Nasdaq toward 26,000 - I will not defend that number here, it needs its own chart
and its own invalidation level. Crypto, crude oil, currencies and a few others are
queued the same way. I will run them one instrument at a time, same structure:
monthly thesis, weekly entry, daily execution.
CLOSING NOTE
The indicators on these charts are my own private scripts and they stay private, but
nothing about the reading is hidden - the method above IS the method.
Every level named above is falsifiable on a close, which is the only standard I think
analysis should be held to. If the close does not arrive, the thesis does not exist.
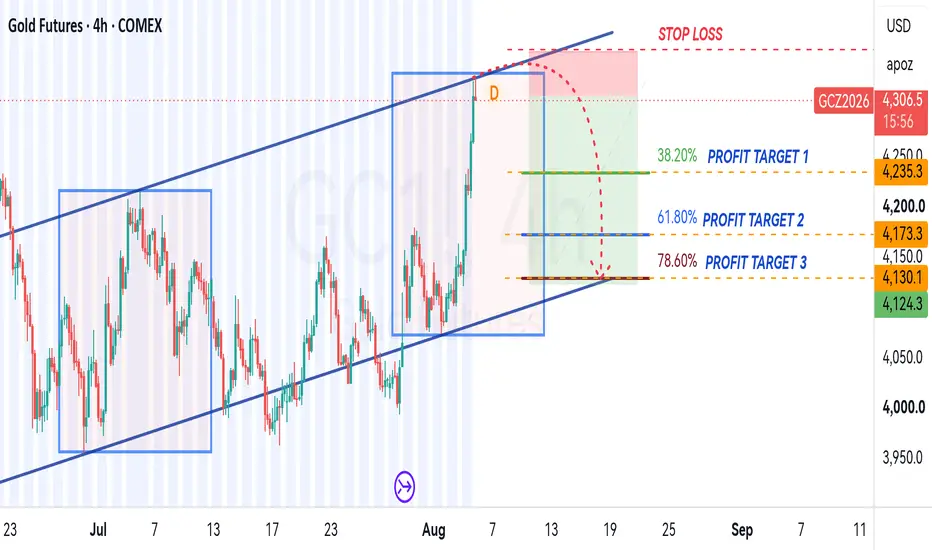
SELL GOLDToday's bullish move was monumental, we now expect a major drop of price since price action reached a strong supply zone,.. the current high is also a Potential Reverse Zone of a Harmonic Bearish Crab on the daily TF which is good confluence, we anticipate distribution to the downside....As always emphasized,..manage risk to protect equity..
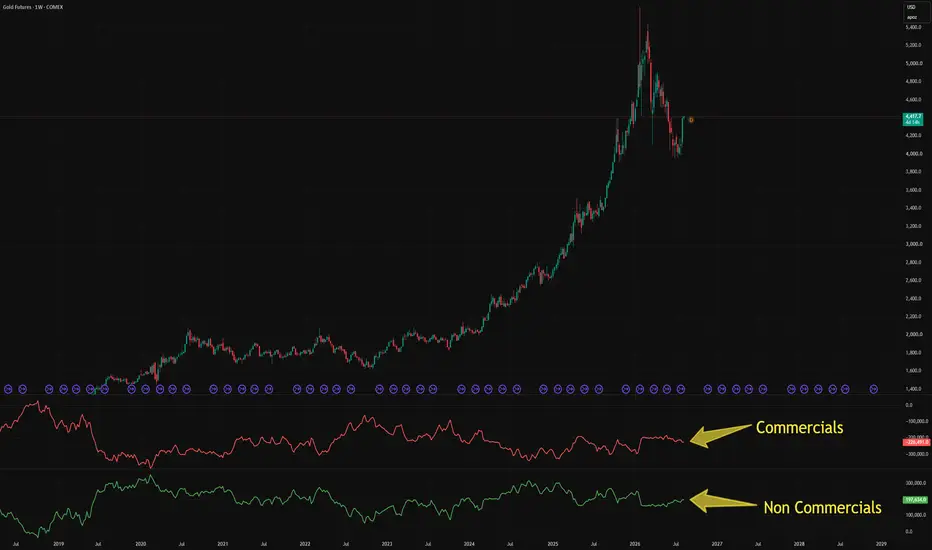
COT 101 · Lesson 01 — How to Read the COT Report🔵 THE THREE GROUPS
1) Commercials — the hedgers. Producers and consumers of the physical commodity. A gold miner selling futures to lock in a price, a farmer protecting his harvest, an airline fixing fuel costs. They are not in the market to speculate. They are insuring a business. This is why the name: hedgers.
2) Non-commercials — the big speculators. Hedge funds, CTAs, managed money. They have no interest in the physical metal. They are trend followers: they buy strength and sell weakness, and their positions grow as a move matures.
3) Small traders (nonreportable) — everyone below the CFTC's reporting threshold. Often called "dumb money" — but that is lazy thinking. In thin markets, this bucket can simply hold small commercials who never reached the reporting size. Judge them case by case, not by label.
🔵 WHY COMMERCIALS AND NON-COMMERCIALS ARE OPPOSITES
This is the single most important sentence in the whole report: the two large groups are structurally on opposite sides — and you read them exactly that way.
The hedger sells strength (locking in good prices) and buys weakness (securing cheap input). The speculator buys strength and sells weakness (riding the trend). So when commercials are heavily short, they are usually short INTO strength — and that is not bearish, it is business. When non-commercials are heavily long, they are long INTO strength — and that is not confirmation, it is momentum at its most crowded.
Same report, same week, two opposite readings. Mixing them up is the classic beginner error.
🔵 THE NET NUMBER
Forget raw long and short. What matters is net: longs minus shorts. One line per group. A rising commercial net means hedgers are covering shorts or adding longs — institutional supply is shrinking. A falling non-commercial net means the trend-following crowd is bailing out — often the first sign a move is exhausting.
🔵 WHY THE CHART MATTERS
The COT report measures futures positions. So the price series it explains is the futures contract — for gold, that is GC1! (COMEX), not a spot or CFD feed. If you overlay COT data on a CFD chart, you are explaining one market with the positioning data of another.
Next lesson: why commercials are the side you actually want to follow — and where the "smart money" label really belongs.
Educational content only. Not investment advice.
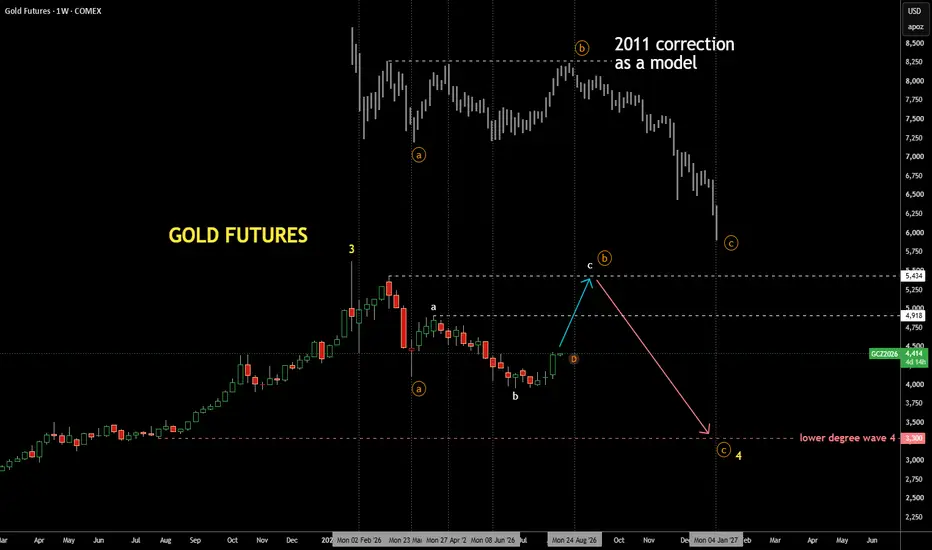
Gold Update 10AUG2026: Market Repeats 2011 MoveIndeed, the market repeats correction from peak of 2011
posted two months ago
This time I added the model above the chart for visual comparison with peaks
and troughs highlighted by vertical dashed lines
It's amazing how current price goes step for step with year 2011 model
I re-labeled the wave sequence as it gets clearer over time
Correction completed orange wave (a) and white waves a, b of orange (b)
Now, we are heading up to build the final wave c of (b)
It can hit either the top of wave a of (b) at $4,918
or higher peak at $5,434
In year 2011 model both tops are almost at the same level
After that, the final orange wave (c) should unfold
It might be shallow and long lasting because wave (a) was sharp
The target for it will be updated as we move to the right
Weekly Review (Aug 10-14): Gold, Silver & S&PWeekly review for August 10–14. Not signals, just how I read the tape with the Conflux Method: structure (Reaction Levels), order flow and options data. Metals are the focus this week, with gold and silver in a squeeze, and a very big hedge that went in on the S&P.
COMEX:GCZ2026 (Gold, main chart above)
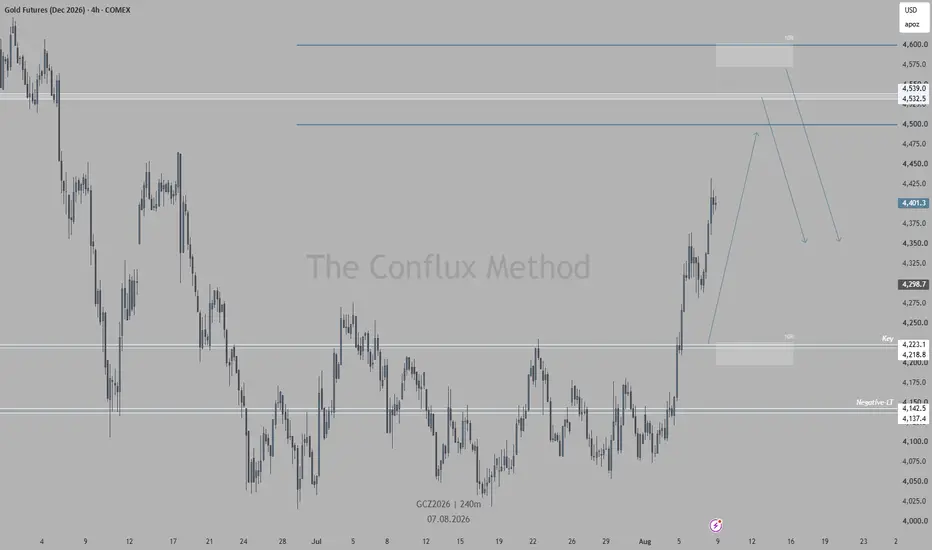
It's simpler here, I'll be watching the open. If it goes through the top, sells off 4532. If they come out even higher, to the 10% zone, then after an impulse forms I'll look at sells there too. With buys it's even simpler, 4223 looks great. And the contract's maximum volatility is at 5250 right now, if silver does go to 100.
COMEX:SIU2026 / COMEX:SIZ2026 (Silver)
For now the plan is to work it like this: if they pull back, in the clusters the 60 zone is the better-confirmed one. A spread also went in at 92–100, and right now on the chart you can see the same accumulation as back in September before the move up, an interesting coincidence. I'll be putting my buy takes onto that spread if they let me in. Above, I'll also try to catch shorts if Monday opens with a rise, since it's still unclear on the agreement between the US and Iran. At the 60 level, besides the confirmation from the clusters, there's also an intersection of two Fibonacci grids and the strongest Reaction Level zone together with Renko and P/F.
NYMEX:PL1! (Platinum)
It's also interesting to take a look at platinum futures. I often watch platinum as an indicator for spotting a nascent trend, and here there's no reversal in sight at all. That's a bit concerning, but we'll see.
CME_MINI:ESZ2026 (S&P 500)
A very big hedge went in here, really very big. If there's a decline, I'll work with futures in the 7600–7650 and 7500–7550 ranges, that is, where there are Reaction Level zones. This is the markup on the December contract. Ideally these portfolios already come with a future, but they can go in without one if they intend to buy back lower. So they've highlighted for us, with the options, what to work with, and also where to sell on a reversal from the upper portfolios.
These are zones and scenarios I'm watching, not a call to trade. Let price come to your levels and let the reads converge first.
Educational only, not investment advice. Trading carries a high risk of capital loss. Past results don't guarantee future performance.
#ConfluxMethod #trading #futures #options #gold #silver #platinum #orderflow
When the Target Becomes the Entry: Flipping TA on Its HeadMost technical-analysis textbooks teach pattern targets as destinations. A breakout occurs, the pattern provides a measured objective, and the trader watches price travel toward it.
But what if reaching the destination creates the next setup?
That is the counterintuitive idea explored in this case study. Gold Futures (GC) have produced a recognizable double-bottom structure on the daily chart. After price broke through the pattern's neckline, the subsequent advance brought GC toward the double bottom's projected objective.
Instead of treating that objective exclusively as an exit, we will examine it as a potential entry area for a move in the opposite direction.
There is an important caveat: the projected target is not being asked to do all the work. Around the same area, we also find Fibonacci retracement levels, an area of UnFilled Orders (UFO), and an extended reading relative to a Keltner Channel.
Individually, none of these observations establishes that price must reverse. Together, however, they create an interesting technical question:
Can the destination of one market move become the starting point for studying the next one?
The Double Bottom Sets the Stage
The daily GC chart provides the starting point.
After declining into the July area, gold established two distinct lows near a similar price region. Between them, price rebounded enough to create the characteristic structure of a double bottom.
Once price subsequently moved through the neckline, the pattern became relevant from a classical technical-analysis perspective.
The usual procedure is straightforward: measure the approximate vertical distance between the bottom and neckline and project that distance upward from the breakout. This produces the pattern's measured objective.
GC then advanced rapidly toward that objective.
There is a useful distinction here. A double bottom is commonly interpreted as a potential bullish reversal structure. Nothing about our analysis requires rejecting that interpretation.
Instead, we are separating two different time horizons.
The larger structure may have shifted in a bullish direction while the shorter-term move that followed the breakout becomes temporarily extended. A bearish trade taken near the measured objective would therefore represent a potential countertrend mean-reversion setup, rather than a declaration that the double bottom has failed.
That distinction will matter when we select our downside objectives.
Why Would a Target Become an Entry?
A technical target is a projection, not a promise.
Markets do not owe a chart pattern its measured move. Some patterns fail almost immediately. Others break out but never complete their projection. Still others travel the entire distance.
That last group creates an interesting condition.
Think about what price has accomplished by the time an ambitious projected target is reached. It has not simply arrived at another number on the chart. It has traveled the distance necessary to complete an entire technical pattern.
If that movement happens particularly quickly, the market may also become increasingly extended from its recent equilibrium.
This changes the question.
Instead of asking only:
"Has the target been reached?"
we can ask:
"What did price have to do to get there?"
That distinction is the foundation of this setup.
A projected target can describe not only where price might go, but also how far price has already traveled.
None of this means that pattern targets inherently cause reversals. They do not. A strong market can reach a measured objective and continue traveling in the same direction.
For that reason, using every pattern objective blindly as a countertrend entry would turn an interesting observation into a very weak methodology.
We need additional evidence.
Confluence: Don't Ask One Price Level to Do Everything
This is where the GC chart becomes considerably more interesting.
The double-bottom projection arrives in an area containing several other technical references.
A Fibonacci study drawn across the larger decline identifies the 50% retracement around 4,436.6 and the 61.8% retracement around 4,550.1.
Those levels effectively surround the double-bottom projected objective.
There is also a red UFO—an area of potential sell-side UnFilled Orders—extending approximately from 4,450.1 to 4,543.2.
Rather than one magic number, we therefore have a technical region:
Double-bottom measured objective
50% Fibonacci retracement around 4,436.6
61.8% Fibonacci retracement around 4,550.1
Sell-side UFO between approximately 4,450.1 and 4,543.2
That distinction between a price and an area is important.
Markets rarely respect the geometrical precision traders sometimes impose on charts. A Fibonacci ratio calculated to a decimal place does not mean that every participant suddenly changes behavior at exactly that price.
Confluence is more useful when it defines a neighborhood.
Here, several analytical methods independently identify approximately the same neighborhood as relevant.
That does not guarantee a reaction. It simply gives us more information than the double-bottom target could provide by itself.
One More Clue: Price Is Running Hot
The Keltner Channel adds another dimension.
Unlike the pattern target and Fibonacci levels, the channel is not primarily identifying horizontal resistance. Instead, it helps us examine how extended price has become relative to a moving reference.
On the chart, GC's advance has pushed price beyond the upper Keltner Channel.
Again, that is not automatically a bearish signal.
Markets can remain extended during strong directional moves, and selling something simply because it looks "overextended" can be an expensive habit.
What matters here is the combination.
Price is approaching the completion of a double-bottom measured move.
That objective is entering a 50%-61.8% Fibonacci retracement region.
The same neighborhood contains a sell-side UFO.
And the advance has stretched price beyond the upper Keltner boundary.
The individual pieces describe different aspects of the market. The pattern measures distance. Fibonacci examines proportional retracement. The UFO identifies an area of UnFilled Orders.
The Keltner Channel examines extension.
Their convergence is what makes the area worth studying.
Two Different Ways to Approach the Entry
If GC enters this region, execution style becomes another variable.
An aggressive approach could use a predefined limit order within the area. For illustration, 4,450.1, the lower boundary of the red UFO, can serve as our hypothetical entry.
This approach has an obvious trade-off. Entering immediately provides the intended price location, but the trader has no evidence yet that sellers will actually respond.
A more conservative approach could wait.
Price could first enter the confluence area, after which the trader would look for evidence of rejection or a developing reversal before establishing a bearish position.
The trade-off reverses. More information becomes available, but confirmation may occur at a less favorable price—or price may leave the area without providing an entry at all.
Neither approach is universally superior. They represent different ways of balancing location against confirmation.
For the numerical case study below, we will use 4,450.1 as the hypothetical entry so the risk calculations remain transparent and reproducible.
Risk First: Where Does the Idea Stop Making Sense?
Before discussing objectives, the setup needs an invalidation point.
The upper Fibonacci reference sits around 4,550.1, slightly above the upper edge of the red UFO at approximately 4,543.2.
Rather than placing the hypothetical stop precisely on that technical reference, this case study uses 4,560.1, providing a 10-point buffer above the 61.8% Fibonacci level.
That produces:
Illustrative short entry: 4,450.1
Illustrative stop: 4,560.1
Price risk: 110.0 points
This is where futures contract size becomes critical.
The exact same chart setup creates very different dollar exposure depending on which contract expresses it.
For the 100-troy-ounce GC contract, a $1.00 move in gold corresponds to $100 per contract. A 110-point adverse move would therefore represent approximately $11,000 of risk per contract, before commissions, fees and possible slippage.
For the 10-troy-ounce Micro Gold Futures (MGC), the same 110-point distance represents approximately $1,100 per contract.
For the 1-troy-ounce 1-Ounce Gold Futures (1OZ), it represents approximately $110 per contract.
The technical chart has not changed.
The dollar risk has.
That is precisely why position sizing should come after technical invalidation has been identified. Moving a technically meaningful stop simply because a particular contract creates excessive monetary exposure reverses that logic.
Two Objectives, Two Different Messages
Because this is a countertrend setup inside a potentially bullish larger structure, the first objective does not require gold to establish a new bearish trend.
The 20-period moving average around 4,184.3 (at the time of writing this article) provides the first potential objective.
From the illustrative 4,450.1 entry:
Risk to 4,560.1: 110.0 points
Distance to Target 1 at 4,184.3: 265.8 points
Reward-to-risk ratio: approximately 2.42:1
Target 1 is fundamentally a mean-reversion hypothesis. Price has become extended, and the setup asks whether it can rotate back toward its moving average.
The second objective asks more from the market.
A green UFO representing potential buy-side UnFilled Orders sits around 4,115.2, below the moving average.
Using that as Target 2:
Risk: 110.0 points
Distance to Target 2: 334.9 points
Reward-to-risk ratio: approximately 3.04:1
This distinction deserves attention.
Target 1 asks for mean reversion. Target 2 asks for something more.
A trader could therefore treat them differently. One possible risk-management framework would involve reducing exposure around the moving average while leaving some exposure for the lower UFO. Another could select only one objective from the beginning.
These alternatives are presented for illustration, not as instructions to enter or manage a position.
Actual fills, gaps, commissions and slippage would also alter the theoretical ratios.
Same Gold Market, Three Different Contract Sizes
The underlying price analysis can be examined through three differently sized COMEX gold futures contracts.
GC — Gold Futures: Contract size: 100 troy ounces | Minimum tick: $0.10/oz | Tick value: $10.00
MGC — Micro Gold Futures: Contract size: 10 troy ounces | Minimum tick: $0.10/oz | Tick value: $1.00
1OZ — 1-Ounce Gold Futures: Contract size: 1 troy ounce | Minimum tick: $0.25/oz | Tick value: $0.25
Contract specifications should always be checked before use because exchange specifications can change.
What About Margin?
Margin deserves special attention because it is not the same thing as trade risk. Current margin requirements at the time of writing this article:
GC ≈ $22,000
MGC ≈ $2,200
1OZ ≈ $220
These are calculated illustrations based on the CME methodology. Most importantly, margin is not maximum loss.
Risk Management Is the Setup
It is tempting to focus on the attractive part of this chart: several technical observations clustering around one potential reversal area.
But confluence does not remove uncertainty.
The market can trade directly through every level we have identified.
For that reason, the sequence matters:
Identify the technical area.
Decide what price behavior would invalidate the hypothesis.
Measure the distance between entry and invalidation.
Translate that distance into dollars for the chosen contract.
Determine whether that exposure fits the trader's predefined risk constraints.
Only then consider execution.
Notice what does not happen in that sequence: selecting a contract first and then squeezing the stop closer until the dollar exposure looks comfortable.
GC, MGC and 1OZ demonstrate why this distinction matters. One 110-point stop corresponds to approximately $11,000, $1,100 or $110 respectively before trading costs and slippage.
The market structure is identical. Position exposure is not.
Traders should also consider the possibility of slippage and price gaps. A stop defines an intended exit mechanism; it does not guarantee execution at the specified price.
The Bigger Lesson: Targets Contain Information
The most interesting part of this setup may ultimately have little to do with whether this particular bearish scenario works.
It is the analytical inversion.
Technical analysis often encourages us to divide chart levels into fixed categories: entries are entries, stops are stops, and targets are targets.
Markets do not know those labels.
A projected target is simply a price derived from information contained in an earlier structure. Once price reaches that location, the target has fulfilled one analytical purpose—but it may simultaneously begin serving another.
That is especially interesting when reaching the target required an unusually aggressive move and when other independent forms of analysis identify approximately the same area.
In this GC case study, the measured objective is joined by the 50% and 61.8% Fibonacci retracement region, a sell-side UFO and an extended position relative to the Keltner Channel.
If a bearish reaction develops there, the 20-period moving average around 4,184.3 provides a first mean-reversion reference, while the lower UFO around 4,115.2 offers a second, more demanding objective.
If price instead continues through the confluence area and the predefined invalidation point, the hypothesis has supplied something equally important: a reason to recognize that the anticipated scenario is not developing as intended.
That is ultimately the purpose of a structured trade idea.
Not certainty.
A framework for deciding where the hypothesis becomes interesting, where it becomes wrong, and whether the potential destination justifies the risk required to investigate it.
So, the next time a chart pattern approaches its measured objective, perhaps the analysis should not automatically end there.
Sometimes the more interesting question begins precisely at the target.
Data Consideration
When charting futures, the data provided could be delayed. Traders working with the ticker symbols discussed in this idea may prefer to use CME Group real-time data plan on TradingView: www.tradingview.com - This consideration is particularly important for shorter-term traders, whereas it may be less critical for those focused on longer-term trading strategies.
General Disclaimer
The trade ideas presented herein are solely for illustrative purposes forming a part of a case study intended to demonstrate key principles in risk management within the context of the specific market scenarios discussed. These ideas are not to be interpreted as investment recommendations or financial advice. They do not endorse or promote any specific trading strategies, financial products, or services. The information provided is based on data believed to be reliable; however, its accuracy or completeness cannot be guaranteed. Trading in financial markets involves risks, including the potential loss of principal. Each individual should conduct their own research and consult with professional financial advisors before making any investment decisions. The author or publisher of this content bears no responsibility for any actions taken based on the information provided or for any resultant financial or other losses.
SELL OPPORTUNITY FOR GOLDWith the Bat + Crab PRZ Cluster inside the Daily Order Block, we see an opportunity to take advantage of the buy side LIQUIDITY SWEEP to SHORT. Gold is hunting liquidity and I think the hunters are about to become the hunted.
After sweeping SELL SIDE LIQUIDITY around $4000, GC1! has delivered a textbook bullish leg with BOS > CHOCH > MMS. Now we are back into HTF supply where sellers have been waiting since June.
I'm waiting for a precise harmonic + SMC confluence hence shorting opportunities..
📍 THE CONFLUENCE - 5 REASONS THIS ZONE MATTERS:
1. BUY SIDE LIQUIDITY - $4,432 - Daily highs are being swept. Classic liquidity grab before reversal.
2. BEARISH FVG - 5th JUNE - Daily bearish Fair Value Gap left unfilled for 2 months. Price always returns.
3. ORDER BLOCK - $4400-$4480 - Last bearish OB before the June selloff. Institutions last defense.
4. BAT PATTERN PRZ - 88.6% XA - D leg completes at 88.6% retracement of X-A. B leg respected 38.2-50% - perfect Bat structure.
5. CRAB PATTERN PRZ - 161.8% XA - The deeper harmonic. Crab D = 1.618 XA extension. When BAT 88.6% and CRAB 161.8% complete in the SAME box, that's a PRZ CLUSTER. Rare and powerful.
NOTE: This is not financial advice. Educational idea only. Manage your risk as Always
gold mcx breakout update ready to firegold given breakout above 146000@ now expect level below--
hold abv 146000 buy on dips with sl 145300 up side move 147600-148000++
sustain below 145000 again down side 144200-143890++++ possible
key level to watch----- 146000@
liquidity for sl hunt expect 147--148k
ideas-- buy on dips with given above sl
Gold Breakout Gold's technical structure is beginning to look like a meaningful trend reversal rather than another bear-market rally.
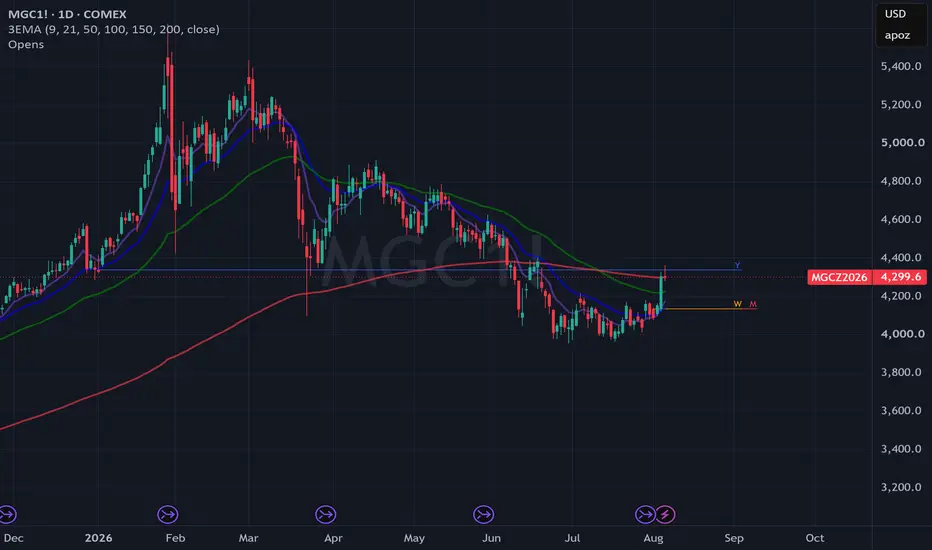
After the January-July correction, gold established a significant base around $4,000. Since then, price has recovered the major moving averages, broken multiple intermediate downtrend lines, and has now broken the dominant downtrend from the January high.
That changes the technical setup.
Momentum is accelerating, but RSI is not yet at an extreme that would suggest the move is exhausted. Meanwhile, traders who waited for confirmation are increasingly being forced to chase. FOMO is developing before technical exhaustion, creating the possibility that the near-term pain trade is simply higher.
Key Levels
$4,390-$4,451: Immediate resistance. Gold is testing the October 2025 high near $4,400, with the 50% Fibonacci retracement of the April-July decline at $4,451 just above it.
A sustained break above this zone would provide another major confirmation that the correction has ended.
$4,790: Next major resistance and the 50% retracement of the larger January-July decline.
$4,200-$4,210: Preferred pullback zone. A retracement into this area followed by sustained price action would offer a cleaner second-inning entry than chasing the breakout.
$4,000: Major structural support and the line in the sand for the current bullish thesis.
A decisive loss of $4,000 would materially damage the reversal structure and reopen the possibility of $3,600.
Moving Averages
Gold has now recovered its major moving averages. The next confirmation would be the averages themselves turning higher and producing bullish crossovers.
Price leads. Moving averages confirm.
Macro Confirmation
The macro backdrop is also becoming less hostile.
The traditional gold headwinds of rising real rates, restrictive Fed policy and contracting liquidity are no longer moving uniformly against gold. The feared Warsh balance-sheet contraction has not materialized, the Fed declined to hike in July, PBoC liquidity remains supportive, and recent U.S.-Japan intervention in the yen reinforces the broader theme of increasing policy intervention in financial markets.
None of these guarantee higher gold prices. But the important change is that macro and technical momentum are beginning to point in the same direction.
Trade Setup
Bull case: Hold the breakout → clear $4,451 → target the $4,790 resistance zone.
Preferred entry: Pullback toward $4,200-$4,210 that holds as support.
Bear case: Failure of the breakout followed by a loss of $4,000 → downside risk toward $3,600.
The biggest risk for bulls waiting on the sidelines is that the ideal pullback never arrives.
As Stanley Druckenmiller's trading philosophy suggests, there is value in entering during the second inning once you know the game has actually started.
Gold hasn't completely proven the new bull leg yet.
But increasingly, it looks like the first inning is already underway.
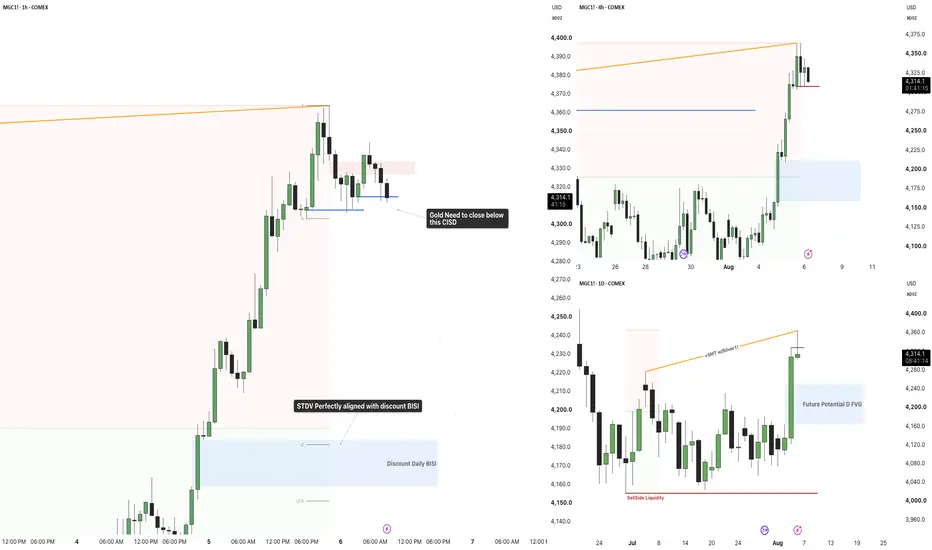
Gold Just Hit Premium Pricing, Is This Retracement Healthy?Gold remains bullish across the higher timeframes after a strong impulsive rally from discount pricing.
- Daily SMT divergence with Silver remains valid.
- Price has delivered a strong displacement from the Daily discount zone.
- The next higher-timeframe objective remains the premium liquidity overhead.
The broader trend has not changed.
What Happened?
After the impulsive rally, Gold has started to retrace from premium pricing.
This pullback is taking place after:
- Strong bullish displacement.
- Multiple higher highs and higher lows.
- Price reaching a premium dealing range.
On the 1H chart, price is now testing an important bullish CISD.
This level is likely to determine whether the current move is simply a healthy retracement or the beginning of a deeper correction.
What I'm Watching
Bullish Scenario
- H1 CISD continues to hold.
- Buyers defend the current discount area.
- Price resumes higher toward the recent highs.
Bearish Scenario
A decisive close below the H1 CISD would invalidate the current intraday bullish structure.
If that happens, I expect Gold to seek the Daily Discount BISI, which aligns closely with the -2 Standard Deviation, making it the next high-probability draw on liquidity.
Gold Futures (MGC) – Wednesday OutlookYesterday played out almost exactly as I expected—price reached up into my higher-timeframe area late in the NY session, printing a high around 4163.8 before sellers stepped back in aggressively. By the close, price had not only rejected the highs but also traded back below Monday's low, showing that buyers still haven't proven they can hold value higher.
As we head into Wednesday, my focus shifts to a 30-minute Fair Value Gap just overhead.
I'm not interested in chasing shorts down here.
Instead, I'd rather see price retrace back into that imbalance. If buyers push into the FVG, it gives the market an opportunity to finish the auction on the upside.
What I'm really looking for is excess.
By excess, I don't simply mean price reaching resistance. I want to see the auction become well-balanced on the DOM and Volume Profile, with a clean taper at the highs. That tells me buyers have exhausted themselves rather than simply running out of time. If that develops inside the 30-minute FVG, it creates a much higher-quality failed auction for sellers to take control.
That setup would also push price outside the primary value area that has developed since the end of June. A rejection from outside value followed by acceptance back inside would strengthen the bearish case considerably.
My Game Plan
📈 Bullish into the 30M FVG.
❌ Watch for excess and buyer exhaustion.
📉 Look for acceptance back below value before considering shorts.
If buyers instead accept above the FVG and begin building value there, I'll step aside. A good trader doesn't marry a bias—they follow where value is being established.
Patience before prediction. The best trades usually come after the market finishes telling its story.
Gold – Arc Cycle Outlook | Potential Rebound at Support ArcGold Futures (GC1!) is currently interacting with a Support Arc within the current Arc Cycle, where price is showing signs of respecting the underlying Time & Price structure.
The current market behavior suggests a potential rebound from this Support Arc. If this scenario remains valid, price is expected to continue toward the next Resistance Arc, while a failure to hold this level could shift the outlook toward the next Support Arc.
XAUUSD ANALYSIS
ANALYSIS
---
# GC1! | PDH Liquidity Sweep into HTF Bearish Order Block | ICT Premium Distribution Model
## Executive Summary
Gold Futures (GC1!) have rallied into a high-probability institutional reaction zone after engineering liquidity above the **Previous Day High (PDH)**. The liquidity sweep occurred within a premium dealing range, where multiple bearish confluences—including SMT divergence, a Higher Timeframe Bearish Order Block, and an unmitigated Fair Value Gap—suggest the potential for a bearish repricing.
Rather than anticipating a reversal, this setup focuses on waiting for bearish confirmation before targeting internal sell-side liquidity.
**Market Bias:** Bearish while price remains below the Higher Timeframe Bearish Order Block.
---
# Market Narrative
Price delivered a strong bullish expansion from the Previous Day Low (PDL), rebalancing inefficiencies before attacking **Previous Day High (PDH)** liquidity.
The raid above PDH occurred directly beneath the **Previous Week High (PWH)** and inside a Higher Timeframe Bearish Order Block, placing price in a premium environment where institutional distribution frequently occurs.
Adding further weight to the bearish thesis, **SMT divergence** developed during the rally, indicating weakening relative strength despite the continued advance.
If sellers reclaim control through a lower-timeframe Market Structure Shift (MSS), the market may begin delivering toward internal sell-side liquidity and nearby bullish imbalances.
---
# Institutional Confluences
### Previous Day High (PDH) Liquidity Sweep
The market engineered liquidity above PDH before showing signs of rejection.
Liquidity raids above previous session highs frequently precede institutional reversals when supported by additional confluences.
---
### Previous Week High (PWH)
The weekly liquidity objective remains overhead, placing price within a higher-timeframe premium zone where institutional selling interest may increase.
---
### Higher Timeframe Bearish Order Block
Price is trading beneath a significant bearish Order Block that previously initiated an impulsive decline.
This remains the primary institutional supply zone and serves as the invalidation area for the bearish thesis.
---
### Bearish Fair Value Gap (FVG)
The current rally has mitigated a bearish Fair Value Gap, providing an efficient location for institutional sell orders to enter the market.
---
### SMT Divergence
SMT divergence developed during the advance, indicating that correlated markets failed to confirm the new highs.
This intermarket divergence often precedes a liquidity reversal when combined with premium pricing.
---
### Premium Pricing
The market is currently trading in premium relative to the active dealing range, favoring short opportunities over aggressive buying.
---
# Trade Plan
## Entry
**Entry:** **4,149.90**
The preferred short entry follows:
* PDH liquidity sweep
* Rejection inside the Bearish Fair Value Gap
* SMT divergence
* Lower-Timeframe Market Structure Shift (MSS)
* Bearish displacement confirming institutional selling
---
## Stop Loss
**Stop Loss:** **4,178.90**
A sustained acceptance above this level weakens the bearish narrative and increases the probability of continuation toward the Higher Timeframe Bearish Order Block and Previous Week High liquidity.
---
## Profit Targets
### TP1 — Internal Sell-Side Liquidity (SSL)
**Target:** **4,107.30**
The first objective aligns with Internal Sell-Side Liquidity and a nearby bullish Fair Value Gap, making it a logical area for partial profit-taking.
---
### TP2 — 4084
A successful break below Internal SSL increases the probability of price seeking liquidity resting beneath the **Previous Day Low (PDL)**.
---
EXTENDED
### TP3 — Higher Timeframe Bullish Order Block
Should bearish momentum accelerate, price may continue into the Higher Timeframe Bullish Order Block near the **4,055–4,060** region, completing a deeper discount rebalance.
---
## Risk-to-Reward
* **Entry:** 4,149.90
* **Stop Loss:** 4,178.90
* **TP1:** 4,107.30 (Internal SSL)
* **TP2:- 4084
**Projected Risk-to-Reward:** Approximately **7:1**, offering favorable asymmetry if bearish confirmation develops.
---
# Liquidity Roadmap
### Completed
* ✅ Previous Day Low expansion
* ✅ Bullish Displacement
* ✅ Previous Day High Liquidity Sweep
* ✅ Premium Repricing
* ✅ Bearish FVG Mitigation
* ✅ SMT Divergence
### Monitoring
* ⏳ Lower-Timeframe MSS
* ⏳ Bearish Displacement
* ⏳ Internal SSL Raid (TP1-TP2)
* ⏳ Previous Day Low (TP3)
---
# Alternative Scenario
If buyers establish sustained acceptance above **4,178.90** and continue through the Higher Timeframe Bearish Order Block, the bearish setup becomes invalid. In that scenario, the market may continue expanding toward **Previous Week High (PWH)** liquidity before encountering the next significant area of institutional supply.
---
# Trade Checklist
* ✅ Higher Timeframe Bias
* ✅ Premium Pricing
* ✅ Previous Day High Liquidity Sweep
* ✅ Previous Week High Overhead Liquidity
* ✅ SMT Divergence
* ✅ Higher Timeframe Bearish Order Block
* ✅ Bearish Fair Value Gap
* ✅ Defined Risk
* ⏳ Lower-Timeframe MSS Confirmation
* ⏳ Bearish Execution Trigger
---
# Conclusion
This setup reflects a high-confluence ICT premium distribution model, where price engineers liquidity above the **Previous Day High** within a premium dealing range before testing a Higher Timeframe Bearish Order Block. The combination of **PDH sweep, SMT divergence, Bearish Fair Value Gap mitigation, and institutional supply** creates a compelling bearish framework. Execution remains conditional on lower-timeframe confirmation, with downside objectives focused on **Internal Sell-Side Liquidity**, the **Previous Day Low**, and the Higher Timeframe Bullish Order Block.
---
**Educational Disclaimer**
This analysis is provided solely for educational purposes to illustrate ICT and Smart Money Concepts. It presents a scenario-based market interpretation and should not be considered financial advice or a prediction of future price movement. Always wait for confirmation and apply disciplined risk management before entering any trade.
Gold Update [30JUL2026]wave 4 of wave C shows another peak which potentially shapes a triangle
this spike should keep below previous high of $4,171 to fit triangle's rule
The low of wave 3 as a target was eliminated as triangle would accumulate
enough bearish momentum to drop much lower
Other downside targets remain unchanged from previous update
RSI keeps Bearish position under the "waterline"
Bullish trigger is set at the bottom of wave 1 at $4,510