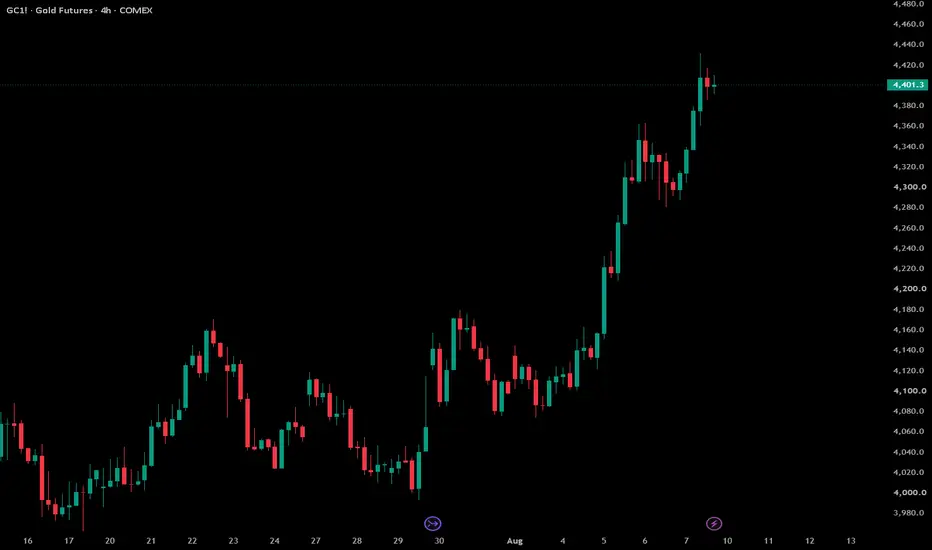
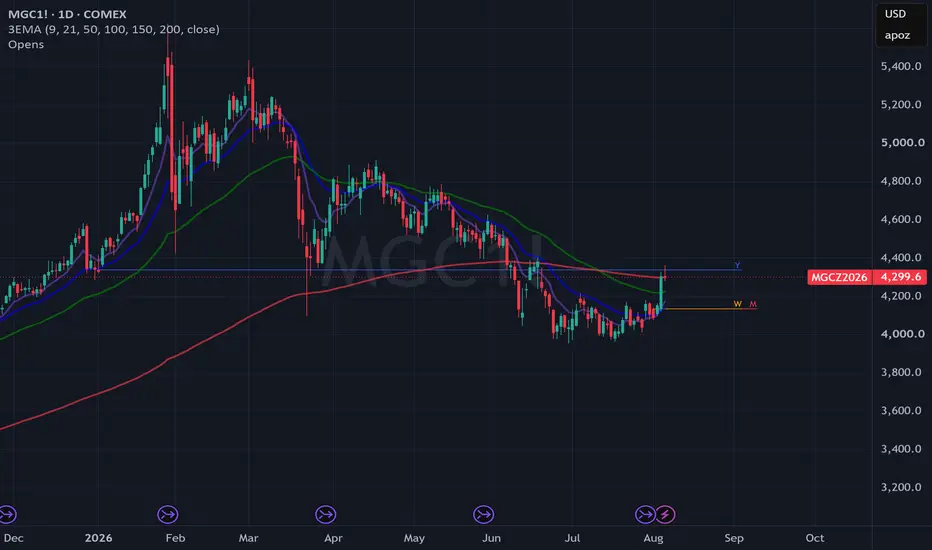
GOLD: A Superposition at $4,400 — Which State Collapses First?My own system is printing Sell on the weekly right now. On the monthly, the same
system prints Strong Buy with a first target near 5,195. Same indicator, same
data, opposite conclusions.
My indicators are private, so the chart here is clean price action and I am
quoting their readings instead of sh
Compare with Gold Futures (Feb 2024)
Contract highlights
GOLD: Bullish Going Into This Week. But Is It A Buy?In this Weekly Market Forecast, we will analyze Gold for the week of Aug 10-14th.
Gold enters the week with a bullish bias after a strong rally pushed prices near $4,400/oz, though the potential for high volatility looms.
As bullish as it may have ended last week, it closed in a potentially resista
Can the Precious Metals Maintain Momentum?Since the highs recorded in January of this year, the precious metals broadly have seen selling pressure after an almost extreme run to the upside. There was large central bank buying of Gold and Silver during the run higher and the momentum carried these markets to all time record highs. Looking at
GOLD: A Superposition at $4,400 — Which State Collapses First?My own system is printing Sell on the weekly and Strong Buy on the monthly at the
same time. Same indicator, same data, opposite conclusions. Below are all three
timeframes exactly as my panel printed them, with what each one is actually saying.
Every probability stays open. I am not predicting. I
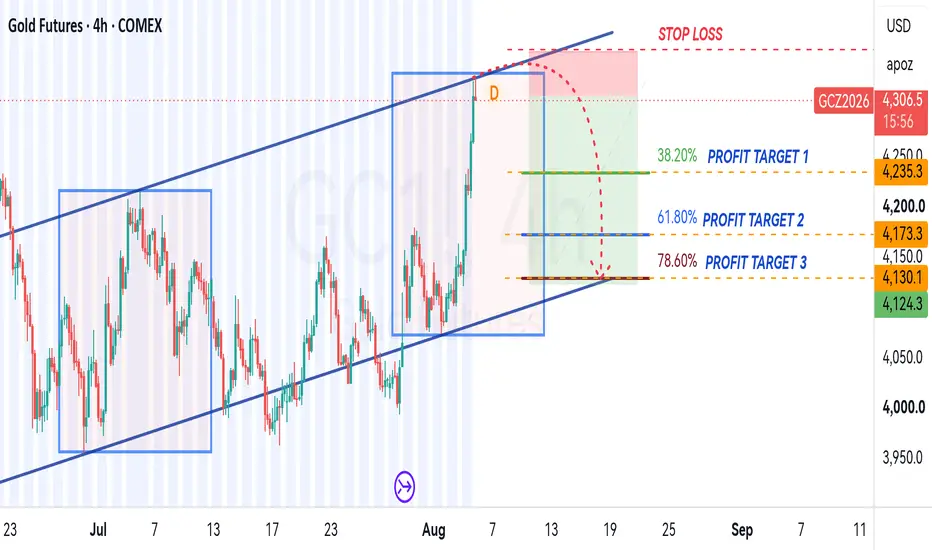
SELL GOLDToday's bullish move was monumental, we now expect a major drop of price since price action reached a strong supply zone,.. the current high is also a Potential Reverse Zone of a Harmonic Bearish Crab on the daily TF which is good confluence, we anticipate distribution to the downside....As always e
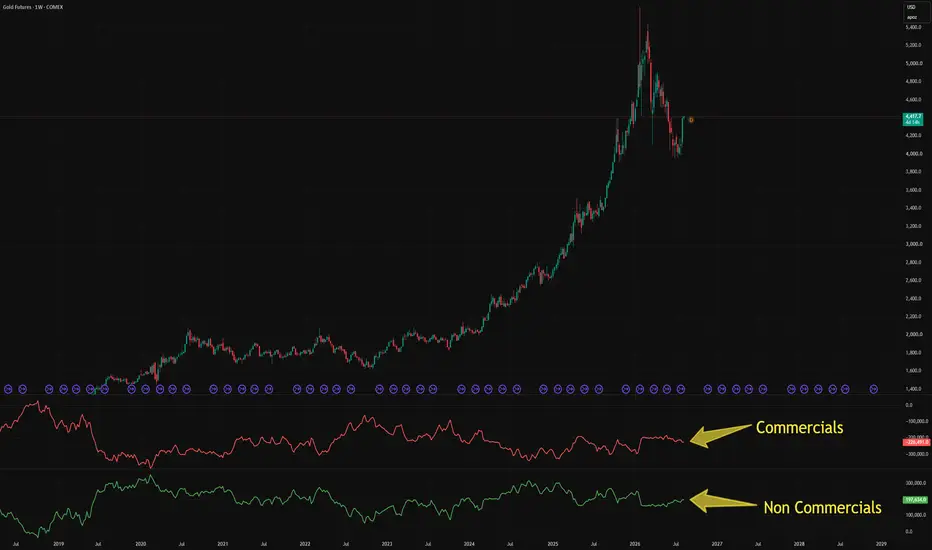
COT 101 · Lesson 01 — How to Read the COT Report🔵 THE THREE GROUPS
1) Commercials — the hedgers. Producers and consumers of the physical commodity. A gold miner selling futures to lock in a price, a farmer protecting his harvest, an airline fixing fuel costs. They are not in the market to speculate. They are insuring a business. This is why the
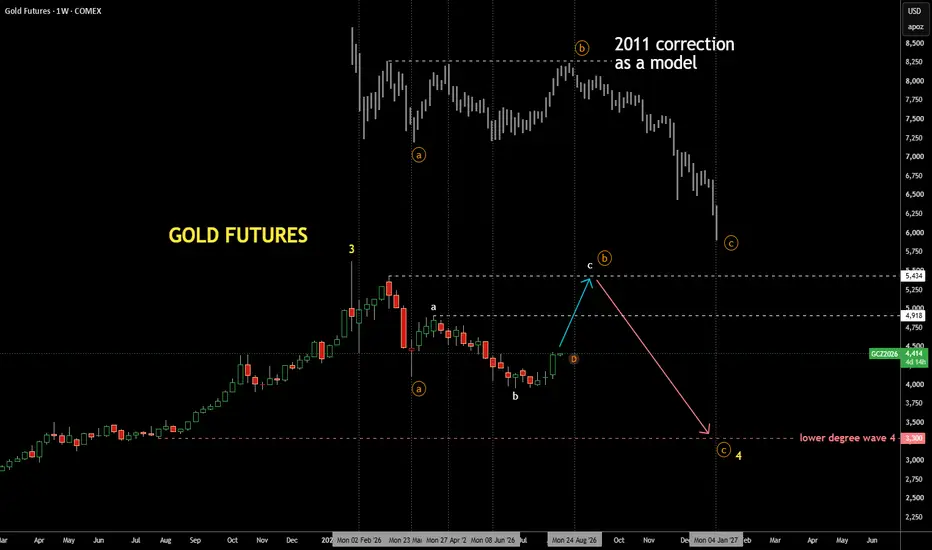
Gold Update 10AUG2026: Market Repeats 2011 MoveIndeed, the market repeats correction from peak of 2011
posted two months ago
This time I added the model above the chart for visual comparison with peaks
and troughs highlighted by vertical dashed lines
It's amazing how current price goes step for step with year 2011 model
I re-labeled the wav
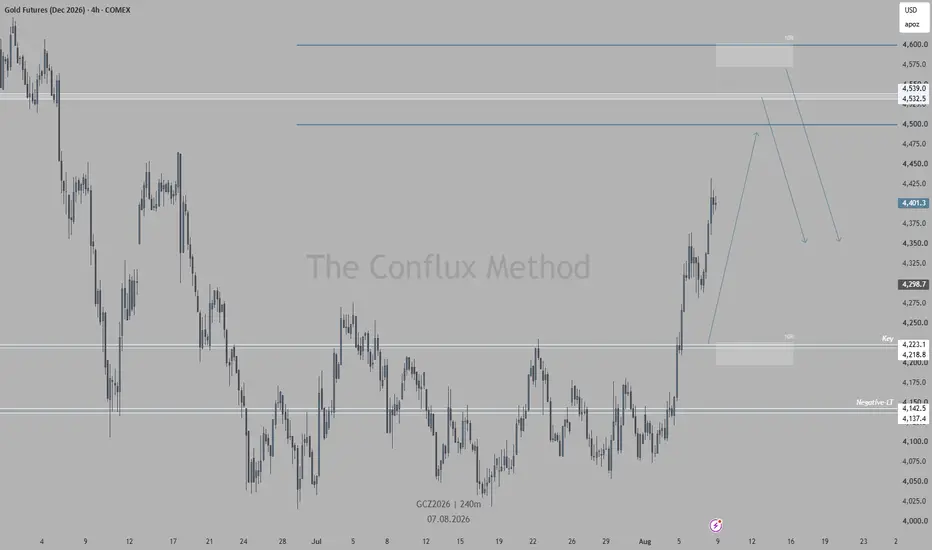
Weekly Review (Aug 10-14): Gold, Silver & S&PWeekly review for August 10–14. Not signals, just how I read the tape with the Conflux Method: structure (Reaction Levels), order flow and options data. Metals are the focus this week, with gold and silver in a squeeze, and a very big hedge that went in on the S&P.
COMEX:GCZ2026 (Gold, main chart
See all ideas
A representation of what an asset is worth today and what the market thinks it will be worth in the future.
Displays a symbol's price movements over previous years to identify recurring trends.
Frequently asked questions
The nearest expiration date for Gold Futures (Feb 2024) is Feb 27, 2024.
Traders prefer to sell futures contracts when they've already made money on the investment, but still have plenty of time left before the expiration date. Thus, many consider it a good option to sell Gold Futures (Feb 2024) before Feb 27, 2024.