DJI — Wave 4 Still in Progress | 48,500 Projected Completion ZonThis is a wave projection, not a current support call.
Wave 4 is still developing, so the current move should be viewed as part of the ongoing correction.
Based on the present structure, 48,500 is being projected as a potential Wave 4 completion area.
The correction may need both time and price development, with the current projection allowing for a move toward this area around November 2026.
If Wave 4 completes around this zone and the structure confirms, Wave 5 could then begin.
Key points
In-depth trading ideas
US30 Tests Broken Support — 50,000 Still in FocusUS30 is currently trading around 51,380, after breaking below an important support zone inside a clearly defined descending channel.
Price is now attempting to stabilize beneath the former 51,500–51,750 support area. If the market retests this zone and confirms rejection, the bearish structure would remain intact and could open the way for another move lower toward 50,000, which is also close to the lower boundary of the channel.
However, a sustained recovery back above 51,750, followed by a b
US30 - Short view📉 **US30 — SHORT VIEW**
🔻 **Entry:** CMP
🎯 **Target:** 52,460
🛑 **Stop Loss:** Above the recent swing high
US30 is showing weakness after recent selling pressure. I’m looking for a continuation move toward **52,460**.
⚠️ Wait for price confirmation before entering and manage risk properly.
#US30 #DowJones #DJI #TradingView #ShortSetup #PriceAction #TradeSetup
US30 2H viewThe index has broken its multi-day ascending trendline. Momentum is shifting to the sell side as buyers fail to hold the highs.
* Market Price: 54,009
* The Setup: Classic break-and-retest play. Price is pulling back to test the broken trendline and horizontal resistance confluence.
------------------------------
## 💡 EXECUTION PARAMETERS
* 🔻 Entry Zone: 54,010 – 54,050 (Look for bearish rejections on 15m/30m charts)
* 🛑 Stop Loss: 54,370 (Invalidation above recent swing high)
* 🎯 Take Profit
US30: Trendline Breakout & Bearish Structural ShiftUS30: Trendline Breakout & Bearish Structural Shift 📉
Description:
The Dow Jones Industrial Average (US30) has broken below a key multi-touch ascending trendline on the 2-hour timeframe, signaling a significant shift in the bullish structure. This breakdown suggests that the previous momentum is exhausted, and the market is now transitioning into a corrective phase. We are monitoring the price as it reacts to this trendline violation, with the focus on potential downward moves toward the establ
US30 Strategy: Channel Accumulation & Short Squeeze
1. Market Context
On the 1H chart of image, US30 is trading within a dominant ascending channel. After reclaiming the lower boundary from the pink "Kill Zone" (50,400), the price surged to the upper trendline resistance at 52,200 (marked "Seller") before entering a healthy corrective phase.
2. Sentiment & Liquidity Analysis
• The Seller Trap: Retail traders aggressively shorted the touch of the upper trendline resistance ("Seller" at 52,200), expecting a drop back to the channel bottom. Thei
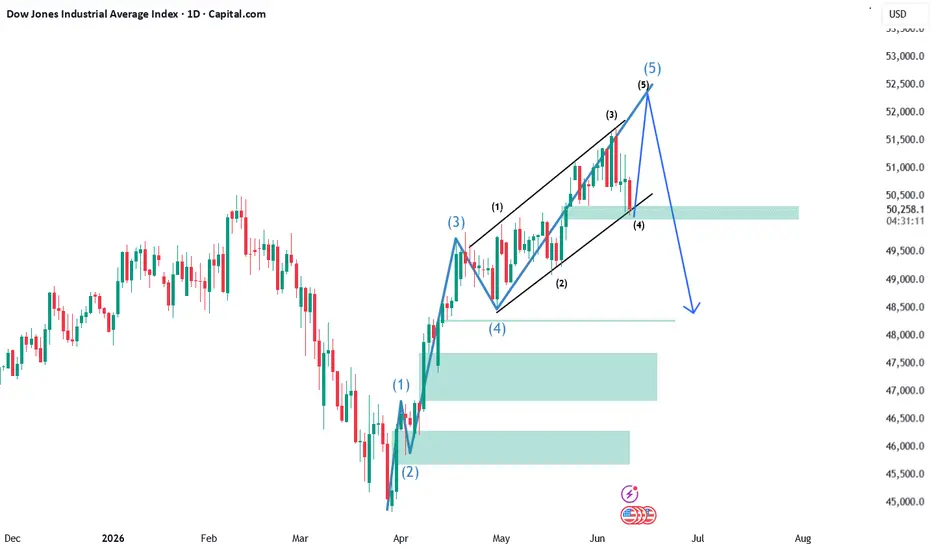
US 30 Bullish !!! Elliot Wave and Neo Wave PredictionDow Jones Industrial Average (DJIA) – Elliott Wave Analysis
The chart illustrates a bullish Elliott Wave structure that appears to be nearing completion within a larger impulsive advance. Following the sharp March 2026 decline that bottomed near the 45,000 region, the Dow Jones has staged a strong five-wave recovery.
Current Wave Structure
Wave (1) initiated the reversal from the March lows, signaling the end of the prior bearish phase.
Wave (2) completed as a corrective retracement, holding a
Dow Jones Average Points Toward Potential Short-Term CorrectionThe Dow Jones Industrial Average Index (30-minute chart) exhibits signs of exhaustion after a strong bullish run, hinting at a potential short-term bearish correction or consolidation phase ahead. here is an in-depth breakdown of what to expect in the coming week trading sessions.
Double Top / Distribution Pattern: After hitting its highest point around May 26th, the price pulled back sharply before attempting another rally toward the end of the month. However, it failed to make a higher high,
US market about to witness small correctionDow Jones Elliott Wave Analysis | 4H Chart
The Dow Jones Industrial Average (DJIA) appears to have completed a strong five-wave impulsive rally from the recent lows, with price now approaching a critical decision zone near channel resistance.
The current structure suggests:
Waves (1) through (5) have largely completed within a rising wedge / ending diagonal formation.
Price faced rejection near the upper trendline after Wave (5), indicating weakening bullish momentum.
The recent sharp decline
DOW jones Trend Analysis DJIA Weekly Chart Analysis
The global market has gone through major geopolitical tension because of the conflict involving the US, Iran, and Israel. Commodity prices have already seen a strong rally, and now investors are again shifting focus toward equity markets, especially the US market. This movement is also creating positive sentiment across global markets, including India.
On the weekly chart, the Dow Jones is trading near an important resi
NIFTY 50 ANALYSIS | 19-MAY-2026 | TUESDAY | 15-MIN TF## NIFTY 50 ANALYSIS | 19-MAY-2026 | TUESDAY | 15-MIN TF
### V-Shape Short Squeeze Defies Macro Storms: Bulls Reclaim 23,600!
Despite crude oil boiling over $110 and a battered rupee, Nifty staged a ferocious 378-point intraday recovery from its panic lows on Monday. If you shorted the morning gap-down based on global headlines, you got carried out on a stretcher—here is how we play the follow-through.
---
### 📌 1. FINAL VERDICT
* **Current Market Look:** A textbook institutional liquidity
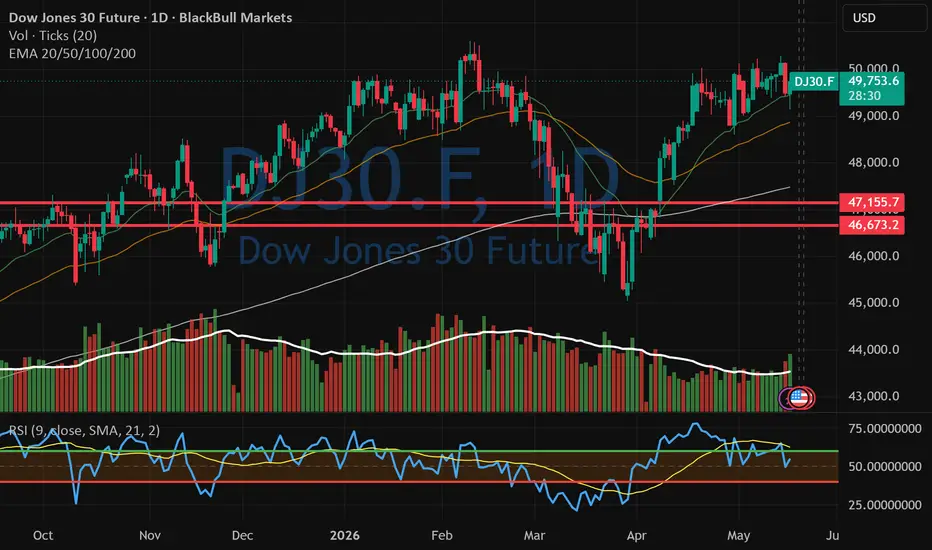
Divergence at weekly Dow Jones.The weekly Dow Jones is back at 49,700 level(just 300 points away from 50,000) but RSI (close,14) has not crossed 65 level. It is around 60. Divergence (weak) can be spotted and geopolitical tensions are on rise. It doesn't mean that the fall is imminent but something to keep an eye on.
DowJones (DJI) Short Range /Intra-Swing Levels 24th-25th APR'26 🔕 SGMN SplD BULLISH Above => 49432.
🔕 SGMN SplD Bearish BELOW => 49188.
DowJones (DJI) Short Range /Intra-Swing Levels 24th-25th APR 2026 (1:30 am)
━━━━━🟥🟧🟨🟩🟦🟪⬛━━━━━
💥Level Interpretation / description:
✍🏻L#1: If the candle crossed & stays above the “Buy Gen”, it is treated / considered as Bullish bias. Cfm=> Confirmation.
L#2: Possibility / Probability of REVERSAL near 🔕RL/TF1 & 🔔RL/TF2
L#3: If the candle stays above “Sell Gen” but below “Buy Gen”, it is treated / considered as
DowJones (DJI) Short Range /Intra-Swing Levels 23rd-24th APR'26 DowJones (DJI) Short Range /Intra-Swing Levels 23rd-24th APR 2026 (1:30 am)
🔕 SGMN SplD BULLISH Above => 49668
🔕 SGMN SplD Bearish BELOW => 49373
━━━━━🟥🟧🟨🟩🟦🟪⬛━━━━━
💥Level Interpretation / description:
✍🏻L#1: If the candle crossed & stays above the “Buy Gen”, it is treated / considered as Bullish bias. Cfm=> Confirmation.
L#2: Possibility / Probability of REVERSAL near 🔕RL/TF1 & 🔔RL/TF2
L#3: If the candle stays above “Sell Gen” but below “Buy Gen”, it is treated / considered as
DowJones (DJI) Short Range /Intra-Swing Levels 22nd-23rd APR'26DowJones (DJI) Short Range /Intra-Swing Levels 22nd-23rd APR 2026 (1:30 am)
━━━━━🟥🟧🟨🟩🟦🟪⬛━━━━━
💥Level Interpretation / description:
✍🏻L#1: If the candle crossed & stays above the “Buy Gen”, it is treated / considered as Bullish bias. Cfm=> Confirmation.
L#2: Possibility / Probability of REVERSAL near 🔕RL/TF1 & 🔔RL/TF2
L#3: If the candle stays above “Sell Gen” but below “Buy Gen”, it is treated / considered as Sidewise. Aggressive Traders can take Long position near “Sell Gen” either r
DowJones (DJI) Short Range/Intra-Swing Levels 21st-22nd APR'2 6 🔕 SGMN SplD BULLISH (BIAS) Above => 50010.
🔕 SGMN SplD Bearish (BIAS) BELOW => 49168.
Mentioned analysis based on 2 consecutive candle close in 15 min Time Frame.
━━━━━🟥🟧🟨🟩🟦🟪⬛━━━━━
💥Level Interpretation / description:
✍🏻L#1: If the candle crossed & stays above the “Buy Gen”, it is treated / considered as Bullish bias. Cfm=> Confirmation.
L#2: Possibility / Probability of REVERSAL near 🔕RL/TF1 & 🔔RL/TF2
L#3: If the candle stays above “Sell Gen” but below “Buy Gen”, it is treated / con
#DJI 50k target soon🔥 Dow Jones: Impulse in Action 🚀💵
After completing its correction on 31 Mar at 45K, the Dow Jones entered a fresh impulsive wave. Let’s break it down:
1️⃣ Wave 1 (1 Apr): High at 46,800 📈
2️⃣ Wave 2: Running flat correction 🔄
3️⃣ Wave 3: Powerful rally to 48,200 ⚡️
4️⃣ Wave 4: Healthy ~50% retracement 📉
5️⃣ Wave 5 (current): Already 4 sub‑waves complete 🔥 — extension possible up to 50K 🎯
💡 Takeaway for traders:
Corrections clear the path, impulses drive the trend. With Dow Jones eyeing 50K, ca