Nifty 50 Trade Plan [12.08.2026: Wednesday]Probable Scenario Analysis and Trade Plan for the Nifty 50 Index NSE:NIFTY for the 12th of August, 2026. The day is Wednesday.
🟢 Bullish Scenario
Presently, there is no bullish scenario. For a bullish scenario to emerge, the price has to sustain above level 24550 with an exclusive green marubozu candle. The probable weak bullish target above 24550 would be - 24600. There will be strong resistance at 24600. Next, if the price sustains above 24600, then a strong bullish move would emerge. The probable strong bullish targets above 24600 would be - 24650 and 24700.
🔴 Bearish Scenario
Presently, the price is in a bearish zone. Every up move should be doubted. Stay bearish below 24450. A weak bearish target would be - 24400. The price might receive good support at 24400. Next, if the price decisively breaks down below 24400, then a strong bearish setup would emerge. The probable bearish targets below 24400 would be - 24350 and 24300.
🟡 No Trading Zone (NTZ): (24550 - 24450).
⏺ Range of Consolidation (Mi-ROC): (24600 - 24400).
Here, 24500 is the median of the Mi-ROC. The median works like a trading session sentiment evaluator. The price trading above the median would offer bullish sentiment, while the price trading below the median would trigger bearish sentiment within the ROC.
● Event
There is no major event or holiday. But geopolitical issues are omnipresent and beyond our control.
● Intraday, Weekly, and Monthly Bias
Establish bias with respect to the opening price (of the particular session - Intraday, Weekly, and Monthly). If the price sustains above the opening price, then don't think of shorting. Look for bullish trades only. On the contrary, if the price sustains below the opening price, then don't think of going long. Look for bearish trades in that case.
● Disclaimer + End Note
- All the analyses would fail in the case of a major gap up, gap down, or price structure anomaly. Thus, practice PRAGMATISM in the live session.
- Trade only if there is a set-up. Remember, not trading is an extension of the trading activity.
- Mark your points. Trade your points. Price is GOD. Anything can happen in the markets. Thus, trade what you see, not what you believe.
- Always PRACTICE RISK MANAGEMENT. Always PROTECT YOUR CAPITAL. Be RESPONSIBLE.
- Be Strategic. Be Courageous. Be Patient. Be Wise.
- Every day is a new day. Thus, do not carry the baggage of past successes or failures. Leave the gardens of winning and losing. Establish yourself in equanimity. Always think from a new perspective.
- Let the joy of trading drive your effectiveness, not greed or fear. Believe in Possibilities.
Happy Trading!
Nifty 50 Index
No trades
No trades
In-depth trading ideas
Nifty - Weekly review August 10 to 14On Monday, we had a gap-up opening; the price opened above the important zone of 24500 and closed above it. The price did not give a big move, but moved in range after that.
The price should gain strength to move up further.
Buy above 24520 with the stop loss of 24460 for the targets 24580, 24620, 24680, 24720 and 24760.
Sell below 24380 with a stop loss of 24440 for the targets 24340, 24280, 24220, 24180 and 24120.
Always do your analysis before taking any trade.
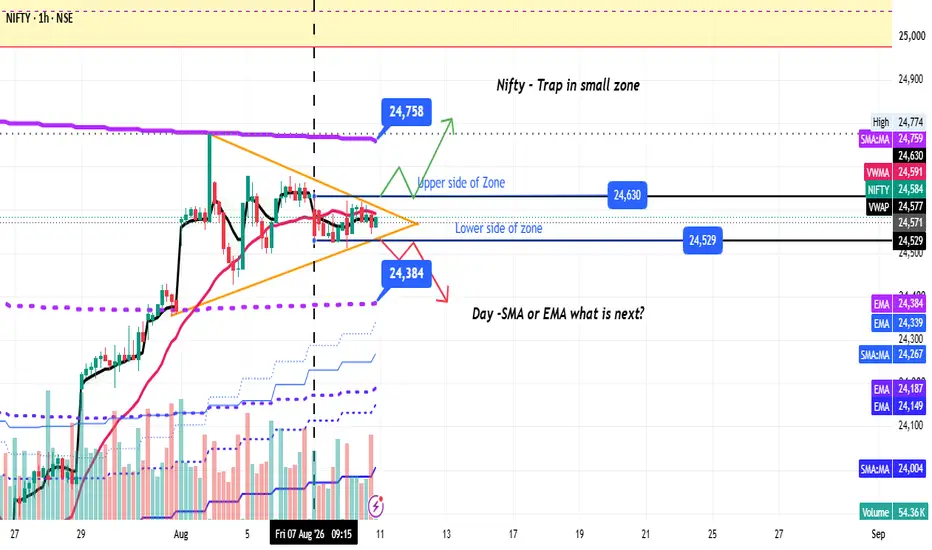
Nifty at key levels : Waiting for the breakout or breakdown Today's Monday session is over, and Nifty remained trapped in a range. My view is simple: wait for the no-trade zone to break before taking any position.
✅ Above 24,630 and a successful retest, I will look for long opportunities.
✅ Below 24,529, I will look for short opportunities.
Keep in mind that tomorrow is expiry day, so risk management is very important. Trade only if the risk-to-reward ratio is favorable. Otherwise, waiting for a clear direction may be the better option.
This is an important zone because:
200 SMA is acting as a key target/resistance area for the bullish side.
200 EMA is acting as an important support area for the bearish side.
Once this range breaks, Nifty could make a fast move. However, there's also a possibility of another sideways expiry, often called a "seller's expiry."
For now, patience is the strategy. Let the market show its direction first.
What are your views? Do you expect a breakout, breakdown, or another sideways expiry? Let's learn together. 📊😊
Disclaimer:
This is only my personal technical observation shared for learning and discussion purposes. It is not financial advice. Please do your own research and consult a financial expert before taking any trade. If my analysis is wrong, I'll treat it as a learning opportunity and improve my understanding of the market.
Nifty - Expiry day analysis August 11Today, the price moved within the range of 24520 to 24620. The support at 24480 - 24520 and resistance at 24600 - 24620 is important in deciding the trend direction. The price has to show strength when breaking the range.
If we get a flat opening, buy above 24540 with the stop loss of 24480 for the targets 24580, 24620, 24680 and 24720.
If we have a small gap up, then buy above 24640 with the stop loss of 24580 for the targets 24680, 24720 and 24780.
Sell below 24440 with the stop loss of 24500 for the targets 24400, 24360 and 24300.
Expected expiry day range is 24400 to 24800.
Always do your analysis before taking any trade.
The Only 3 Questions That Have Always Mattered in TradingAfter Everything — All the Indicators, All the Analysis, All the Strategy — Only 3 Questions Have Ever Actually Mattered.
Strip away every indicator, every tool, every strategy. What remains is three questions. Every profitable trade answers all three. Every blown account ignored at least one. All of it — every single concept — distils into three questions you must answer before placing any trade or investment.
QUESTION 1: WHAT IS THE TREND?
This is not about finding the perfect entry. It is about orientation. It is about knowing which side of the market has the wind behind it.
Higher highs and higher lows = uptrend. You are looking for longs only.
Lower lows and lower highs = downtrend. You are looking for shorts or cash only.
Neither = ranging. You wait. No trend is not a trade.
The most expensive move in trading is fighting the trend because you believe in the asset, or because you are bored, or because you want to be early. The trend does not care what you believe. It will continue until it does not. Every indicator, every analysis method — their only real purpose is to help you answer this first question more precisely.
QUESTION 2: WHERE IS THE RISK?
This is your stop loss. Defined before entry. Non-negotiable.
Not "where do I think price will not go?" That is a hope.
Not "wherever I lose X rupees." That is arbitrary.
The correct answer is: the price at which the thesis for the trade is proven wrong.
You bought because you believed a support zone at ₹500–₹510 would hold. If price closes decisively below ₹498, the zone is broken. Your thesis is wrong. You exit. Full stop.
This question must be answered before the trade is placed. Once you are in a trade, your brain is compromised by loss aversion, anchoring, and confirmation bias. The stop was set by your rational, pre-trade self. Respect it.
Without a defined risk level, you do not have a trade. You have a bet.
QUESTION 3: IS THE REWARD WORTH THE RISK?
If your stop loss is ₹20 away from entry, your target must be at least ₹40 away. Minimum 1:2 risk-to-reward. Why? Because you will not win every trade. The best traders in the world have win rates of 40–55%. They are profitable because they make more on winners than they lose on losers.
A trader with a 45% win rate and 1:2 risk-reward is profitable. A trader with a 65% win rate and 1:0.5 risk-reward is losing money. If the chart does not offer a realistic 1:2 target before the next major resistance or support level — the trade does not qualify. Skip it. The market will give you another opportunity tomorrow.
The Complete Framework in One Sentence:
Trade with the trend. Risk only what the chart tells you to risk. Never take a trade where the potential gain is less than twice the potential loss.
Every profitable system ever developed — from Wyckoff to Jesse Livermore to modern quant strategies — is an elaboration of these three principles. Every blown account — from retail traders to $6 billion hedge fund collapses — violated at least one.
The questions have not changed. The answer is in asking them — consistently, before every trade, for the rest of your trading career.
If even one of these ideas changed how you see markets or protected your capital from a costly mistake, this work has served its purpose. Thank you for reading. 🙏
How to Build a Trading Plan Like a Professional📊 Building a Professional Trading Plan
Many traders focus only on finding the next trade. But professional traders focus on building a process.
A trading plan is not just a document.
It is a framework that tells you:
• What to trade
• When to trade
• Why to trade
• How much to risk
• How to manage the trade
• How to review performance
A good plan turns trading from random action into structured execution.
---------------------------------
📊 Why a Trading Plan Matters
Without a plan, traders often:
• Chase price
• Overtrade
• Enter late
• Increase quantity emotionally
• Ignore stop-losses
• Take random CE/PE trades
• Change strategy after a few losses
A trading plan helps reduce confusion. It gives you consistency, discipline and better decision-making.
---------------------------------
📊 What a Professional Trading Plan Should Include
A strong plan usually has:
• Market and instrument selection
• Trading style and setup
• Entry rules
• Stop-loss and invalidation
• Position sizing and risk management
• Trade management rules
• No-trade conditions
• Journal and review process
The plan should define both:
✅ When to trade
❌ When not to trade
---------------------------------
📊 Define Your Edge
Your plan should clearly answer:
• What setup do I trade?
• What confirms the setup?
• What invalidates it?
• Where will I enter?
For example, your edge may be based on:
• Breakout + retest
• VWAP continuation
• OI confluence
• Trend pullback
• Liquidity sweep reversal
If your setup is vague, your execution will also become vague.
---------------------------------
📊 Risk Rules Are the Core
A professional plan must define:
• Risk per trade
• Daily loss limit
• Maximum open positions
• Consecutive-loss rule
• Position sizing method
• Stop-loss logic
For example:
• Risk 0.5% per trade
• Stop after 3 consecutive losses
• No revenge trading
• No quantity increase to recover losses
Good trading plans protect capital first.
---------------------------------
📊 Trade Management Matters Too
The plan should also define:
• Where to book profit
• Whether to take partials
• When to trail stop-loss
• When to move to break-even
• When to exit if momentum fails
Do not decide these things emotionally after entering the trade. A professional trader plans the management before the entry.
---------------------------------
📊 Journal and Review
A trading plan is incomplete without review.
Track:
• Setup type
• Entry and exit
• Stop and target
• Result
• Screenshot
• Rule-following
• Emotional state
• Lesson learned
Review helps answer:
• Which setups work best?
• Where are the mistakes happening?
• Am I overtrading?
• Is my risk controlled?
The journal turns experience into improvement.
---------------------------------
📊 Conditions to Avoid Trading ⚠️
Your plan should also define no-trade conditions, such as:
• Flat VWAP
• Choppy market structure
• No clear bias
• Weak volume
• Overextended move
• No clear invalidation
• Emotional instability
• Daily loss limit already reached
Knowing when not to trade is also part of professionalism.
---------------------------------
📊 Simple Formula
Clear Setup + Defined Risk + Disciplined Execution + Journal Review
= Professional Trading Plan
But:
Random Entries + No Position Sizing + No Stop-Loss + No Review
= Unstructured Trading
---------------------------------
📊 Finally, the important point to note is:
A trading plan does not guarantee that every trade will work.
But it gives you something more important:
• Structure
• Consistency
• Risk control
• Long-term improvement
Do not trade based only on opinion. Trade based on a written process.
Because when emotions rise, the plan should guide the decision.
---------------------------------
Educational Purpose Only.
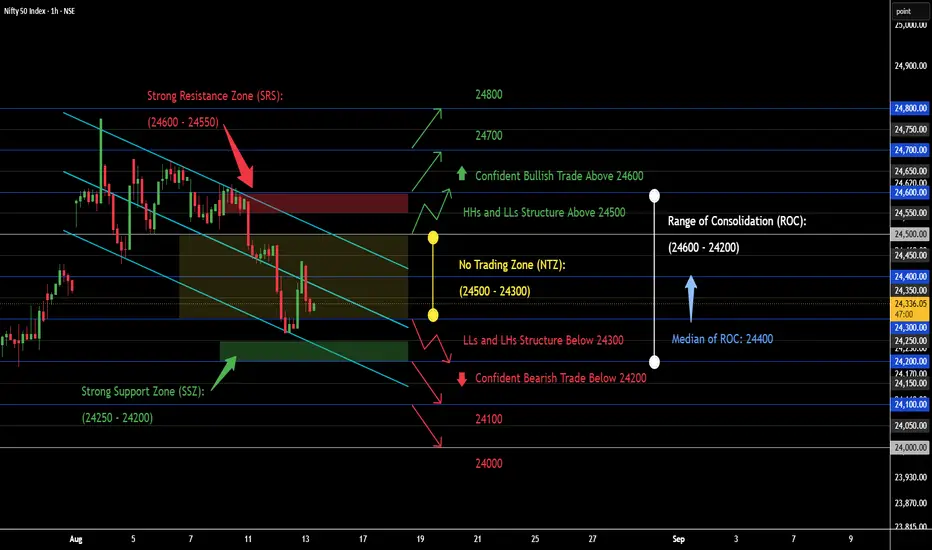
Nifty 50 Price Structure AnalysisProbable Price Structure and Scenario Analysis for the Nifty 50 NSE:NIFTY Index.
🟢 Bullish Scenario
Presently, there is no bullish scenario. Firstly, for a bullish setup, the price must form a higher-highs and lower-lows (HHs and LLs) structure above 24500. Then it needs to decisively break out above 24600. In this case, a bullish scenario would emerge. The probable confident Bullish targets above 24600 would be - 24700 and 24800.
🔴 Bearish Scenario
Presently, the price is in a bearish zone. Every up move should be doubted. The market structure is bearish. However, there is a strong support zone (SSZ) at (24250 - 24200). For a confident bearish setup, the price needs to form a lower-lows and lower-highs (LLs and LHs) structure below 24300 and decisively break down below 24200. In this case, a confident bearish scenario would emerge. The probable bearish targets below 24200 would be - 24100 and 24000.
🟡 No Trading Zone (NTZ): (24500 - 24300).
⏺ Range of Consolidation (ROC): (24600 - 24200).
Here, 24400 is the median of the ROC. The median works like a trading session sentiment evaluator. The price trading above the median would offer bullish sentiment, while the price trading below the median would trigger bearish sentiment within the ROC.
● Event
There is no major event or holiday. But geopolitical issues are omnipresent and beyond our control.
● Intraday, Weekly, and Monthly Bias
Establish bias with respect to the opening price (of the particular session - Intraday, Weekly, and Monthly). If the price sustains above the opening price, then don't think of shorting. Look for bullish trades only. On the contrary, if the price sustains below the opening price, then don't think of going long. Look for bearish trades in that case.
● Disclaimer + End Note
- All the analyses would fail in the case of a major gap up, gap down, or price structure anomaly. Thus, practice PRAGMATISM in the live session.
- Trade only if there is a set-up. Remember, not trading is an extension of the trading activity.
- Mark your points. Trade your points. Price is GOD. Anything can happen in the markets. Thus, trade what you see, not what you believe.
- Always PRACTICE RISK MANAGEMENT. Always PROTECT YOUR CAPITAL. Be RESPONSIBLE.
- Be Strategic. Be Courageous. Be Patient. Be Wise.
- Every day is a new day. Thus, do not carry the baggage of past successes or failures. Leave the gardens of winning and losing. Establish yourself in equanimity. Always think from a new perspective.
- Let the joy of trading drive your effectiveness, not greed or fear. Believe in Possibilities.
Happy Trading!
NIFTY 50 — Weekly Market Structure & Outlook
NIFTY 50 is showing an important technical development after failing to sustain the recent bullish structure.
The index formed a series of higher lows while respecting the rising trendline. However, today's price action has resulted in a breakdown below this trendline, bringing the short-term structure under pressure.
🔴 Bearish Scenario
If NIFTY remains below this zone and continues to face selling pressure:
24,200 → major downside objective
24,197 → projected/marked target on the chart
Key takeaway:
24,550 is the important decision zone. Until NIFTY reclaims this area, the breakdown remains valid and 24,200 is the key downside level to watch.
This is a technical market-structure view, not a trading recommendation.
Trading Road Mapoptions trading and institutional trading are important parts of modern financial markets. Options trading offers flexibility and opportunities for profit, while institutional trading provides liquidity and stability to the market. However, beginners should learn market concepts carefully before entering options trading because losses can occur quickly without proper knowledge and risk management. Education, practice, and disciplined investing are essential for long-term success in trading.
Nifty 50 Trade Plan - Pennant Formation [10.08.2026: Monday]Probable Scenario Analysis and Trade Plan for the Nifty 50 Index NSE:NIFTY for the 10th of August, 2026. The day is Monday.
🟢 Bullish Scenario
Presently, there is no bullish scenario. For a bullish scenario to emerge, the price has to sustain above level 24650 with an exclusive green marubozu candle. The probable weak bullish target above 24650 would be - 24700. There will be strong resistance at 24700. Next, if the price sustains above 24700, then a strong bullish move would emerge. The probable strong bullish targets above 24700 would be - 24750, 24800, and 24850.
🔴 Bearish Scenario
Presently, there is no bearish setup. The market is sideways. Level 24500 is strong support. A decisive breakdown below 24500 would trigger a bearish setup. There must be one exclusive red bearish candle formation below 24500. Also, the price must sustain below 24500 with a tendency to go lower. The probable bearish targets below 24500 would be - 24450, 24400, 24350, and 24300.
🟡 No Trading Zone (NTZ): (24650 - 24500).
⏺ Minor Range of Consolidation (Mi-ROC): (24700 - 24500).
Here, 24600 is the median of the Mi-ROC. The median works like a trading session sentiment evaluator. The price trading above the median would offer bullish sentiment, while the price trading below the median would trigger bearish sentiment within the ROC.
⏺ Major Range of Consolidation (Ma-ROC): (24800 - 24400).
Here, 24600 is the median of the Ma-ROC. The median works like a trading session sentiment evaluator. The price trading above the median would offer bullish sentiment, while the price trading below the median would trigger bearish sentiment within the ROC.
● Event
There is no major event or holiday. But geopolitical issues are omnipresent and beyond our control.
● Intraday, Weekly, and Monthly Bias
Establish bias with respect to the opening price (of the particular session - Intraday, Weekly, and Monthly). If the price sustains above the opening price, then don't think of shorting. Look for bullish trades only. On the contrary, if the price sustains below the opening price, then don't think of going long. Look for bearish trades in that case.
● Disclaimer + End Note
- All the analyses would fail in the case of a major gap up, gap down, or price structure anomaly. Thus, practice PRAGMATISM in the live session.
- Trade only if there is a set-up. Remember, not trading is an extension of the trading activity.
- Mark your points. Trade your points. Price is GOD. Anything can happen in the markets. Thus, trade what you see, not what you believe.
- Always PRACTICE RISK MANAGEMENT. Always PROTECT YOUR CAPITAL. Be RESPONSIBLE.
- Be Strategic. Be Courageous. Be Patient. Be Wise.
- Every day is a new day. Thus, do not carry the baggage of past successes or failures. Leave the gardens of winning and losing. Establish yourself in equanimity. Always think from a new perspective.
- Let the joy of trading drive your effectiveness, not greed or fear. Believe in Possibilities.
Happy Trading!
Trading Masterclass #2PCR (Put-Call Ratio) – Institutional Trading Strategy
What is PCR?
PCR = Put OI ÷ Call OI
It shows market sentiment of big players in indices like NIFTY 50.
Institutional Psychology
2. How Big Players Use PCR
Retail buys options randomly
Institutions control PCR zones to trap traders
👉 You follow PCR = You follow smart money
📈 PCR Levels (Game Changer)
3. Key Zones
PCR < 0.7 → Bearish sentiment (too many Calls) → ⚠️ Reversal possible
PCR 0.7 – 1 → Neutral zone
PCR > 1.2 → Bullish sentiment (too many Puts) → ⚠️ Reversal possible
NIFTY 50: Breakout Has Happened. But Has the Real Move Started?Nifty has broken out.
But the market still isn’t fully convinced.
That is probably the simplest way to describe the current setup.
The Nifty 50 gained 0.76% last week, closing at 24,570, and extended its winning streak to two weeks.
More importantly, the index has moved above the symmetrical triangle pattern that had been forming for months.
That sounds bullish.
But there is one small problem…
The breakout still needs confirmation.
Last week’s candle showed very little difference between where Nifty opened and closed, a sign that buyers and sellers were almost equally matched.
In simple words:
The market moved higher, but neither side has taken complete control yet.
So, what happens next?
There are a few levels that could decide the next move.
On the upside:
➡️ 24,600 to 24,700 | The first hurdle
If Nifty can break through this zone and hold above it, the next important challenge comes around:
➡️ 25,000 to 25,100
That could give the recent breakout much more credibility.
And if the market falls?
The first area to watch is:
➡️ 24,500 to 24,400
If that fails to hold, the stronger support zone comes in at:
➡️ 24,000 to 23,900
So for now, Nifty is sitting at a very interesting point.
The breakout has happened.
Now the market needs to prove it.
What could move the market this week?
Three things deserve attention:
1️⃣ Q1 FY27 earnings
The earnings season continues, with several major companies scheduled to report results. Strong or disappointing numbers could quickly change sentiment.
2️⃣ July inflation data
India’s July CPI inflation data is due on August 12, giving investors another important signal about the economy and interest rate outlook.
3️⃣ Geopolitical developments
Developments involving Iran, the Strait of Hormuz and broader regional tensions could also keep global risk sentiment volatile.
The takeaway for traders
This is not a market to chase aggressively.
The setup is promising, but confirmation matters more than excitement.
Watch 24,600 to 24,700 on the upside and 24,500 to 24,400 on the downside.
A decisive move beyond these levels could give us a clearer indication of where Nifty wants to go next.
Stop Taking Average Trades: Build an A+ Setup !📊 Building an A+ Setup Checklist
Many traders enter because the market is moving. But movement alone does not make a good setup.
An A+ setup appears when the most important parts of your trading system align together.
The purpose of a checklist is simple:
Take fewer random trades and focus on your best opportunities.
---------------------------------
📊 What Makes an A+ Setup?
A strong setup may include:
• Higher-time-frame bias
• Clear market structure
• Good entry location
• VWAP alignment
• Volume confirmation
• Momentum or displacement
• Clean breakout / retest
• Logical stop-loss
• Enough room to target
• Option premium or OI confirmation
One factor alone is not enough. A+ quality comes from alignment.
---------------------------------
📊 Start With Structure
Before entering, ask:
• Is the market trending or ranging?
• Are we making higher highs / higher lows?
• Are we making lower highs / lower lows?
• Has structure broken?
• Is price near a meaningful level?
A trade without clear structure should usually lose points.
---------------------------------
📊 Entry Location Matters
Better locations include:
• Support / resistance
• Breakout retest
• VWAP
• Demand / supply zone
• Previous day high or low
• Liquidity sweep area
Avoid entries:
• In the middle of a range
• After an extended candle
• Directly into resistance or support
A good setup from a poor location can become a poor trade.
---------------------------------
📊 Confirmation Builds Quality
For an A+ setup, look for confirmation such as:
✅ VWAP alignment
✅ Volume expansion
✅ Strong displacement
✅ Price acceptance
✅ Liquidity sweep + reclaim
✅ Clean retest
✅ Premium strength
The more independent factors agree, the stronger the setup becomes.
---------------------------------
📊 Always Check Room to Target
Before entering, ask:
“Where is the next major opposing level?”
A bullish setup may fail to offer good reward if resistance is directly above.
A bearish setup may have poor reward if support is too close.
Do not take a trade only because the entry looks good. Check whether the trade has room to work.
---------------------------------
📊 Risk Is Part of the Setup
An A+ setup must have:
• Clear invalidation
• Logical stop-loss
• Acceptable position size
• Good risk-to-reward
Do not tighten the stop only to improve R:R.
First find where the trade idea becomes invalid, then calculate the reward.
---------------------------------
📊 Option Traders Need One More Layer
For CE/PE trades, confirm both:
Underlying chart:
• Structure
• VWAP
• Volume
• Breakout / breakdown
• Invalidation
Option chart:
• Premium strength
• Liquidity
• Swing structure
• Volume
• No excessive premium extension
The underlying gives the idea. The premium confirms the instrument.
---------------------------------
📊 Use a Simple Scoring System
Example:
• Higher-time-frame bias
• Structure
• Entry location
• VWAP
• Volume
• Momentum
• Liquidity sweep
• Retest quality
• Room to target
• Option / OI confirmation
Possible classification:
85–100 = A+
70–84 = A
55–69 = B
Below 55 = Avoid
The exact weights should match your own strategy.
---------------------------------
📊 Mandatory Rules ⚠️
Some conditions should not be optional.
For example:
• Valid market regime
• Clear structure
• Defined invalidation
• Enough room to target
• No repeated failed setup
If a critical condition fails, skip the trade even if other confirmations look good.
---------------------------------
📊 Simple Formula
Structure + Location + Confirmation + Risk + Room to Target
= A+ Setup
But:
Momentum + FOMO + Poor Location + No Risk Plan
= Low-Quality Trade
---------------------------------
📊 Finally, the important point to note is:
An A+ checklist does not guarantee a winning trade.
It helps you consistently select your highest-quality opportunities.
Do not ask:
“Can this trade work?”
Ask:
“Does this trade meet the rules of my best setup?”
Trade selection is more important than trade frequency.
---------------------------------
Educational Purpose Only.
Trading Masterclass #1Institutional trading means trading like hedge funds, banks, prop firms, and professional desks. They do not trade based on emotions, random tips, or gambling. They use systems, probabilities, risk control, position sizing, discipline, and psychology.
Retail traders often lose because they focus only on “entry.” Institutions focus on:
Risk Management
Capital Protection
Position Sizing
Probability
Psychology
Trading AnalysisWhere is Nifty right now?
Nifty closed at 23,689 on Thursday May 14. After a brutal fall earlier this week (it touched ~23,300), it bounced back for 2 days in a row. So right now it's in a recovery mood — but it hasn't really "fixed" itself yet. Think of it like someone who had a fever, now feeling slightly better, but not fully healthy.
2 What's the wall above? (Resistance)
If Nifty tries to go up next week, it will hit a wall around 23,500–23,600 first. That's the first test. If it somehow crosses that, the BIGGER wall is at 23,900–24,000 — where all the major moving averages (50-day & 200-day) are sitting. Lots of sellers will be waiting there to book profits. So going above 24,000 next week? Unlikely unless something very positive happens.
3 What's the floor below? (Support)
If Nifty starts falling, the first safety net is around 23,300–23,150. This zone has held multiple times recently. If it breaks this level decisively (and stays below it), then the next stop could be 23,000 or even 22,900. That's the danger zone — but that's not the most likely scenario for next week.
Trading Road Mapoptions trading and institutional trading are important parts of modern financial markets. Options trading offers flexibility and opportunities for profit, while institutional trading provides liquidity and stability to the market. However, beginners should learn market concepts carefully before entering options trading because losses can occur quickly without proper knowledge and risk management. Education, practice, and disciplined investing are essential for long-term success in trading.
NIFTY : INTRADAY TRADING PLAN | 06-Aug-2026𝗧𝗶𝗺𝗲𝗳𝗿𝗮𝗺𝗲: 15 Min | 𝗟𝗮𝘀𝘁 𝗖𝗹𝗼𝘀𝗲: 24,624.65 (+52.40 / +0.21%) | 𝗥𝗮𝗻𝗴𝗲: 24,570.20 - 24,624.65
━━━━━━━━━━━━━━━━━━━━━━━━
🔎 𝗞𝗘𝗬 𝗟𝗘𝗩𝗘𝗟𝗦 𝗧𝗢 𝗪𝗔𝗧𝗖𝗛
🔴 𝗘𝘅𝘁𝗲𝗻𝗱𝗲𝗱 𝗥𝗲𝘀𝗶𝘀𝘁𝗮𝗻𝗰𝗲 — 𝟮𝟰,𝟵𝟭𝟰 (𝘥𝘢𝘴𝘩𝘦𝘥 / 𝘶𝘯𝘤𝘰𝘯𝘧𝘪𝘳𝘮𝘦𝘥 𝘴𝘸𝘪𝘯𝘨 𝘵𝘢𝘳𝘨𝘦𝘵)
🔴 𝗢𝗽𝗲𝗻𝗶𝗻𝗴 / 𝗟𝗮𝘀𝘁 𝗜𝗻𝘁𝗿𝗮𝗱𝗮𝘆 𝗥𝗲𝘀𝗶𝘀𝘁𝗮𝗻𝗰𝗲 — 𝟮𝟰,𝟳𝟯𝟭 (𝘔𝘢𝘫𝘰𝘳 𝘙𝘦𝘴𝘪𝘴𝘵𝘢𝘯𝘤𝘦)
🟠 𝗢𝗽𝗲𝗻𝗶𝗻𝗴 𝗥𝗲𝘀𝗶𝘀𝘁𝗮𝗻𝗰𝗲 / 𝗦𝘂𝗽𝗽𝗼𝗿𝘁 — 𝟮𝟰,𝟲𝟮𝟭 (𝘳𝘪𝘨𝘩𝘵 𝘢𝘵 𝘤𝘶𝘳𝘳𝘦𝘯𝘵 𝘱𝘳𝘪𝘤𝘦 - 𝘕𝘰-𝘛𝘳𝘢𝘥𝘦 𝘡𝘰𝘯𝘦)
🟢 𝗢𝗽𝗲𝗻𝗶𝗻𝗴 / 𝗟𝗮𝘀𝘁 𝗜𝗻𝘁𝗿𝗮𝗱𝗮𝘆 𝗦𝘂𝗽𝗽𝗼𝗿𝘁 — 𝟮𝟰,𝟰𝟲𝟮
🟢 𝗕𝘂𝘆𝗲𝗿'𝘀 𝗦𝘂𝗽𝗽𝗼𝗿𝘁 𝗭𝗼𝗻𝗲 — 𝟮𝟰,𝟮𝟴𝟮 - 𝟮𝟰,𝟯𝟭𝟱 (𝘥𝘦𝘦𝘱𝘦𝘳 𝘤𝘶𝘴𝘩𝘪𝘰𝘯, 𝘥𝘢𝘴𝘩𝘦𝘥 𝘣𝘰𝘶𝘯𝘤𝘦 𝘱𝘰𝘴𝘴𝘪𝘣𝘭𝘦)
📦 𝙊𝙥𝙚𝙣𝙞𝙣𝙜 𝙍𝙚𝙨𝙞𝙨𝙩𝙖𝙣𝙘𝙚/𝙎𝙪𝙥𝙥𝙤𝙧𝙩: 𝟮𝟰,𝟲𝟮𝟭 → sits right where price closed. Treat the immediate area around this level as a "𝗡𝗼 𝗧𝗿𝗮𝗱𝗲 𝗭𝗼𝗻𝗲" until a clear breakout or breakdown confirms.
━━━━━━━━━━━━━━━━━━━━━━━━
🧭 𝗢𝗩𝗘𝗥𝗔𝗟𝗟 𝗧𝗥𝗘𝗡𝗗 𝗩𝗜𝗘𝗪
Nifty has been choppy through the first days of August, swinging between roughly 24,460 and 24,730 without a decisive breakout in either direction, before closing at 𝟮𝟰,𝟲𝟮𝟰.𝟲𝟱 — right at the 𝟮𝟰,𝟲𝟮𝟭 𝗢𝗽𝗲𝗻𝗶𝗻𝗴 𝗹𝗲𝘃𝗲𝗹. The broader trend since late July remains constructive, but the recent sideways action shows the market pausing to digest its earlier gains.
📌 𝗕𝗶𝗮𝘀: Neutral 𝘢𝘳𝘰𝘶𝘯𝘥 the 24,621 pivot. A sustained break 𝗮𝗯𝗼𝘃𝗲 𝟮𝟰,𝟳𝟯𝟭 opens the path to 𝟮𝟰,𝟵𝟭𝟰 🟢, though this remains a 𝘥𝘢𝘴𝘩𝘦𝘥, 𝘶𝘯𝘤𝘰𝘯𝘧𝘪𝘳𝘮𝘦𝘥 extension. A sustained break 𝗯𝗲𝗹𝗼𝘄 𝟮𝟰,𝟰𝟲𝟮 exposes the 𝟮𝟰,𝟮𝟴𝟮-𝟮𝟰,𝟯𝟭𝟱 𝗕𝘂𝘆𝗲𝗿'𝘀 𝗦𝘂𝗽𝗽𝗼𝗿𝘁 𝗭𝗼𝗻𝗲 🔴, where a 𝘥𝘢𝘴𝘩𝘦𝘥 bounce is possible but not guaranteed.
━━━━━━━━━━━━━━━━━━━━━━━━
🎨 𝗨𝗡𝗗𝗘𝗥𝗦𝗧𝗔𝗡𝗗𝗜𝗡𝗚 𝗧𝗛𝗘 𝗖𝗛𝗔𝗥𝗧 𝗖𝗢𝗟𝗢𝗨𝗥 𝗖𝗢𝗗𝗘
🟢 𝗚𝗿𝗲𝗲𝗻 𝘇𝗶𝗴-𝘇𝗮𝗴 𝗹𝗶𝗻𝗲 → Bullish / Long bias path
🔴 𝗥𝗲𝗱 𝘇𝗶𝗴-𝘇𝗮𝗴 𝗹𝗶𝗻𝗲 → Bearish / Short bias path
🟠 𝗢𝗿𝗮𝗻𝗴𝗲 𝘇𝗶𝗴-𝘇𝗮𝗴 𝗹𝗶𝗻𝗲 → Sideways / 𝗡𝗼-𝗧𝗿𝗮𝗱𝗲 𝗭𝗼𝗻𝗲 — avoid directional bets here
〰️ 𝗗𝗮𝘀𝗵𝗲𝗱 𝗹𝗶𝗻𝗲 → Probable extension of trend — 𝘮𝘢𝘺 𝘰𝘳 𝘮𝘢𝘺 𝘯𝘰𝘵 𝘱𝘭𝘢𝘺 𝘰𝘶𝘵, treat as a roadmap, not a guarantee
━━━━━━━━━━━━━━━━━━━━━━━━
🌅 𝗦𝗖𝗘𝗡𝗔𝗥𝗜𝗢-𝗪𝗜𝗦𝗘 𝗣𝗟𝗔𝗡 (𝘎𝘢𝘱 𝘰𝘧 100+ 𝘱𝘰𝘪𝘯𝘵𝘴 𝘤𝘰𝘯𝘴𝘪𝘥𝘦𝘳𝘦𝘥 𝘢𝘴 𝘢 "𝘎𝘢𝘱")
𝟭️⃣ 𝗚𝗔𝗣-𝗨𝗣 𝗢𝗣𝗘𝗡𝗜𝗡𝗚 (𝘖𝘱𝘦𝘯 𝘢𝘣𝘰𝘷𝘦 ~24,725)
Opens near or above 𝟮𝟰,𝟳𝟯𝟭 and 𝗵𝗼𝗹𝗱𝘀 𝗮𝗯𝗼𝘃𝗲 𝗶𝘁 on retest → follow the 🟢 green path. Long on shallow dips, targeting 𝟮𝟰,𝟵𝟭𝟰 (𝘥𝘢𝘴𝘩𝘦𝘥, 𝘵𝘳𝘦𝘢𝘵 𝘢𝘴 𝘢 𝘱𝘰𝘴𝘴𝘪𝘣𝘭𝘦 𝘦𝘹𝘵𝘦𝘯𝘴𝘪𝘰𝘯 𝘰𝘯𝘭𝘺)
Slips back 𝗯𝗲𝗹𝗼𝘄 𝟮𝟰,𝟳𝟯𝟭 within 15-30 min → treat as an exhaustion gap; don't chase, wait for stabilization near 24,621
⚠️ 𝘈𝘷𝘰𝘪𝘥 𝘣𝘶𝘺𝘪𝘯𝘨 𝘯𝘢𝘬𝘦𝘥 𝘤𝘢𝘭𝘭𝘴 𝘳𝘪𝘨𝘩𝘵 𝘢𝘵 𝘵𝘩𝘦 𝘰𝘱𝘦𝘯 𝘰𝘯 𝘢 𝘨𝘢𝘱-𝘶𝘱 — 𝘱𝘳𝘦𝘮𝘪𝘶𝘮𝘴 𝘳𝘶𝘯 𝘩𝘰𝘵 𝘢𝘯𝘥 𝘤𝘢𝘯 𝘤𝘳𝘶𝘴𝘩 𝘧𝘢𝘴𝘵 𝘰𝘯𝘤𝘦 𝘵𝘩𝘦 𝘨𝘢𝘱 𝘨𝘦𝘵𝘴 𝘢𝘣𝘴𝘰𝘳𝘣𝘦𝘥
𝟮️⃣ 𝗙𝗟𝗔𝗧 𝗢𝗣𝗘𝗡𝗜𝗡𝗚 (𝘖𝘱𝘦𝘯 𝘸𝘪𝘵𝘩𝘪𝘯 ~24,525 - 24,725)
Opens near 𝟮𝟰,𝟲𝟮𝟭 → 🟠 No-Trade Zone, expect chop. Wait for a clean break with volume rather than guessing direction
Sustained close above 𝟮𝟰,𝟳𝟯𝟭 → 🟢 target 𝟮𝟰,𝟵𝟭𝟰
Sustained close below 𝟮𝟰,𝟰𝟲𝟮 → 🔴 target the 𝟮𝟰,𝟮𝟴𝟮-𝟮𝟰,𝟯𝟭𝟱 𝗕𝘂𝘆𝗲𝗿'𝘀 𝗦𝘂𝗽𝗽𝗼𝗿𝘁 𝗭𝗼𝗻𝗲
⚠️ 𝘖𝘯 𝘧𝘭𝘢𝘵/𝘳𝘢𝘯𝘨𝘦 𝘥𝘢𝘺𝘴, 𝘰𝘱𝘵𝘪𝘰𝘯 𝘴𝘦𝘭𝘭𝘦𝘳𝘴 (𝘴𝘱𝘳𝘦𝘢𝘥𝘴 / 𝘐𝘳𝘰𝘯 𝘊𝘰𝘯𝘥𝘰𝘳𝘴) 𝘵𝘦𝘯𝘥 𝘵𝘰 𝘩𝘢𝘷𝘦 𝘢𝘯 𝘦𝘥𝘨𝘦 𝘰𝘷𝘦𝘳 𝘯𝘢𝘪𝘷𝘦 𝘰𝘱𝘵𝘪𝘰𝘯 𝘣𝘶𝘺𝘦𝘳𝘴, 𝘴𝘪𝘯𝘤𝘦 𝘵𝘩𝘦𝘵𝘢 𝘸𝘰𝘳𝘬𝘴 𝘢𝘨𝘢𝘪𝘯𝘴𝘵 𝘭𝘰𝘯𝘨 𝘱𝘳𝘦𝘮𝘪𝘶𝘮 𝘪𝘯 𝘢 𝘤𝘩𝘰𝘱𝘱𝘪𝘯𝘨 𝘮𝘢𝘳𝘬𝘦𝘵
𝟯️⃣ 𝗚𝗔𝗣-𝗗𝗢𝗪𝗡 𝗢𝗣𝗘𝗡𝗜𝗡𝗚 (𝘖𝘱𝘦𝘯 𝘣𝘦𝘭𝘰𝘸 ~24,525)
Opens below 𝟮𝟰,𝟰𝟲𝟮 (Opening/Last Intraday Support) → follow 🔴 red path, short pullbacks towards 24,462-24,621, with the 𝟮𝟰,𝟮𝟴𝟮-𝟮𝟰,𝟯𝟭𝟱 𝗕𝘂𝘆𝗲𝗿'𝘀 𝗦𝘂𝗽𝗽𝗼𝗿𝘁 𝗭𝗼𝗻𝗲 as the next target
At the Buyer's Support Zone, watch for a 𝘥𝘢𝘴𝘩𝘦𝘥 reversal curl on the chart — a possible bounce, not a confirmed one; wait for a clear hold before considering long reversal trades
Quick reclaim back above 𝟮𝟰,𝟰𝟲𝟮 within the opening minutes → possible trap; wait for a hold before flipping bias
⚠️ 𝘋𝘰𝘯'𝘵 𝘴𝘩𝘰𝘳𝘵 𝘱𝘶𝘳𝘦𝘭𝘺 𝘰𝘧𝘧 𝘢 𝘸𝘦𝘢𝘬 𝘰𝘱𝘦𝘯𝘪𝘯𝘨 𝘤𝘢𝘯𝘥𝘭𝘦 — 𝘤𝘰𝘯𝘧𝘪𝘳𝘮 𝘸𝘪𝘵𝘩 𝘴𝘶𝘴𝘵𝘢𝘪𝘯𝘦𝘥 𝘵𝘳𝘢𝘥𝘦 𝘣𝘦𝘭𝘰𝘸 𝘴𝘶𝘱𝘱𝘰𝘳𝘵, 𝘯𝘰𝘵 𝘫𝘶𝘴𝘵 𝘵𝘩𝘦 𝘰𝘱𝘦𝘯𝘪𝘯𝘨 𝘵𝘪𝘤𝘬
━━━━━━━━━━━━━━━━━━━━━━━━
⚠️ 𝗥𝗜𝗦𝗞 𝗠𝗔𝗡𝗔𝗚𝗘𝗠𝗘𝗡𝗧 𝗧𝗜𝗣𝗦 𝗙𝗢𝗥 𝗢𝗣𝗧𝗜𝗢𝗡𝗦 𝗧𝗥𝗔𝗗𝗜𝗡𝗚
💰 𝗣𝗼𝘀𝗶𝘁𝗶𝗼𝗻 𝘀𝗶𝘇𝗶𝗻𝗴 𝗳𝗶𝗿𝘀𝘁 — risk only a small, predefined % of capital per trade
🛑 𝗦𝘁𝗼𝗽-𝗹𝗼𝘀𝘀 𝗶𝘀 𝗻𝗼𝗻-𝗻𝗲𝗴𝗼𝘁𝗶𝗮𝗯𝗹𝗲 — decide your SL before entering, not after watching the P&L
🎯 𝗕𝗼𝗼𝗸 𝗽𝗮𝗿𝘁𝗶𝗮𝗹 𝗽𝗿𝗼𝗳𝗶𝘁𝘀 at each level instead of holding for the "perfect" exit
⏳ 𝗥𝗲𝘀𝗽𝗲𝗰𝘁 𝘁𝗵𝗲𝘁𝗮 𝗱𝗲𝗰𝗮𝘆 — naked long options lose value fast in range-bound/no-trade zones; prefer spreads there
🚫 𝗡𝗲𝘃𝗲𝗿 𝗮𝘃𝗲𝗿𝗮𝗴𝗲 𝗹𝗼𝘀𝗶𝗻𝗴 𝗽𝗼𝘀𝗶𝘁𝗶𝗼𝗻𝘀 — adding to a losing option trade to "recover cost" is a fast way to blow up an account
📰 𝗧𝗿𝗮𝗰𝗸 𝗻𝗲𝘄𝘀/𝗲𝘃𝗲𝗻𝘁𝘀 — global cues and data releases can invalidate technical levels within seconds
🔁 𝗔𝘃𝗼𝗶𝗱 𝗼𝘃𝗲𝗿𝘁𝗿𝗮𝗱𝗶𝗻𝗴 — one clean setup with proper risk-reward beats five impulsive trades
🧊 𝗦𝘁𝗮𝘆 𝗲𝗺𝗼𝘁𝗶𝗼𝗻𝗮𝗹𝗹𝘆 𝗻𝗲𝘂𝘁𝗿𝗮𝗹 — dashed projections are possibilities, not certainties; trade what price confirms
━━━━━━━━━━━━━━━━━━━━━━━━
📝 𝗦𝗨𝗠𝗠𝗔𝗥𝗬 & 𝗖𝗢𝗡𝗖𝗟𝗨𝗦𝗜𝗢𝗡
Nifty closed at 𝟮𝟰,𝟲𝟮𝟰.𝟲𝟱, sitting right at the 𝟮𝟰,𝟲𝟮𝟭 𝗢𝗽𝗲𝗻𝗶𝗻𝗴 𝗹𝗲𝘃𝗲𝗹 after several sessions of choppy, range-bound action.
Gap-up + hold above 24,731 → target 𝟮𝟰,𝟵𝟭𝟰 🟢, dashed and unconfirmed
Flat open near 24,621 → 𝗽𝗮𝘁𝗶𝗲𝗻𝗰𝗲, not prediction 🟠
Gap-down + breakdown of 24,462 → target the 𝟮𝟰,𝟮𝟴𝟮-𝟮𝟰,𝟯𝟭𝟱 𝗕𝘂𝘆𝗲𝗿'𝘀 𝗦𝘂𝗽𝗽𝗼𝗿𝘁 𝗭𝗼𝗻𝗲 🔴, with a dashed bounce possible there
𝘛𝘳𝘢𝘥𝘦 𝘵𝘩𝘦 𝘳𝘦𝘢𝘤𝘵𝘪𝘰𝘯 𝘢𝘵 𝘵𝘩𝘦𝘴𝘦 𝘭𝘦𝘷𝘦𝘭𝘴, 𝘯𝘰𝘵 𝘵𝘩𝘦 𝘢𝘯𝘵𝘪𝘤𝘪𝘱𝘢𝘵𝘪𝘰𝘯 𝘰𝘧 𝘵𝘩𝘦𝘮 — 𝘭𝘦𝘵 𝘱𝘳𝘪𝘤𝘦 𝘤𝘰𝘯𝘧𝘪𝘳𝘮 𝘥𝘪𝘳𝘦𝘤𝘵𝘪𝘰𝘯 𝘣𝘦𝘧𝘰𝘳𝘦 𝘤𝘰𝘮𝘮𝘪𝘵𝘵𝘪𝘯𝘨 𝘤𝘢𝘱𝘪𝘵𝘢𝘭, 𝘢𝘯𝘥 𝘢𝘭𝘸𝘢𝘺𝘴 𝘴𝘪𝘻𝘦 𝘱𝘰𝘴𝘪𝘵𝘪𝘰𝘯𝘴 𝘬𝘦𝘦𝘱𝘪𝘯𝘨 𝘰𝘱𝘵𝘪𝘰𝘯𝘴-𝘴𝘱𝘦𝘤𝘪𝘧𝘪𝘤 𝘳𝘪𝘴𝘬𝘴 (𝘵𝘩𝘦𝘵𝘢, 𝘐𝘝, 𝘭𝘪𝘲𝘶𝘪𝘥𝘪𝘵𝘺) 𝘪𝘯 𝘮𝘪𝘯𝘥.
━━━━━━━━━━━━━━━━━━━━━━━━
⚠️ 𝗗𝗜𝗦𝗖𝗟𝗔𝗜𝗠𝗘𝗥
𝘐 𝘢𝘮 𝘯𝘰𝘵 𝘢 𝘚𝘌𝘉𝘐 𝘳𝘦𝘨𝘪𝘴𝘵𝘦𝘳𝘦𝘥 𝘢𝘯𝘢𝘭𝘺𝘴𝘵. 𝘛𝘩𝘪𝘴 𝘱𝘰𝘴𝘵 𝘪𝘴 𝘱𝘶𝘳𝘦𝘭𝘺 𝘧𝘰𝘳 𝘦𝘥𝘶𝘤𝘢𝘵𝘪𝘰𝘯𝘢𝘭 𝘢𝘯𝘥 𝘪𝘯𝘧𝘰𝘳𝘮𝘢𝘵𝘪𝘰𝘯𝘢𝘭 𝘱𝘶𝘳𝘱𝘰𝘴𝘦𝘴, 𝘣𝘢𝘴𝘦𝘥 𝘰𝘯 𝘵𝘦𝘤𝘩𝘯𝘪𝘤𝘢𝘭 𝘤𝘩𝘢𝘳𝘵 𝘰𝘣𝘴𝘦𝘳𝘷𝘢𝘵𝘪𝘰𝘯𝘴, 𝘢𝘯𝘥 𝘴𝘩𝘰𝘶𝘭𝘥 𝘯𝘰𝘵 𝘣𝘦 𝘤𝘰𝘯𝘴𝘵𝘳𝘶𝘦𝘥 𝘢𝘴 𝘪𝘯𝘷𝘦𝘴𝘵𝘮𝘦𝘯𝘵/𝘵𝘳𝘢𝘥𝘪𝘯𝘨 𝘢𝘥𝘷𝘪𝘤𝘦 𝘰𝘳 𝘢 𝘣𝘶𝘺/𝘴𝘦𝘭𝘭 𝘳𝘦𝘤𝘰𝘮𝘮𝘦𝘯𝘥𝘢𝘵𝘪𝘰𝘯. 𝘗𝘭𝘦𝘢𝘴𝘦 𝘤𝘰𝘯𝘴𝘶𝘭𝘵 𝘢 𝘳𝘦𝘨𝘪𝘴𝘵𝘦𝘳𝘦𝘥 𝘧𝘪𝘯𝘢𝘯𝘤𝘪𝘢𝘭 𝘢𝘥𝘷𝘪𝘴𝘰𝘳 𝘢𝘯𝘥 𝘥𝘰 𝘺𝘰𝘶𝘳 𝘰𝘸𝘯 𝘥𝘶𝘦 𝘥𝘪𝘭𝘪𝘨𝘦𝘯𝘤𝘦 𝘣𝘦𝘧𝘰𝘳𝘦 𝘮𝘢𝘬𝘪𝘯𝘨 𝘢𝘯𝘺 𝘵𝘳𝘢𝘥𝘪𝘯𝘨 𝘰𝘳 𝘪𝘯𝘷𝘦𝘴𝘵𝘮𝘦𝘯𝘵 𝘥𝘦𝘤𝘪𝘴𝘪𝘰𝘯𝘴. 𝘛𝘳𝘢𝘥𝘪𝘯𝘨 𝘪𝘯 𝘦𝘲𝘶𝘪𝘵𝘺, 𝘧𝘶𝘵𝘶𝘳𝘦𝘴, 𝘢𝘯𝘥 𝘰𝘱𝘵𝘪𝘰𝘯𝘴 𝘪𝘯𝘷𝘰𝘭𝘷𝘦𝘴 𝘴𝘶𝘣𝘴𝘵𝘢𝘯𝘵𝘪𝘢𝘭 𝘳𝘪𝘴𝘬 𝘰𝘧 𝘭𝘰𝘴𝘴.
#Nifty50 #NiftyTrading #StockMarket #OptionsTrading #TradingView
Nifty Intraday outlook for 11-08-2026📊 NIFTY 15-Min: Range Breakout Setup
NIFTY is consolidating between a clear resistance and support zone.
Resistance:
• 24,630
Support:
• 24,510
Price is currently trading inside the range, so the better approach is to wait for confirmation rather than predict the next move.
---------------------------------
📈 Bullish Plan
Above 24,630 with candle-close confirmation:
Targets:
• 24,670
• 24,700
• 24,750
• 24,800
A pullback toward 24,540–24,510 can also offer a bullish setup if buyers clearly defend the zone.
---------------------------------
📉 Bearish Plan
Below 24,510 with confirmation:
Targets:
• 24,480
• 24,440
• 24,380
• 24,340
Prefer breakdown + failed retest instead of chasing the first red candle.
---------------------------------
🌍 Market Context
Global markets are cautious ahead of US inflation data.
Brent crude has risen toward $88 as US-Iran negotiations remain uncertain, which is an important macro risk for India.
Domestic sentiment remains range-bound with earnings and global cues likely to drive intraday movement.
---------------------------------
✅ Final View
Above 24,630 → bullish continuation
Hold 24,512 → recovery structure remains intact
Below 24,512 → sellers gain control
Inside 24,510–24,630 → WAIT
Educational analysis only. Trade with confirmation and disciplined risk management.
NIfty Spot Weekly DOJIThe price recently suffered a severe bearish flush that aggressively broke through the primary ascending trendline.
This liquidation spike found precise historical support at the secondary lower channel line near 21,721.90.
Following this exhaustion bottom, a strong V-shaped recovery materialized, driving the price back inside the primary structure. This rapid reclaim invalidates the initial breakdown, identifying it as a textbook "bear trap" designed to wash out leveraged longs.
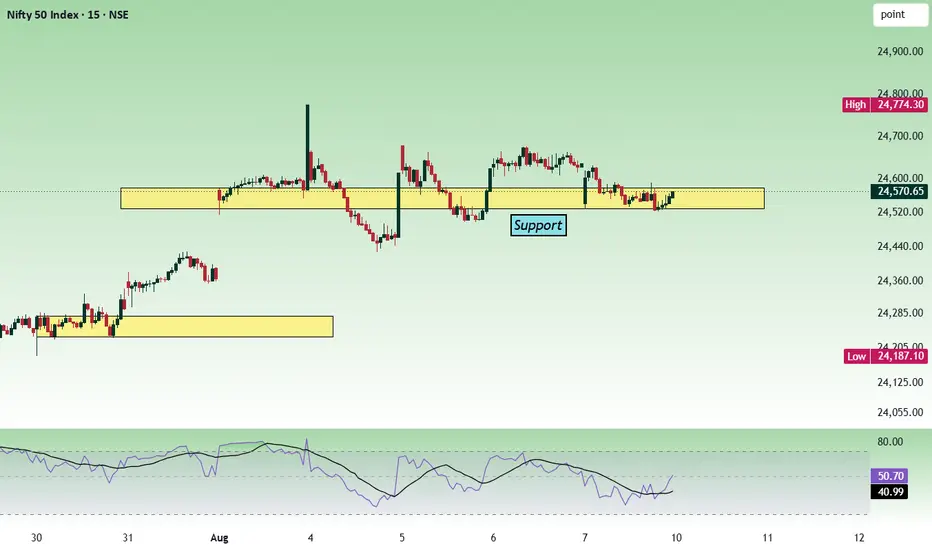
Local Trajectory & Key LevelsCurrently, the asset is experiencing a short-term bullish consolidation, pressing upward toward the apex of the larger triangle structure.
The immediate price is hovering near 24,570.65, showing a minor localized retracement after testing the overhead resistance cluster.
To sustain this upward momentum, buyers must secure a clean breakout above the macro descending resistance line, currently intersecting around 24,774.30 and 25,220.50. Failure to clear this upper boundary will likely trigger a rejection, sending the price back down to retest the localized horizontal support levels mapped between 24,328.10 and 23,606.30.
For the week Aug 10-14 (2026)
24642.00 will be KEY MAKE or BREAK LEVEL.
Like Share and Follow
Nifty Intraday Outlook for 12-08-2026📊 NIFTY 15-Min: Broken Support Now Becomes the Key Resistance
NIFTY has broken below the earlier 24,510 support and is now trying to stabilise near 24,438–24,470.
GIFT Nifty indicates a mildly positive opening, which may bring price directly back toward the broken support zone.
---------------------------------
📌 Important Levels
Resistance:
• 24,510
• 24,560
• 24,630
Upside Targets:
• 24,600
• 24,630
• 24,700
Support:
• 24,440
Downside Targets:
• 24,400
• 24,340
---------------------------------
📉 Bearish Plan
If NIFTY rejects from 24,510–24,560:
• PE after bearish confirmation
• Targets: 24,470 / 24,440 / 24,390
Below 24,440:
• Bearish continuation
• Targets: 24,400 / 24,340
---------------------------------
📈 Bullish Plan
CE only after NIFTY reclaims and sustains above 24,558.
Targets:
• 24,600
• 24,630
• 24,700
A simple gap-up is not enough — price must hold above the broken resistance.
---------------------------------
🌍 Market Context
Indian equities may open mildly higher, supported by positive earnings and continued foreign buying.
However, Brent crude has moved close to $90 as Middle East shipping and Iran-related risks increase.
US inflation data is also due, which can keep global markets cautious.
---------------------------------
✅ Final View
Above 24,560 → recovery strengthens
Below 24,510 → sellers still have an advantage
Below 24,440 → bearish continuation
Inside 24,470–24,510 → WAIT
Educational analysis only. Trade with confirmation and disciplined risk management.
#NIFTY Intraday Support and Resistance Levels - 11/08/2026Nifty is expected to open flat, with the index continuing to trade within the existing consolidation range. There are no major changes in the key levels, with 24,550–24,450 acting as the immediate support zone and 24,700–24,750 as the important resistance zone.
If Nifty sustains above 24,750, buying can be considered with targets of 24,850, 24,900 and 24,950+. On the downside, a break below 24,450 can trigger selling towards 24,350, 24,300 and 24,250.
Overall, the market is likely to remain consolidated, so traders should avoid aggressive positions inside the range and wait for a decisive breakout above 24,750 or breakdown below 24,450 for the next directional move.