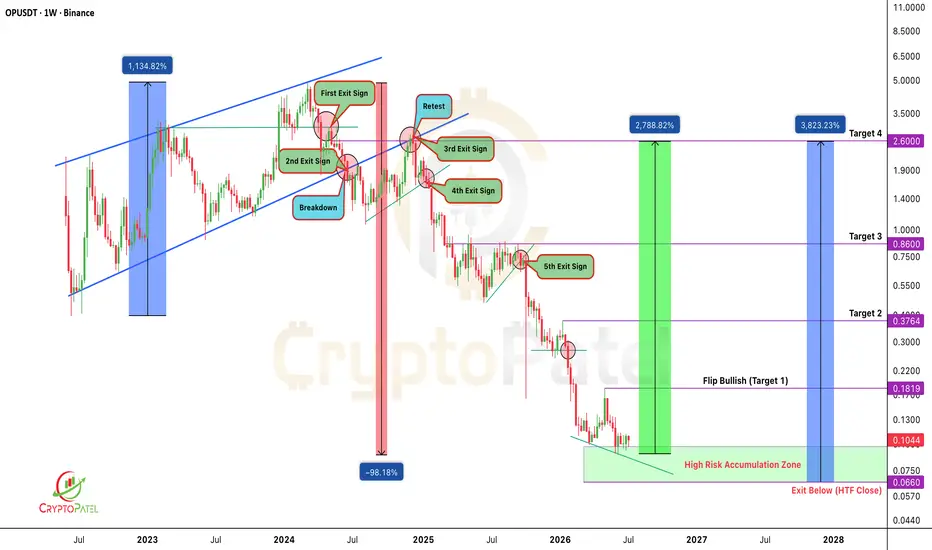
$OP DOWN -98% FROM ATH: IS THIS HTF ACCUMULATION BEFORE A 25X ?TSE:OP CRASHED -98% FROM ITS PEAK: IS THIS THE HTF ACCUMULATION BEFORE A 25X COMEBACK?
#OP Has Entered A Multi-Year HTF Accumulation Zone After Completing One Of The Deepest Corrections Among Large-Cap Altcoins.
The Last Time Similar HTF Structures Formed:
2022-2023: +700%+ Explosive Recovery Acr
Optimism/USD Tether Spot
No trades
No trades
Compare with OPU/SDT
Open interest
Open interest
Price
Liquidations
Long
Short
Price
$OP: Ethereum’s Superchain Infrastructure | Crashed 97% | 40X ?TSE:OP : Ethereum’s Superchain Infrastructure | Crashed 97% | 4,000% Upside Potential
#OP was Trading Inside A Multi-Year Descending Channel On The Weekly Chart Since The Cycle High Near $5. After A -97.76% Correction, Price Currently Trading around $0.12 & This is Key Accumulation Zone Showing Ear
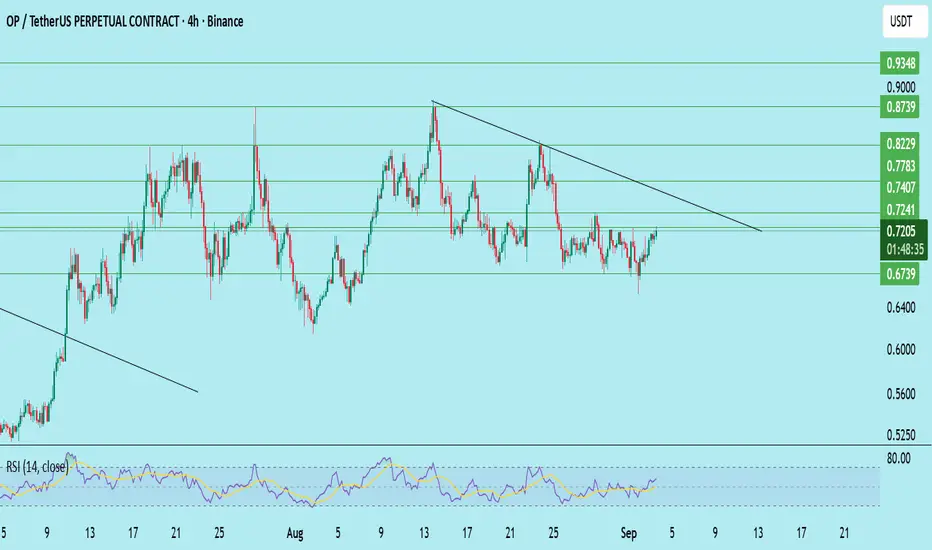
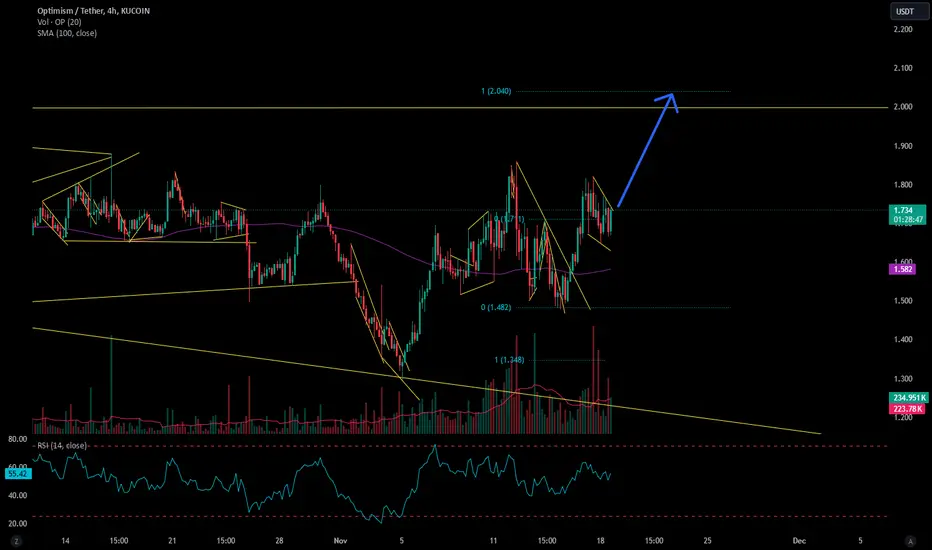
OP/USDT – Potential Breakout SetupOP has been consolidating under a descending trendline since mid-August, but buyers are stepping in around the 0.673 support zone. Recent 4H candles show strength with higher lows forming, while RSI (~58) signals building momentum without being overbought.
Technical Observations:
Descending trendli
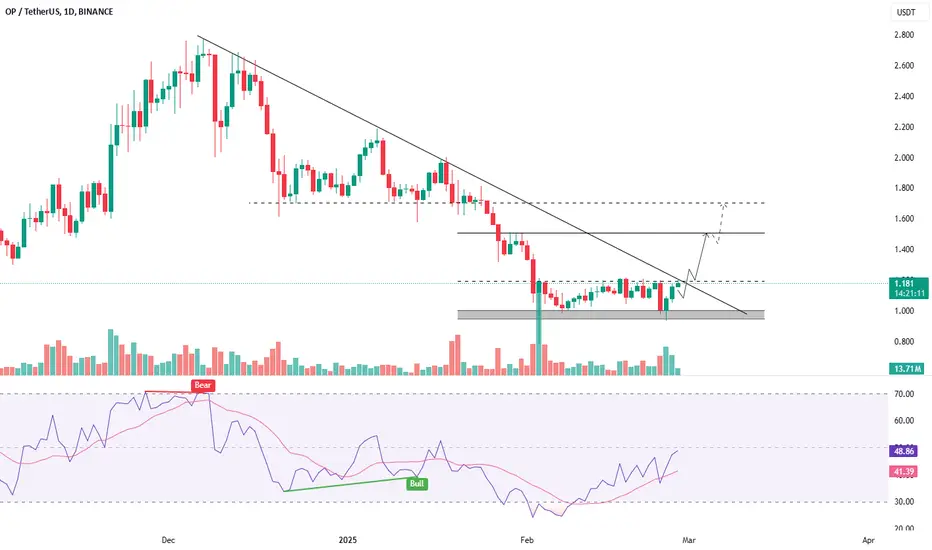
OPUSDT - BULLISH BIAS & POTENTIAL TREND REVERSALSymbol - OPUSDT
CMP - 1.175
OPUSDT is exhibiting positive momentum relative to Bitcoin's performance over the past two days. The asset is currently in a phase of consolidation, testing trend resistance.
The primary factor hindering the onset of an altcoin season is Bitcoin's dominant presence in
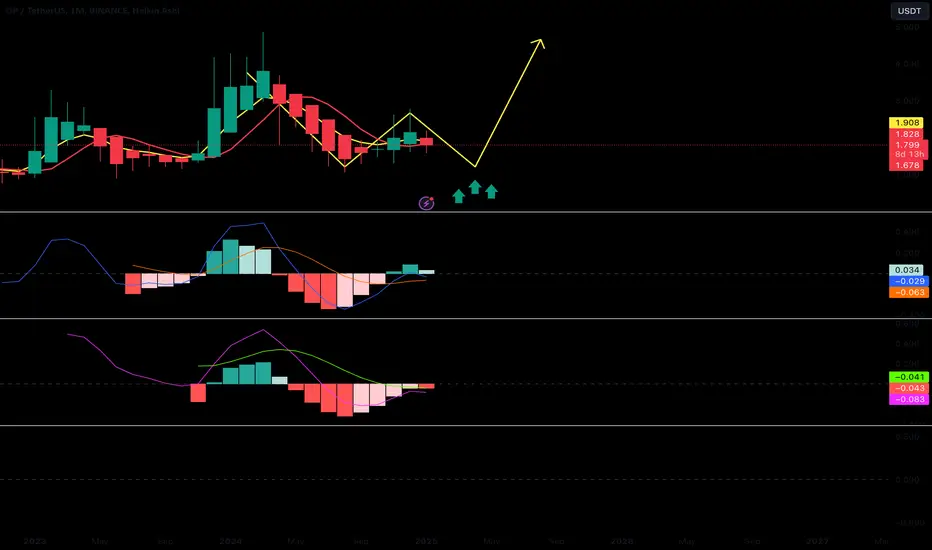
Prepare to BUY Spot OPUSDT (M Cycle)🚀 Prepare to BUY Spot OPUSDT (M Cycle)
🌟 2025 will be a major breakout year for OPUSDT with the upcoming M cycle – A golden opportunity for long-term gains! 🌟
🌍 Market Overview:
The current price decline of OPUSDT is a part of its accumulation phase, setting the stage for a significant M cycle r
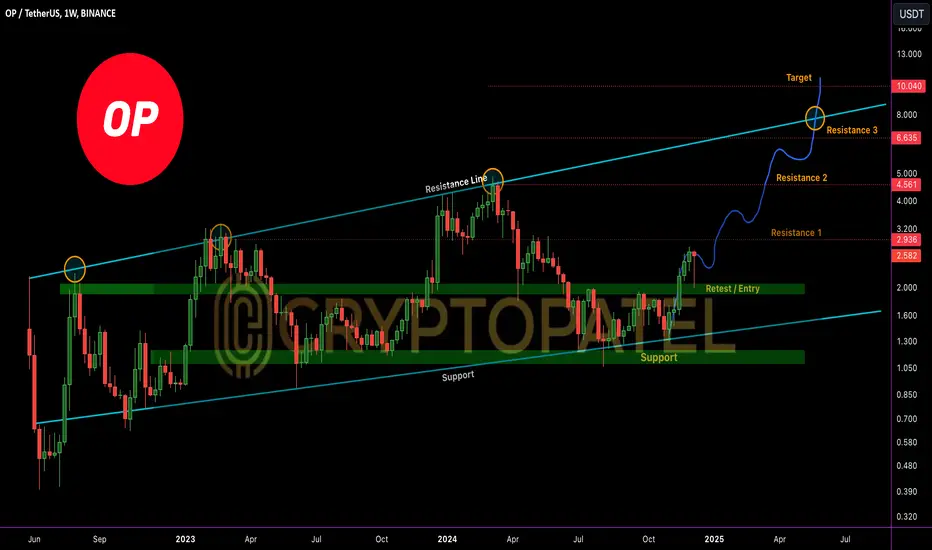
OP/USDT Technical Analysis - Potential Bullish Trend Ahead OP/USDT Technical Analysis - Potential Bullish Trend Ahead
The OP/USDT chart shows promising upward potential. Currently, NASDAQ:OP is holding at a key support zone near $2.10, with a potential retest and entry point around this level.
Resistance Levels: $2.94/$4.56/$6.64
High Risk Target: $10
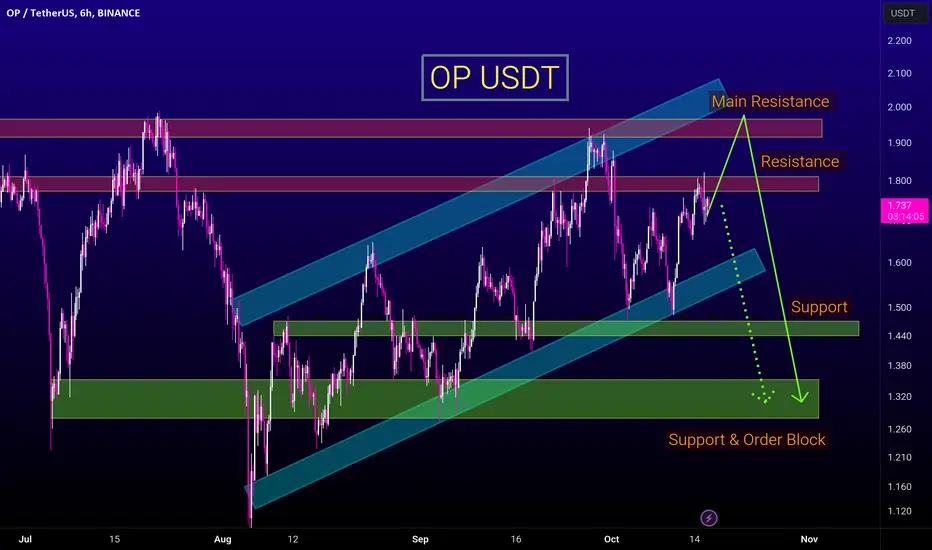
OP FACES MAIN RESISTANCE : TIME FOR PULLBACK NASDAQ:OP is bouncing from a bullish trend, boosted by an order block (OB) zone and an unfilled CME gap lurking below.
Short-term, look for NASDAQ:OP to test support near 1.48. If the CME gap fills, a drop to around 1.32 is possible. On a bullish note, if momentum holds, we might see a rise back
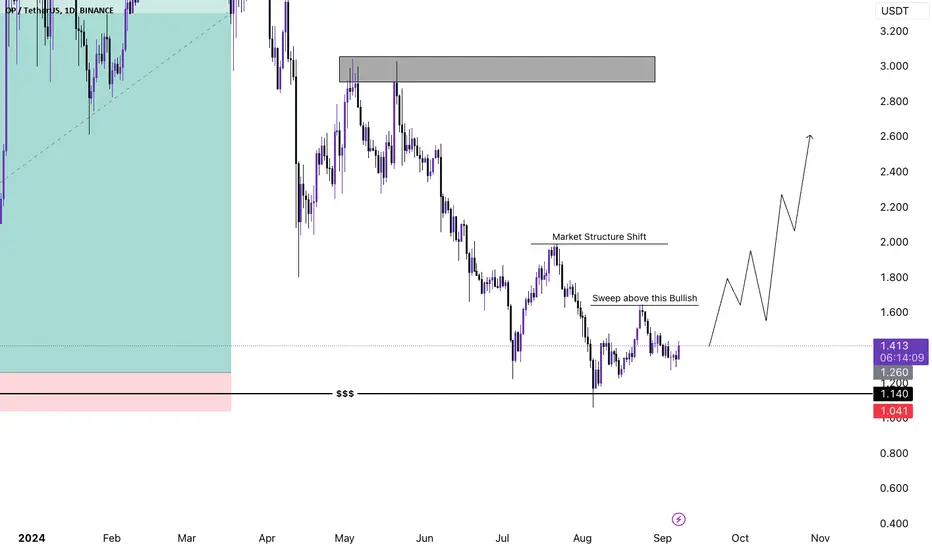
OP Swing Long Market Structure Shift Analysis - OP is currently trading at 1.4$
- OP is also carrying the best structure when it comes to Altcoins
- It's back to its previous yearly base where we saw the expansionary move from
- It's going to be very important to see whether OP fades away and falls below this zone or maintains its yearly area
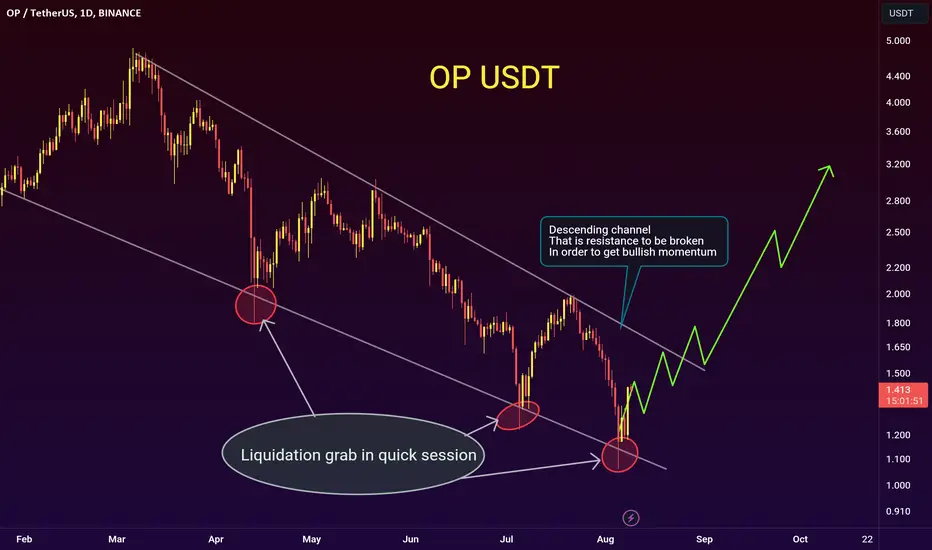
Optimism (OP) CHART ANALYSIS OP is showing bullish tendency as it is trying to recover from market crash in start of August. It is forming a falling wedge pattern, which is well known bullish sign.
Short term Target could be 2.00 region, if bullish momentum continues we could expect 3.5, and mid term would be 5.00.
See all ideas
Summarizing what the indicators are suggesting.
Oscillators
Neutral
Oscillators
Neutral
Summary
Neutral
Summary
Neutral
Summary
Neutral
Moving Averages
Neutral
Moving Averages
Neutral
Displays a symbol's price movements over previous years to identify recurring trends.
Frequently asked questions
The current price of Optimism/USD Tether Spot (OP) is 0.1118 USDT — it has fallen −1.43% in the past 24 hours. Try placing this info into the context by checking out what coins are also gaining and losing at the moment and seeing OP price chart.
Optimism/USD Tether Spot price has fallen by −11.26% over the last week, its month performance shows a −23.30% decrease, and as for the last year, Optimism/USD Tether Spot has decreased by −75.21%. See more dynamics on OP price chart.
Keep track of coins' changes with our Crypto Coins Heatmap.
Optimism/USD Tether Spot (OP) reached its highest price on Mar 6, 2024 — it amounted to 4.8620 USDT. Find more insights on the OP price chart.
See the list of crypto gainers and choose what best fits your strategy.
Optimism/USD Tether Spot (OP) reached the lowest price of 0.0806 USDT on Aug 18, 2026. View more Optimism/USD Tether Spot dynamics on the price chart.
See the list of crypto losers to find unexpected opportunities.
The safest choice when buying OP is to go to a well-known crypto exchange. Some of the popular names are Binance, Coinbase, Kraken. But you'll have to find a reliable broker and create an account first. You can trade OP right from TradingView charts — just choose a broker and connect to your account.
Crypto markets are famous for their volatility, so one should study all the available stats before adding crypto assets to their portfolio. Very often it's technical analysis that comes in handy. We prepared technical ratings for Optimism/USD Tether Spot (OP): today its technical analysis shows the sell signal, and according to the 1 week rating OP shows the sell signal. And you'd better dig deeper and study 1 month rating too — it's sell. Find inspiration in Optimism/USD Tether Spot trading ideas and keep track of what's moving crypto markets with our crypto news feed.
Optimism/USD Tether Spot (OP) is just as reliable as any other crypto asset — this corner of the world market is highly volatile. Today, for instance, Optimism/USD Tether Spot is estimated as 0.45% volatile. The only thing it means is that you must prepare and examine all available information before making a decision.
You can discuss Optimism/USD Tether Spot (OP) with other users in our public chats, Minds or in the comments to Ideas.