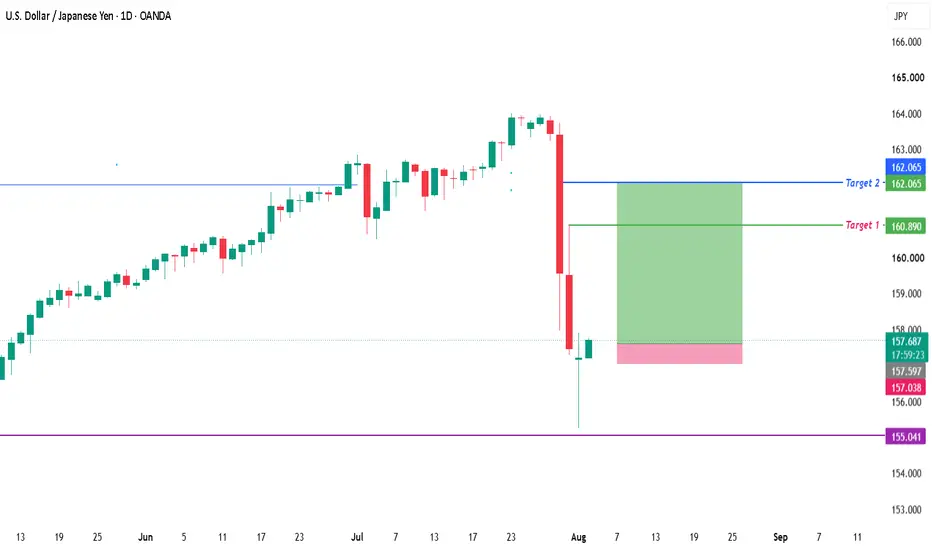
USD/JPY Eyes Rate Hike RallyThe U.S. Dollar is gaining momentum against the Yen as markets anticipate a potential Fed rate hike. On the daily chart, price has broken above 157.70, holding firm above support at 155.04.
Targets: Upside projections point to 160.89 (Target 1) and 162.06 (Target 2).
Stop‑Loss: Risk is managed ne
U.S. Dollar / Japanese Yen
No trades
No trades
Compare with USD to JPY
Details
Also known as trading the “gopher” the USDJPY pair is one of the most traded pairs in the world. The value of these currencies when compared to each other is affected by the interest rate differential between the Federal Reserve and the Bank of Japan.
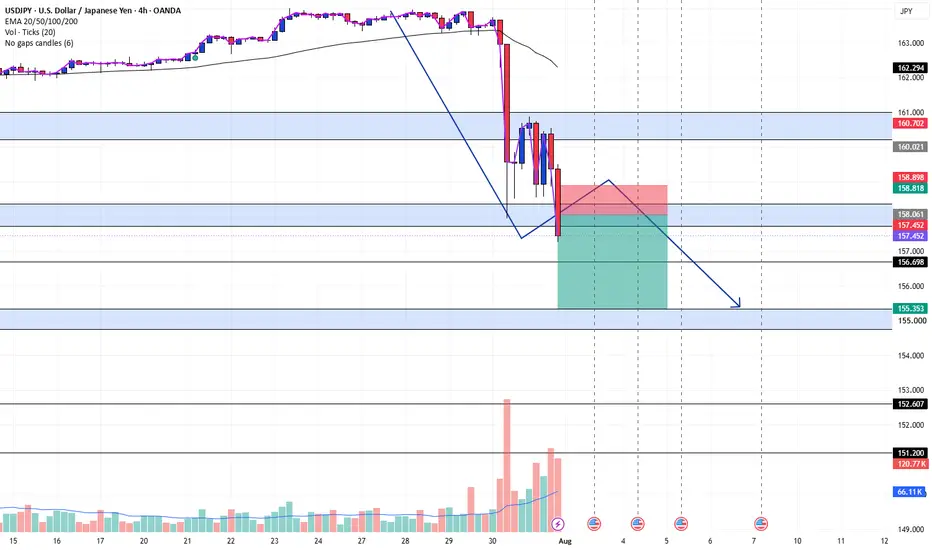
USDJPY BEARISH TRAPUSDJPY Weekly Bearish Setup – Rejection From Major Resistance
USDJPY experienced a strong rejection after sweeping liquidity above the 163.00–164.00 area. Price has now dropped back below the major weekly resistance zone around 158.90–160.70, showing that sellers are regaining control.
The current
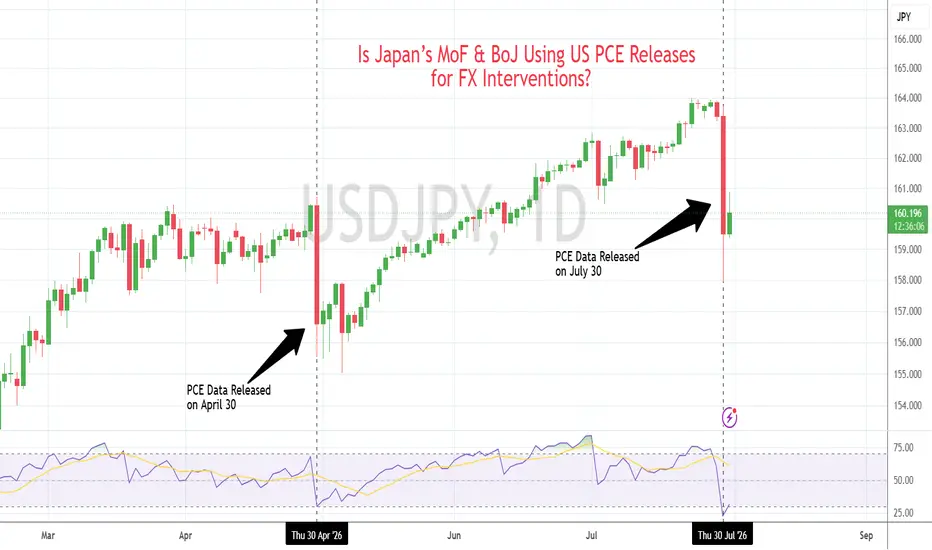
Japan's "PCE Day" Intervention Strategy Take a close look at the daily chart of USDJPY.
The massive red candles on April 30 and July 30 highlights a clear, tactical correlation.
The Action: Sharp Japanese Yen-buying interventions to suppress a runaway USDJPY exchange rate.
The Funding: Tokyo funding the operation by bulk-purchasi
USDJPY has finally made a topUSDJPY started wave C up in 2016. I have been trying to map the five-wave advance since. Wave 4 was a long, winding triangle that wasted a lot of time. At points it looked like an ED. Now, finally, we have a 5th wave coming out of it that has ended in the Fibonacci cluster for a truncated wave 5 of
USDJPY Forms a Clear Triple Top PatternUSDJPY has formed three distinct highs around the same resistance area, creating a clear triple top structure. Each attempt to move higher was rejected, showing that buyers are losing momentum while sellers continue to defend the upper zone.
Price is now approaching the support beneath the pattern.
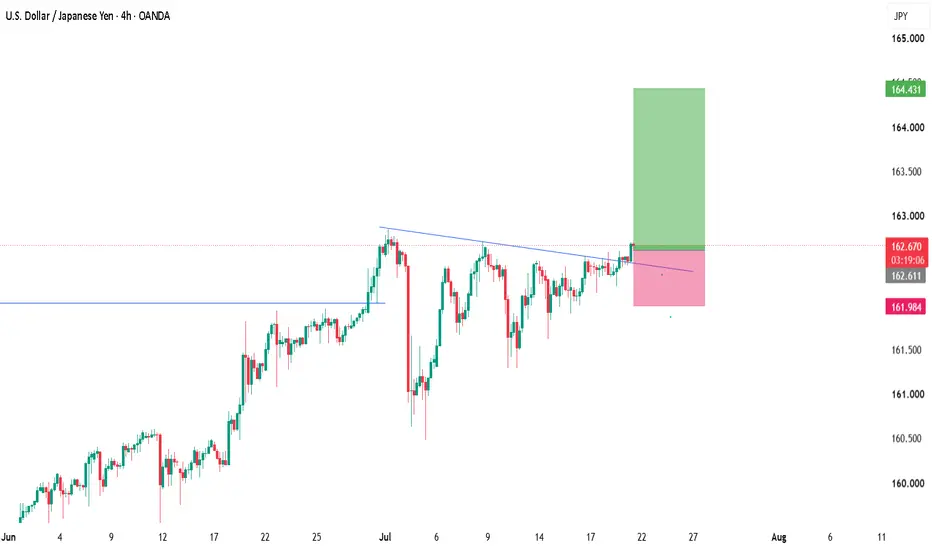
USDJPY: Likely to Continue HigherUSDJPY had been building strong bullish momentum before slowing into an ascending base beneath resistance.
The key development is that price has now broken above that ceiling with a decisive bullish impulse, suggesting buyers have regained control after the period of consolidation.
From here, I'm
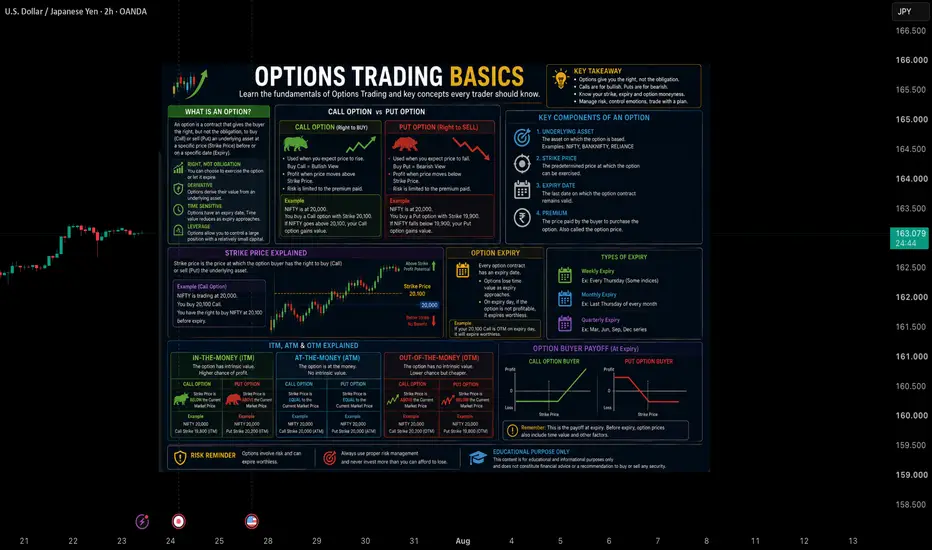
Options Trading Basics📌 Overview
Options Trading is a type of derivative trading where the value of an option contract is based on an underlying asset such as an index, stock, or commodity. This educational infographic explains the fundamental concepts of options trading, including Call Options, Put Options, Strike Pri
Ninja Projections - A Collaboration of Technical And Quants1. The quantitative analysis
- 3 legs appear in the recent bull phase
- each leg constitutes a rise and then a relatively smaller fall
- the ratio of fall to rise for the first 2 legs is between 68%-70%
Now we are expecting a similar fall in USDJPY - that will make the ratio of fall to rise near 7
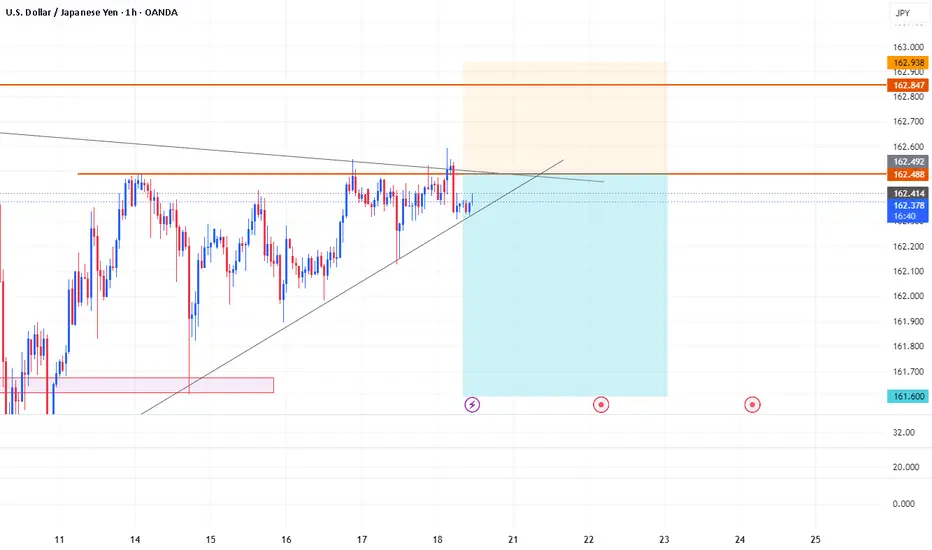
USDJPY | Short Setup | Resistance ConfluenceTrade Levels
Entry: 162.495
Stop Loss: 162.938
Take Profit: 161.600
Risk:Reward: ~1:2
Technical Analysis
Price is testing a well-defined horizontal resistance.
A descending trendline is acting as dynamic resistance.
The setup forms a confluence zone, where multiple technical factors align.
Expectin
See all ideas
Summarizing what the indicators are suggesting.
Oscillators
Neutral
SellBuy
Strong sellStrong buy
Strong sellSellNeutralBuyStrong buy
Oscillators
Neutral
SellBuy
Strong sellStrong buy
Strong sellSellNeutralBuyStrong buy
Summary
Neutral
SellBuy
Strong sellStrong buy
Strong sellSellNeutralBuyStrong buy
Summary
Neutral
SellBuy
Strong sellStrong buy
Strong sellSellNeutralBuyStrong buy
Summary
Neutral
SellBuy
Strong sellStrong buy
Strong sellSellNeutralBuyStrong buy
Moving Averages
Neutral
SellBuy
Strong sellStrong buy
Strong sellSellNeutralBuyStrong buy
Moving Averages
Neutral
SellBuy
Strong sellStrong buy
Strong sellSellNeutralBuyStrong buy
Displays a symbol's price movements over previous years to identify recurring trends.
Frequently asked questions
The current rate of USDJPY is 159.310 JPY — it has decreased by −0.13% in the past 24 hours. See more of USDJPY rate dynamics on the detailed chart.
The value of the USDJPY pair is quoted as 1 USD per x JPY. For example, if the pair is trading at 1.50, it means it takes 1.5 JPY to buy 1 USD.
The term volatility describes the risk related to the changes in an asset's value. USDJPY has the volatility rating of 0.58%. Track all currencies' changes with our live Forex Heatmap and prepare for markets volatility.
The USDJPY showed a 0.56% rise over the past week, the month change is a −1.78% fall, and over the last year it has increased by 7.87%. Track live rate changes on the USDJPY chart.
Learn how you can make money on rate changes in numerous trading ideas created by our community.
USDJPY is a major currency pair, i.e. a popular currency paired with USD.
Currencies are usually traded through forex brokers — choose the one that suits your needs and go ahead. You can trade USDJPY right from TradingView charts — just log in to you broker account. Check out the list of our integrated brokers and find the best one for your needs and strategy.
When deciding to buy or sell currency one should keep in mind many factors including current geopolitical situation, interest rates, and other. But before plunging into a deep research, you can start with USDJPY technical analysis. The technical rating for the pair is sell today, but don't forget that markets can be very unstable, so don't stop here. According to our 1 week rating the USDJPY shows the buy signal, and 1 month rating is buy. See more of USDJPY technicals for a more comprehensive analysis.