DJI: Structural Distribution at Resistance — Target 52,225.00⚡ DJI: Structural Distribution at Resistance — Target 52,225.00 🚨
• Ticker: TVC:DJI (Dow Jones Industrial Average Index)
• Timeframe: 15-Minute (15m)
• The Thesis: Spotting the institutional distribution block before the retail herd gets trapped in the vertical momentum.
🔍 THE MARKET MATRIX
• 🔴
US30 | UPCOMING SELL SETUPUS30 | UPCOMING SELL SETUP
Status: Waiting for a liquidity sweep and rejection at daily resistance before entering.
Entry: 53,705.4
Stop Loss: 53,864.9
Take Profit: 52,899.3
RR: 1:5
Risk: 1%
Trade Analysis
Price is currently bullish and trading above the Daily 20MA. We are waiting for a rejectio
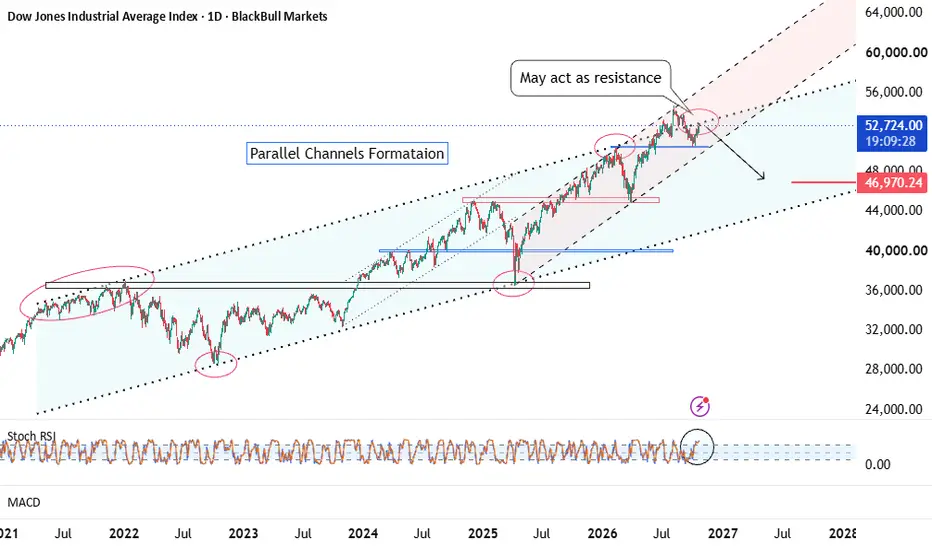
US 30 - What seems ahead?US30 Cmp 52700
All important levels are marked on the chart. The index is travelling in a new rising parallel channel (red one). This time, reaching the upper edge of blue channel (around 52800).
Stochastic RSI shows likely reversal too.
If the price is rejected from the present level, it may go int
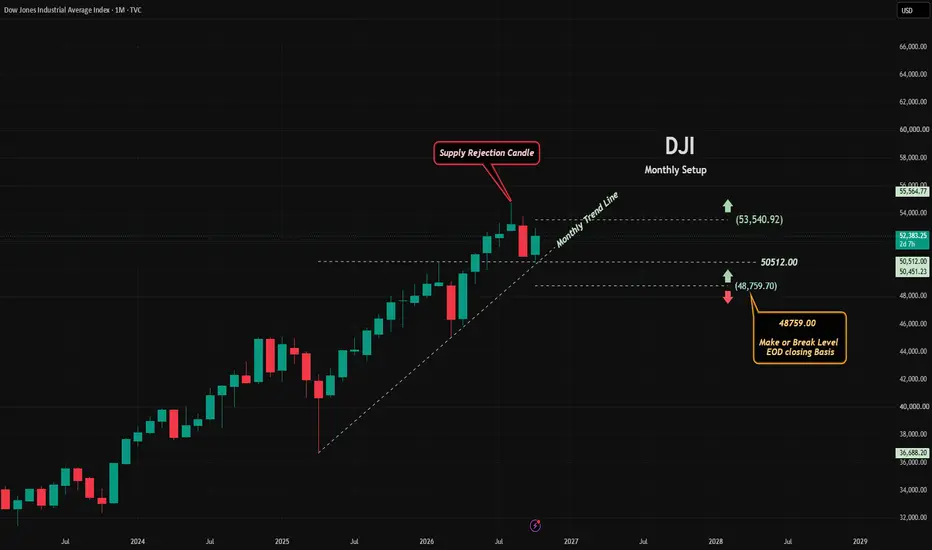
Dow Jones Monthly Setup: The 5,000-Point Trading Range Unlocked
Asset & Timeframe: Dow Jones Industrial Average Index (DJI) – 1M (Monthly Setup), TVC.
Last Traded Level: 52,383.25 (+0.03%).
Market Context: The DJI is operating within a powerful, multi-year ascending macro trend, clearly defined by the "Monthly Trend Line" originating from the stru
US30 Long Trading Idea Primary Setup:
Look for price to retrace into the upper channel resistance, ideally aligning with previous supply zones.
Watch for rejection candles, liquidity sweeps, or divergence signals.
Enter short positions targeting:
Mid‑channel equilibrium
Lower channel support
Breakout continuation if
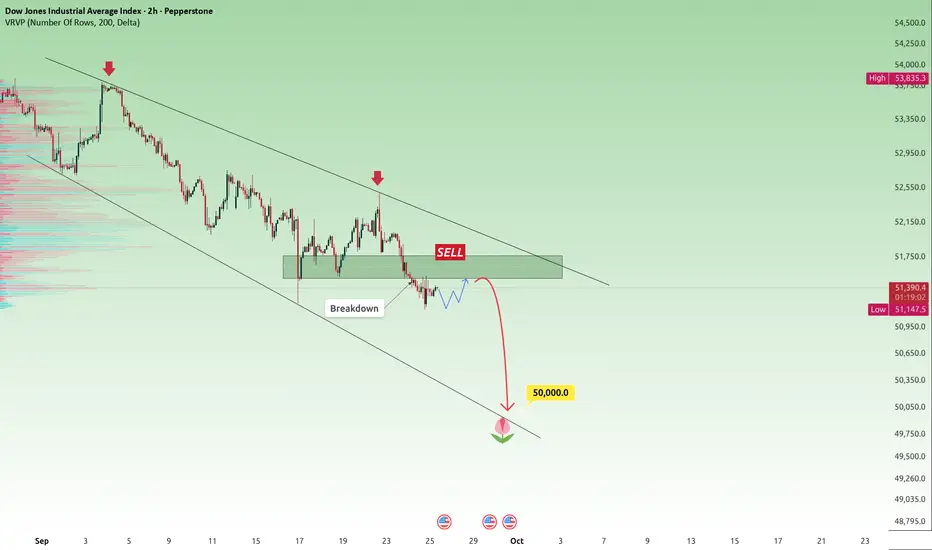
US30 Tests Broken Support — 50,000 Still in FocusUS30 is currently trading around 51,380, after breaking below an important support zone inside a clearly defined descending channel.
Price is now attempting to stabilize beneath the former 51,500–51,750 support area. If the market retests this zone and confirms rejection, the bearish structure woul
US30 - Short view📉 **US30 — SHORT VIEW**
🔻 **Entry:** CMP
🎯 **Target:** 52,460
🛑 **Stop Loss:** Above the recent swing high
US30 is showing weakness after recent selling pressure. I’m looking for a continuation move toward **52,460**.
⚠️ Wait for price confirmation before entering and manage risk properly.
#US30
US30 2H viewThe index has broken its multi-day ascending trendline. Momentum is shifting to the sell side as buyers fail to hold the highs.
* Market Price: 54,009
* The Setup: Classic break-and-retest play. Price is pulling back to test the broken trendline and horizontal resistance confluence.
--------------
See all ideas
Displays a symbol's value movements over previous years to identify recurring trends.
Frequently asked questions
The safest way to invest in DJ30 Future is through a reliable broker. Create an account, fund it, and place a buy order for index futures or other derivatives.
You can trade DJ30 Future directly from TradingView:
– Choose a broker: Explore our supported trading partners and pick one that fits your needs
– Compare options: View available brokers side by side to evaluate fees and features
– Connect your account: Open Supercharts, click "Trade", select your broker, and log in
– Start trading: Place orders without leaving the chart
Tip: If you're new to trading, try paper trading first — it lets you practice strategies in real market conditions without risking funds.
You can trade DJ30 Future directly from TradingView:
– Choose a broker: Explore our supported trading partners and pick one that fits your needs
– Compare options: View available brokers side by side to evaluate fees and features
– Connect your account: Open Supercharts, click "Trade", select your broker, and log in
– Start trading: Place orders without leaving the chart
Tip: If you're new to trading, try paper trading first — it lets you practice strategies in real market conditions without risking funds.