DOW JONES broke below its 1D MA200 after 7 months.Dow Jones (DJIA) broke yesterday below its 1D MA200 (orange trend-line) for the first time in more than 7 months (since April 08). Last time it broke below it as a Support was on March 09 during the start of the U.S. - Iran War and that was a bearish continuation signal with the price three weeks la
Dow Jones Industrial Averages Index (DJI) · Bear Market Wave ExtThe DJI turned red for seven weeks starting early February 2026. At this exact same time, Bitcoin and the Altcoins market went on a major bullish rise, growing non-stop for 90 days.
The DJI dropped between August and September 2026, while Bitcoin moved higher to produce a $87,400 price peak.
The D
DOW JONES INDEX (US30): Another Breakout
Bearish rally on US30 continues.
The market broke another significant daily support cluster.
It turned into strong resistance.
I expect one bearish move to 49850 level.
❤️Please, support my work with like, thank you!❤️
I am part of Trade Nation's Influencer program and receive a monthly fee
US30 (Dow Jones): Trendline Breakdown — Where Is The Support?Description:
Dow Jones Industrial Average (US30) is experiencing heavy selling pressure on the weekly timeframe, currently trading around 49,697 (-4.91% on the week) after breaking decisively below its primary multi-month ascending trendline. With the weekly candle still having 1d 6h left until th
US30 – Bearish BOS & Liquidity Target Short Setup (15M)Dow Jones (US30) has established a clear bearish market structure on the 15-minute timeframe. After forming a lower Swing High and delivering multiple bearish Breaks of Structure (BOS), price action indicates strong downward momentum. With significant sell-side liquidity resting below the key equal
Wall Street Under Pressure:
# Wall Street Under Pressure: Could This Be the Sharpest Sell-Off Since 2008?
**Market Analysis | November 19, 2026**
U.S. stocks are facing pressure from both monetary policy and weakening technicals. October inflation came in above expectations, and the Federal Reserve’s latest minutes showed
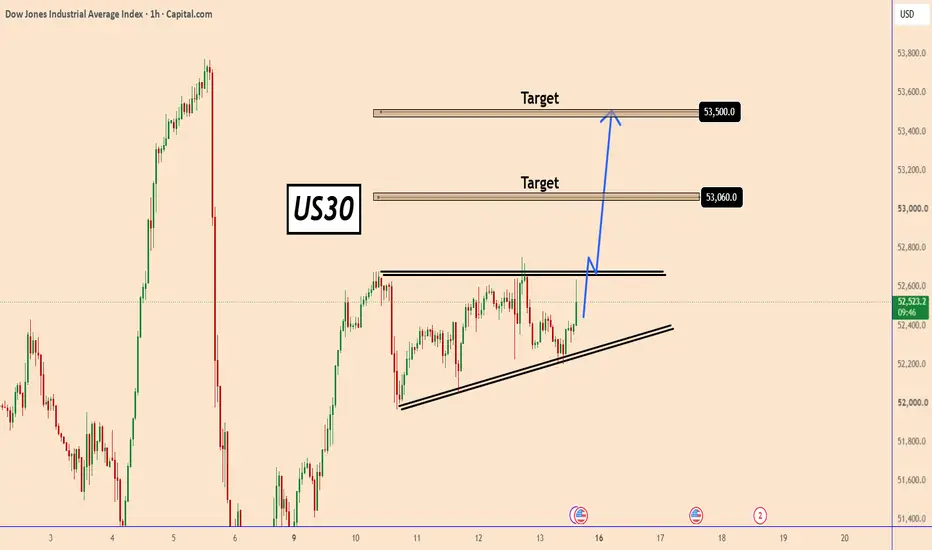
US30: A Short-Term Bullish SetupUS30: A Short-Term Bullish Setup
US30 is accumulating volume before moving further. The price looks like it is forming a large triangle pattern.
Once the price breaks out of the pattern, the US30 should resume its uptrend.
The short-term targets I am currently considering are near 53060 and a mo
DOW JONES: Correction targeting 49,400.Dow Jones just turned bearish again on its 1D technical outlook (RSI = 43.852, MACD = -29.435, ADX = 21.289) as it lost its 1D MA50 again and is entering the 2nd part of the 3 month correction. A crossing under the 1D MA200 which has held 3 times in the past 6 weeks would aim for the 1W MA75 that pr
See all ideas
Displays a symbol's value movements over previous years to identify recurring trends.
Frequently asked questions
The safest way to invest in DJ30 Future is through a reliable broker. Create an account, fund it, and place a buy order for index futures or other derivatives.
You can trade DJ30 Future directly from TradingView:
– Choose a broker: Explore our supported trading partners and pick one that fits your needs
– Compare options: View available brokers side by side to evaluate fees and features
– Connect your account: Open Supercharts, click "Trade", select your broker, and log in
– Start trading: Place orders without leaving the chart
Tip: If you're new to trading, try paper trading first — it lets you practice strategies in real market conditions without risking funds.
You can trade DJ30 Future directly from TradingView:
– Choose a broker: Explore our supported trading partners and pick one that fits your needs
– Compare options: View available brokers side by side to evaluate fees and features
– Connect your account: Open Supercharts, click "Trade", select your broker, and log in
– Start trading: Place orders without leaving the chart
Tip: If you're new to trading, try paper trading first — it lets you practice strategies in real market conditions without risking funds.