DOW JONES broke below its 1D MA200 after 7 months.Dow Jones (DJIA) broke yesterday below its 1D MA200 (orange trend-line) for the first time in more than 7 months (since April 08). Last time it broke below it as a Support was on March 09 during the start of the U.S. - Iran War and that was a bearish continuation signal with the price three weeks later hitting and bottoming on the 1W MA70 (red trend-line).
As a result, our immediate Target on Dow is 49400 (1W MA70 trajectory). If that breaks (i.e. one 1D candle closes below it), we expect the m
In-depth trading ideas
Dow Jones Industrial Averages Index (DJI) · Bear Market Wave ExtThe DJI turned red for seven weeks starting early February 2026. At this exact same time, Bitcoin and the Altcoins market went on a major bullish rise, growing non-stop for 90 days.
The DJI dropped between August and September 2026, while Bitcoin moved higher to produce a $87,400 price peak.
The DJI is about to print a major crash. It would be easy to assume that Bitcoin is about to move in the opposite direction as it already happened twice this year—an inverse (or negative) correlation betwe
DOW JONES INDEX (US30): Another Breakout
Bearish rally on US30 continues.
The market broke another significant daily support cluster.
It turned into strong resistance.
I expect one bearish move to 49850 level.
❤️Please, support my work with like, thank you!❤️
I am part of Trade Nation's Influencer program and receive a monthly fee for using their TradingView charts in my analysis.
US30 (Dow Jones): Trendline Breakdown — Where Is The Support?Description:
Dow Jones Industrial Average (US30) is experiencing heavy selling pressure on the weekly timeframe, currently trading around 49,697 (-4.91% on the week) after breaking decisively below its primary multi-month ascending trendline. With the weekly candle still having 1d 6h left until the close, confirming this breakdown puts the focus directly on the major institutional demand zones resting beneath current price action.
Key Support Levels to Watch:
1. Immediate Bullish Orde
US30 – Bearish BOS & Liquidity Target Short Setup (15M)Dow Jones (US30) has established a clear bearish market structure on the 15-minute timeframe. After forming a lower Swing High and delivering multiple bearish Breaks of Structure (BOS), price action indicates strong downward momentum. With significant sell-side liquidity resting below the key equal lows around the 52,000 level, we expect price to continue its bearish leg directly into our final target zone.
#US30 #DowJones #DJIA #IndicesTrading #ForexSignals #SmartMoneyConcepts #PriceAction #Liq
Wall Street Under Pressure:
# Wall Street Under Pressure: Could This Be the Sharpest Sell-Off Since 2008?
**Market Analysis | November 19, 2026**
U.S. stocks are facing pressure from both monetary policy and weakening technicals. October inflation came in above expectations, and the Federal Reserve’s latest minutes showed that two participants were open to considering a rate hike of more than 25 basis points in December. Meanwhile, the **Dow Jones Industrial Average** broke below a rising channel that had been in plac
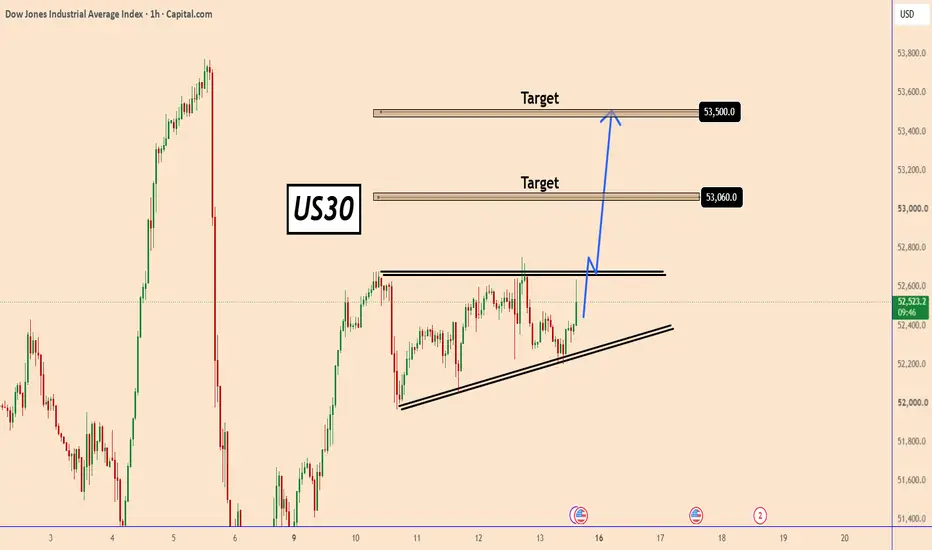
US30: A Short-Term Bullish SetupUS30: A Short-Term Bullish Setup
US30 is accumulating volume before moving further. The price looks like it is forming a large triangle pattern.
Once the price breaks out of the pattern, the US30 should resume its uptrend.
The short-term targets I am currently considering are near 53060 and a move to 53500.
You can find more details on the chart.
Thank you! 🍀
⚠️PS: Do your own analysis and use your own strategy to join the trade.
❤️ If this analysis helps your trading day, please support i
DOW JONES: Correction targeting 49,400.Dow Jones just turned bearish again on its 1D technical outlook (RSI = 43.852, MACD = -29.435, ADX = 21.289) as it lost its 1D MA50 again and is entering the 2nd part of the 3 month correction. A crossing under the 1D MA200 which has held 3 times in the past 6 weeks would aim for the 1W MA75 that provided the exact bottom during the last correction. Short, TP = 49,400.
## If you like our free content follow our profile to get more daily ideas. ##
## Comments and likes are greatly appreciated
Episode 17 — Double Zigzag# Mr. Nobody’s Chronicle
## Season I — The History of the Elliott Wave Principle
### Episode 17 — Double Zigzag
*When One Zigzag Isn't Enough to Complete a Correction...*
Sometimes, after an upward or downward move, the market enters a corrective phase. Price moves against the previous trend, forming a three-wave A-B-C zigzag pattern on the chart.
But the story doesn't always end there!
Sometimes, the first zigzag isn't enough to complete the correction. The market changes direction again,
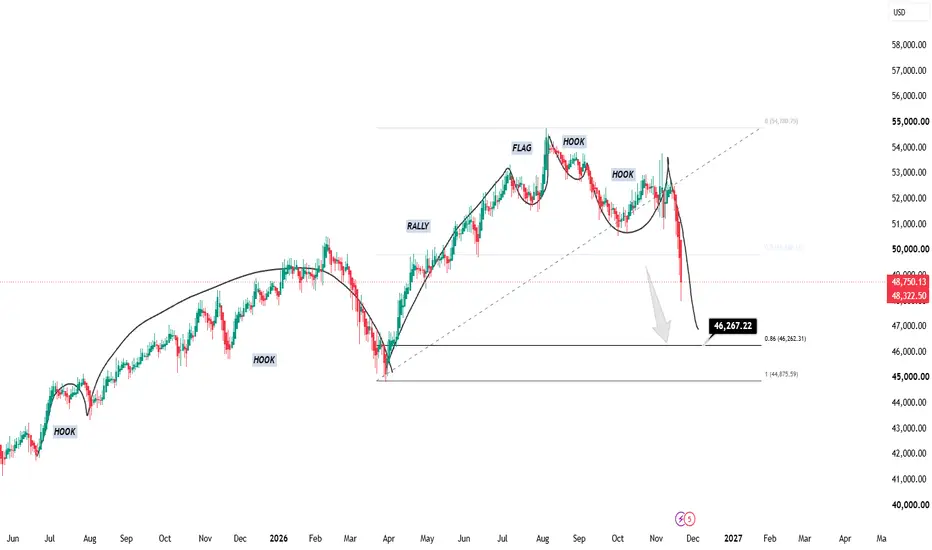
Dow Jones (US30) Daily: Rally Followed by Negative Flag, MinimumOn the daily timeframe of the Dow Jones, we can see a clear "hoghogh" (salary/wage-like) structure on the chart, followed by a rally. In the end, the flag has moved back into the negative phase, and we can see the same pattern again.
The rally has completed about 86% of this final leg, which puts price at around 46,267. This is the minimum drop I expect from here, and after that we should see a jump to the upside.
Not financial advice. Always do your own research and manage your risk.🙂
US30: Long Trade with Entry/SL/TP
US30
- Classic bullish formation
- Our team expects growth
SUGGESTED TRADE:
Swing Trade
Buy US30
Entry Level - 52261
Sl - 52167
Tp - 52411
Our Risk - 1%
Start protection of your profits from lower levels
Disclosure: I am part of Trade Nation's Influencer program and receive a monthly fee for using their TradingView charts in my analysis.
❤️ Please, support our work with like & comment! ❤️
US30 SHORT SETUP (1D)
Massive daily structure shift developing on the Dow. Here is the full breakdown for our swing short:
• Entry: 50,168.2
• Stop Loss: 51,055.8
• Target 1: 49,287.9
• Target 2: 48,310.4
• Target 3: 47,332.9
• Final Target: 46,303.1
Manage your risk strictly and look to take partials at each major level on the way down.
#US30 #DowJones #BTCUSDT #XAUUSD
US30 UPDATE 4H: Reclaim the Zone or Slide Lower?📍 What happened
• Our last US30 idea played out, both targets hit
• Price dropped into the confluence zone near 50,800 to 51,000
• It dipped below it to 50,565
• Price now sits just under the zone, around 50,786
• Confluence = several levels lining up in one area
🟢 Scenario 1: buyers reclaim
• Trigger: 4H body close back above the FVG near 51,141
• FVG = a fast move that left price traded on one side only
• First target: the MSS at 52,762
• MSS = first sign buyers are taking control
• A 4H body
DOW JONES: Multiyear pattern calls a 45,500 correction.Dow Jones turned bearish on its 1D technical outlook (RSI = 43.429, MACD = -24.456, ADX = 14.128) as following the recent rise, it has resumed a mild correction tone and is about to turn the whole 1W candle flat (RSI = 54.885). Such indecisive direction and weakness is usually seen on market tops and last time we had something similar was in early 2025. That was the last time Dow dropped under its 1W MA100. What matters on that correction wasn't just that it almost hit the 1W MA50 and rebounded.
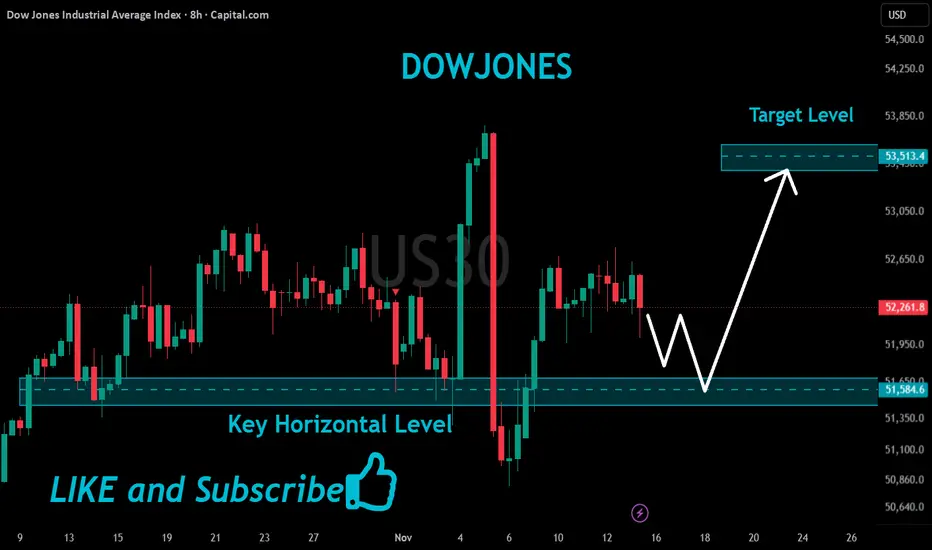
US30 Potential Long!
HI,Traders !
#US30 is trading in an
Uptrend and the Index made
A breakout of the key horizontal
Level of 51584.6 which is confirmed
So now the price is consolidating
Above the new support
And after a potential retest
Of the support level we are
Likely to see a further
Bullish move up !
Comment and subscribe to help us grow !
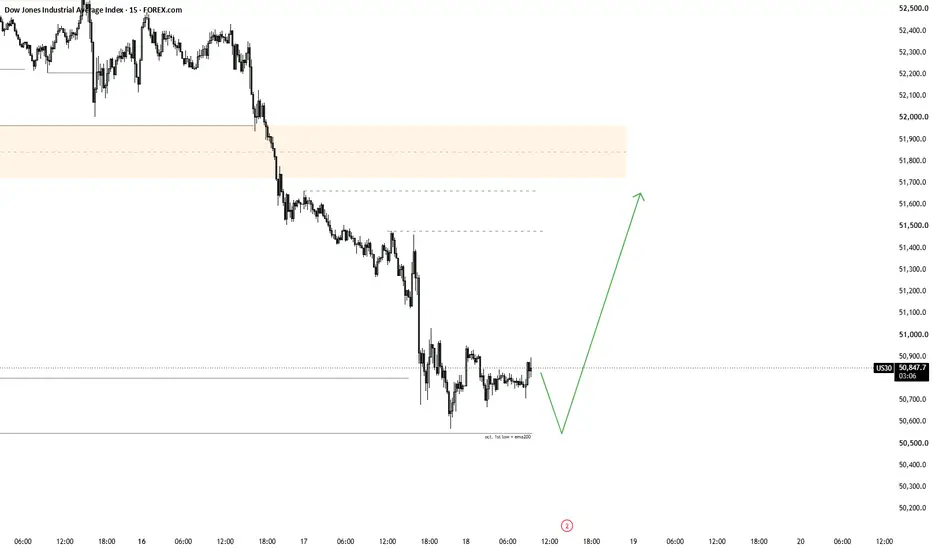
US30 – Sell-Side Liquidity Flush & Bullish Reversal Long SetupDow Jones (US30) has completed a deep liquidity flush below the consolidation range lows on the 15-minute timeframe. After sweeping sell-side liquidity and rejecting lower discount levels, buyers are stepping back in to shift momentum upward. With unmitigated Range Liquidity resting cleanly above the prior consolidation highs, we anticipate a strong bullish recovery leg toward our target zone.
#US30 #DowJones #DJIA #IndicesTrading #BullishReversal #LiquiditySweep #SmartMoneyConcepts #PriceAction
Dowjones (us30)It seems we are at the start of a bearish cycle. The Dow Jones will close the specified cycle in the first phase (there is one exception: it may want to start the third bullish leg, and we will have to see in the future how it reacts to those areas). Accordingly, the S&P and Nasdaq indices will also be bearish with a time lag.
Weekly Technical Analysis - 16 November 2026Wall Street's remains range-bound, with the choppy recovery from the October low leaving price little changed over the past two months. Price is coiling between the descending trendline from the August high and the rising trendline from the May low, and sits just above a flat VWAP. RSI is just above neutral. A close above the descending trendline would point to a bullish breakout, while a drop below the rising trendline would put the October low in focus.
US Tech 100' downtrend has
Dow Jones: Another Pullback Within the Sideways RangeAfter a sharp decline and a corrective move to normalize the strong bearish momentum, the Dow Jones is likely to enter another correction before potentially resuming its downward move toward the next projected support zone.
This correction could intensify following this evening’s news release. However, I consider the probability of a sharp, one-way move directly toward the previous low to be very low.
We have to wait and see
Stay with me and be profitable
Do you have any questions? Ask me in th
DOW JONES + NIKKEI 225 POSITIONS REVIEW AND FUTURE EXPECTATIONSIn this video I showed my two last positions in index market.
First one was Dow Jones , and second one was NIKKEI 225 known as JP225.
In my analysis I used graph pattern strategy and SMC tools.
At the end I shared my opinions about future movements and shere I expect to see price at the end of the week.
Also, I will post index review on Wednesday and update on Friday, so dont miss it.
I hope that you liked my positions and explanations, I`m open to answer any questions related to this trade