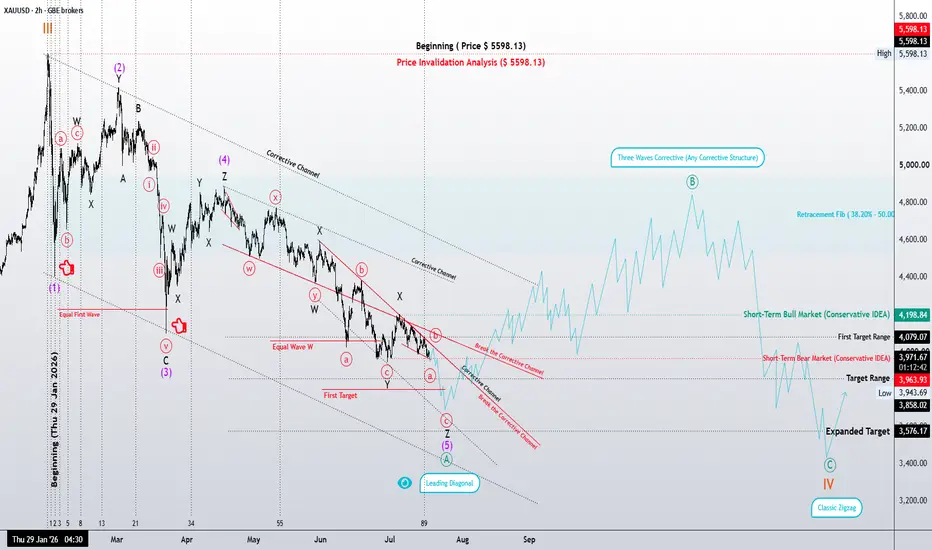
Gold | One More Wave… or Has Wave B Already Begun?XAUUSD | 2H Elliott Wave Update
According to the higher-degree Weekly and Daily wave counts, Gold continues to develop Wave IV. This analysis is based on the Elliott Wave Principle, following both its core rules and structural guidelines while focusing on market structure rather than price prediction.
The primary focus of this update is a Leading Diagonal, currently identified as part of Wave A. Price has now reached a region where this structure may be complete. However, until the market provides structural confirmation, the Leading Diagonal cannot be considered finished with certainty.
According to the Elliott Wave Principle, Waves 2 and 4 within a Leading Diagonal must unfold as Zigzag corrections, whether single, double, or triple. Likewise, Waves 1, 3, and 5 may develop either as Impulses or as Zigzags, with those Zigzags also appearing in single or multiple forms.
At the current stage, Wave 5 of the Leading Diagonal is displaying signs of structural complexity. Therefore, two scenarios remain equally valid. The first suggests that the Leading Diagonal has already been completed and the market is ready to begin Wave B. The second assumes that one final minor decline—or a brief capitulation move—is still required before the diagonal can be considered complete.
From a structural perspective, a confirmed breakout above the descending corrective channel would provide the first meaningful evidence that Wave B has begun. Until then, additional downside movement within the current structure remains a valid possibility.
Once the Leading Diagonal is confirmed complete, the preferred scenario is for Wave B to unfold, followed by Wave C, ultimately completing Wave IV as a classic A–B–C Zigzag. Fibonacci retracement levels may help identify potential reversal zones, but in this analysis, market structure always takes precedence over price ratios.
Research Notes
One observation that has repeatedly caught my attention is the visual similarity between some Leading Diagonals and Triple Zigzags. In several markets, I have seen price confined within converging trendlines, initially appearing to be a textbook Leading Diagonal. However, as the structure matured, it became evident that the market was actually developing a Triple Zigzag.
This occurs because multiple Zigzags can sometimes produce a wedge-like appearance. For that reason, visual pattern recognition alone is never sufficient. The internal wave relationships and the structural rules of the Elliott Wave Principle remain the decisive factors.
Another key element is the relationship between Gold and the U.S. Dollar Index (DXY). Although these markets generally maintain an inverse correlation, historical observations suggest that this relationship is not always constant. There have been periods in which Gold continued building a bullish structure despite a rising Dollar Index. In such situations, one market appears to be correcting through time, while the other progresses toward a price objective.
For this reason, I place greater emphasis on wave structure and price behavior than on traditional intermarket correlations alone.
Unless the market proves otherwise, my preferred expectation remains unchanged: once the Leading Diagonal is complete, Wave B should develop first, followed by Wave C, ultimately completing Wave IV as a classic Zigzag correction.
Price is the outcome; Structure is the cause.
Patterns whisper. I listen.
— Mr.Nobody
Gold Spot / U.S. Dollar
7 days ago
Gold | One More Wave… or Has Wave B Already Begun?
Gold Spot / U.S. Dollar
May 17
Gold 4H: Leading Diagonal or Just the Beginning?
 Long
Long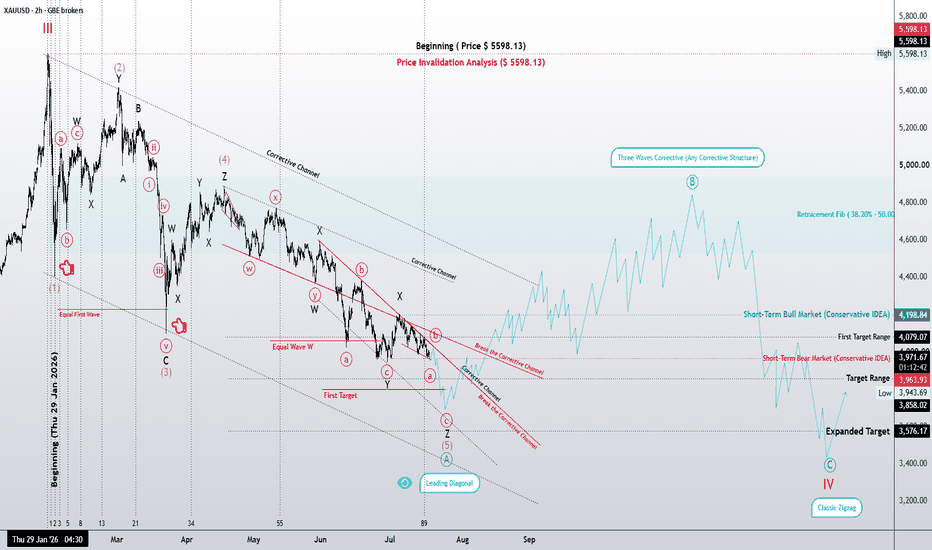
4H Roadmap: The Structure That Will Decide the Weekly Scenario# **DXY | 4H Roadmap: The Structure That Will Decide the Weekly Scenario 🌀**
Greetings, fellow wave practitioners.
In the previous weekly analysis, I presented two valid long-term scenarios for the U.S. Dollar Index (DXY): an **Aggressive Scenario** and a **Conservative Scenario**. The purpose of this 4-hour update is to determine which of those higher-degree paths the market is currently constructing.
From the most recent major high, the initial decline is unfolding as a **three-wave structure**. This is a crucial observation because those three waves form the foundation for interpreting the higher-degree count. The real question is not where price is going next—it is **what structure these three waves actually represent.**
At this stage, the current rally may simply be a corrective move. If this correction completes within the highlighted reaction zone, the preferred interpretation is that the market is developing **Wave (4) of a Leading Diagonal**. Under this scenario, one final decline would be expected to complete **Wave (5)** of the diagonal, thereby finishing the entire higher-degree **Wave (A)**.
However, markets rarely choose the simplest path. Should the current correction extend beyond the expected characteristics of a typical fourth wave, more complex corrective structures must also be considered. What appears today as a simple correction could evolve into a **Double Zigzag (W-X-Y)** or even a **Triple Zigzag (W-X-Y-X-Z)**, requiring additional time before the correction is fully completed.
For this reason, the focus should not be placed solely on price targets. The highlighted reaction zones, corrective channels, and—most importantly—price behavior around those areas will provide the strongest evidence for identifying the market's true structure. Until that structure becomes clear, every wave count that remains consistent with the rules and guidelines of the Elliott Wave Principle deserves consideration.
Ultimately, the interpretation of this 4-hour structure will determine which of the two weekly scenarios gains confirmation.
If the market completes the current correction and then produces one final decline to finish the Leading Diagonal, the **Aggressive Scenario** will gain significant credibility. In that case, the recent decline would represent only **Wave (A)** of a much larger corrective sequence, to be followed by a higher-degree **Wave (B)** and eventually **Wave (C)**.
On the other hand, if price decisively breaks above the key structural levels and no longer behaves consistently with the expected diagonal or corrective pattern, the **Aggressive Scenario** would gradually lose validity. That outcome would strengthen the **Conservative Scenario**, suggesting that the larger correction has already ended and that the U.S. Dollar Index may be entering a new long-term bullish phase.
At this point, the answer will not come from prediction—it will come from **price behavior**.
As Elliott Wave analysts, our objective is not to forecast the future with certainty. Our objective is to identify the structure the market is building in real time. Once that structure reveals itself, the higher-degree roadmap becomes considerably clearer.
**Patterns whisper. I listen.**
**— Mr. Nobody** 📊🌀
Dollar Index Future
2 days ago
DXY | Corrective Structure Under the Microscope
 Long
Long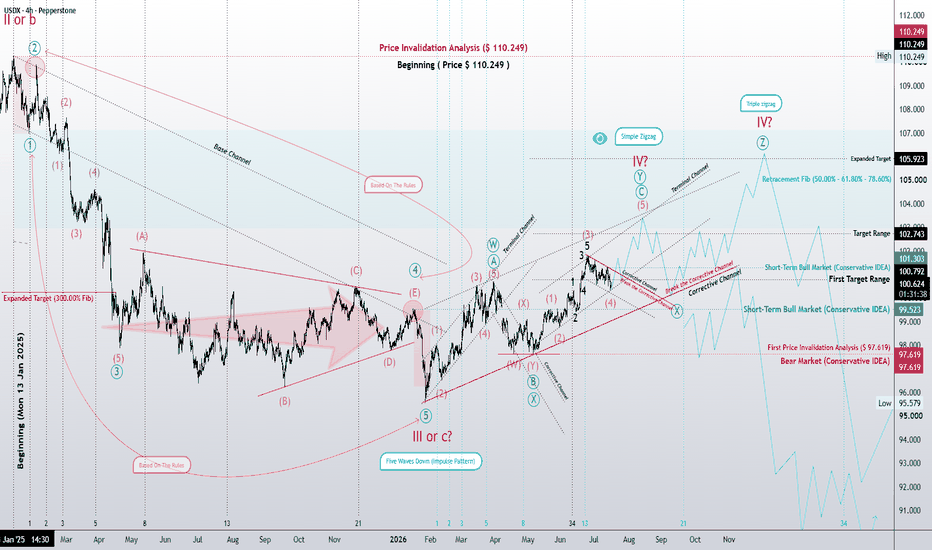
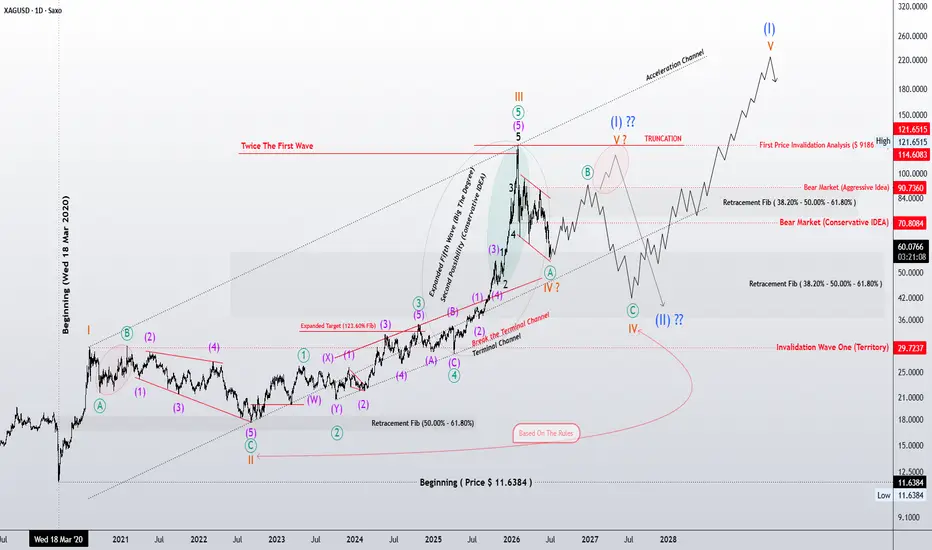
Leading Diagonal Suggests a Corrective Rally Before Completing XAGUSD (Silver) | Leading Diagonal Suggests a Corrective Rally Before Completing Higher-Degree Wave IV
"Price is the outcome. Structure is the cause."
After examining the weekly, daily, and now the 4-hour chart, the aggressive scenario continues to align with the rules and guidelines of the Elliott Wave Principle.
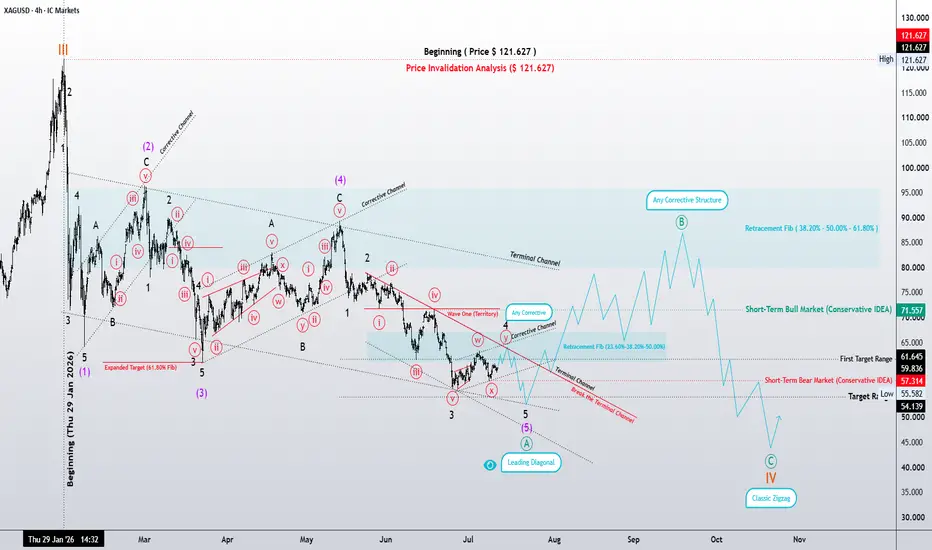
In this interpretation, the recent decline is counted as a Leading Diagonal following the 5-3-5-3-5 structural sequence. So far, the internal subdivisions remain consistent with the characteristics of a leading diagonal, suggesting that either one lower-degree wave remains before completion, or the pattern has already completed and the market is preparing for its next phase.
If this wave count is correct, the completion of Wave A should be followed by a short-term corrective rally, developing Wave B. Since Wave B may unfold in virtually any corrective form, this analysis focuses on identifying the highest-probability retracement zone rather than assuming a specific corrective pattern.
For that reason, the 38.2%, 50%, and 61.8% Fibonacci retracement levels are highlighted as the most likely region for Wave B to terminate.
Once Wave B is complete, the next expectation is the development of an impulsive Wave C, ultimately completing a classic Zigzag (5-3-5) correction. If this scenario unfolds as expected, it would also complete the higher-degree Wave IV correction.
Only after that larger correction is finished will the market be expected to resume its primary trend. Assuming the current wave count remains valid, the next advancing wave could initiate the continuation of the broader bullish cycle.
As always, this is not a price prediction. It is a structural roadmap developed through the rules and guidelines of the Elliott Wave Principle. As long as the invalidation level remains intact, this scenario stays valid and will be updated whenever new price data requires a reassessment.
Signature
"Price is the outcome. Structure is the cause."
Patterns whisper. I listen.
— Mr. Nobody 🎧📊
Silver Futures
May 17
Silver: Textbook Grand Supercycle Wave 3 Setup
Silver / U.S. Dollar
May 19
Title: Silver: The Silver Symphony in the Third Movement
Silver / U.S. Dollar
May 19
XAGUSD | 4H Wave Map — A Two-Layer Look at Structure
 Long
Long
Gold | One More Wave… or Has Wave B Already Begun?XAUUSD – 4H Elliott Wave Analysis
According to the higher-degree Weekly and Daily wave counts, Gold appears to be developing Wave IV. This analysis is built upon the Elliott Wave Principle, adhering to its core rules and structural guidelines rather than relying on price prediction.
The first component of this structure is a Leading Diagonal, which may have already reached completion. If confirmed, the market could initiate a short-term bullish move, representing Wave B within the larger corrective structure.
However, an alternative scenario remains equally valid. One final decline may still be required to complete the Leading Diagonal before Wave B can begin. Until price confirms the structure, both scenarios should remain under consideration.
Once the Leading Diagonal is complete, the preferred expectation is for Wave B to unfold, followed by Wave C, ultimately completing Wave IV as a classic Zigzag (A–B–C). Structurally, the 50.0%–61.8% Fibonacci retracement zone remains the most probable region for the completion of this corrective phase.
Another critical factor to monitor is the relationship between Gold and the U.S. Dollar Index (DXY). Whether their traditional inverse correlation remains intact or temporarily weakens will likely influence the path, momentum, and timing of the remaining corrective structure.
As always, the objective is not to predict price, but to identify the market's structural development. The structure will determine the path; price will simply reveal it.
This analysis represents a structural roadmap based on the Elliott Wave Principle. The market will ultimately confirm or invalidate the scenario.
Signature
Price is the outcome; Structure is the cause.
Patterns whisper. I listen.
— Mr.Nobody
Gold Spot / U.S. Dollar
7 days ago
Is the Leading Diagonal Signaling the Beginning of Wave IV?
Long 
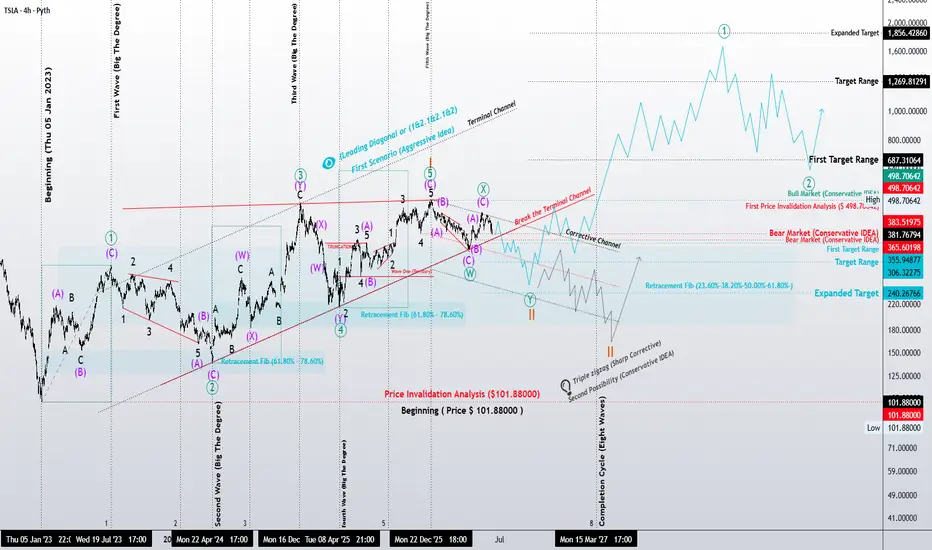
TSLA 4H: Extended Leading Diagonal or a Deeper Correction?
"Price is the consequence. Structure is the cause."
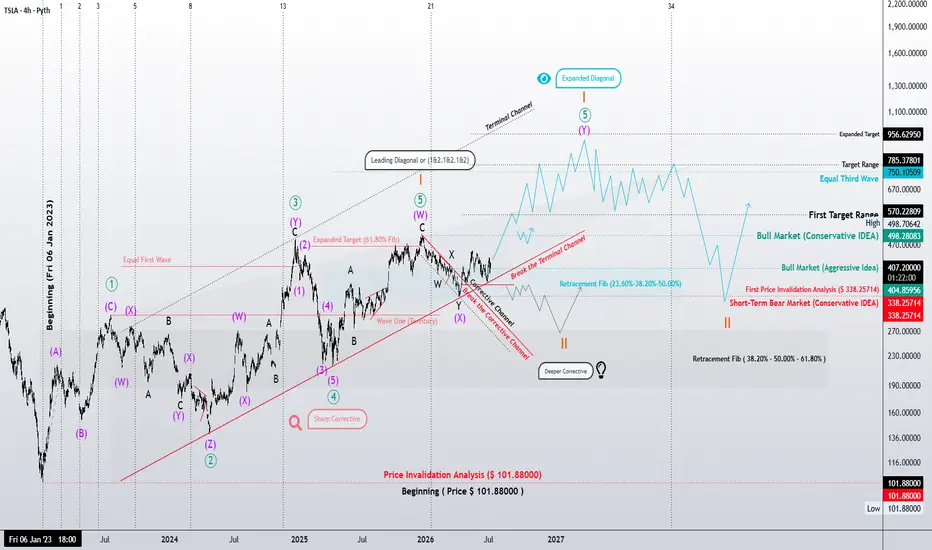
This four-hour structural analysis of Tesla (TSLA) examines the market through the principles of Elliott Wave Theory. Rather than forecasting price alone, the objective is to determine the market's current position within the larger wave structure and identify the most probable path forward.
Primary Thesis — Extended Leading Diagonal
The preferred interpretation views the current structure as a Leading Diagonal exhibiting structural extension, provided that the first structural invalidation level at $338.25714 remains intact.
Although "Extended Leading Diagonal" is not a formal Elliott Wave pattern, the current price development displays characteristics consistent with a diagonal extending beyond the proportions typically observed.
So far, the present advance has traveled only 61.8% of the preceding third wave, leaving room for additional structural expansion.
If this interpretation is correct, a confirmed breakout above $498.70642 could initiate a strong multi-swing advance, displaying momentum similar to an impulsive sequence while completing the terminal portion of the diagonal. A proportional correction would then be expected before the broader uptrend resumes.
Structural Targets
• First Target: $465.44267
• Primary Target: $570.22809
• Extended Targets: $750.10509 and $956.62950
Secondary Thesis — Conservative Development
The conservative interpretation assumes that the current Leading Diagonal has already completed, but the market still requires a more mature corrective phase before the next impulsive advance begins.
That correction could develop as:
Zigzag
Double or Triple Zigzag
Flat
or a more complex corrective combination.
According to Elliott Wave guidelines, corrections following a Leading Diagonal are often deeper and more time-consuming than the decline currently observed.
Only a clearly developing series of nested 1-2 sequences would significantly strengthen the case that the next higher-degree third wave has already begun.
Both scenarios remain structurally bullish over the long term. Their only difference lies in the depth, duration, and internal development of the current correction.
Structural Cycle
Under the preferred wave count, Tesla continues progressing toward the completion of a higher-degree eight-wave cycle, with the current roadmap projecting structural completion around March 2027, assuming Elliott Wave relationships remain valid.
Key Technical Levels
Bull Market Confirmation: $498.28083
Critical Structural Validation: $101.88
First Structural Invalidation: $338.25714
Structural Observation
An alternative interpretation remains under observation.
The current structure could eventually prove to be an Ending Diagonal completing Primary Wave (III), which would imply that a larger Primary Wave (IV) correction is still ahead.
At present, however, the available structural evidence continues to favor the Leading Diagonal interpretation. The alternative count remains part of ongoing Elliott Wave research, recognizing that structural interpretation evolves with price rather than personal conviction.
Markets rarely move in a straight line.
Structure provides the context. Price delivers the evidence.
Patterns whisper. I listen.
– Mr. Nobody 🎧📊
Elliott Wave Researcher
Gold Spot / U.S. Dollar
Feb 13, 2024
My view after two years (Sharp correction pattern)
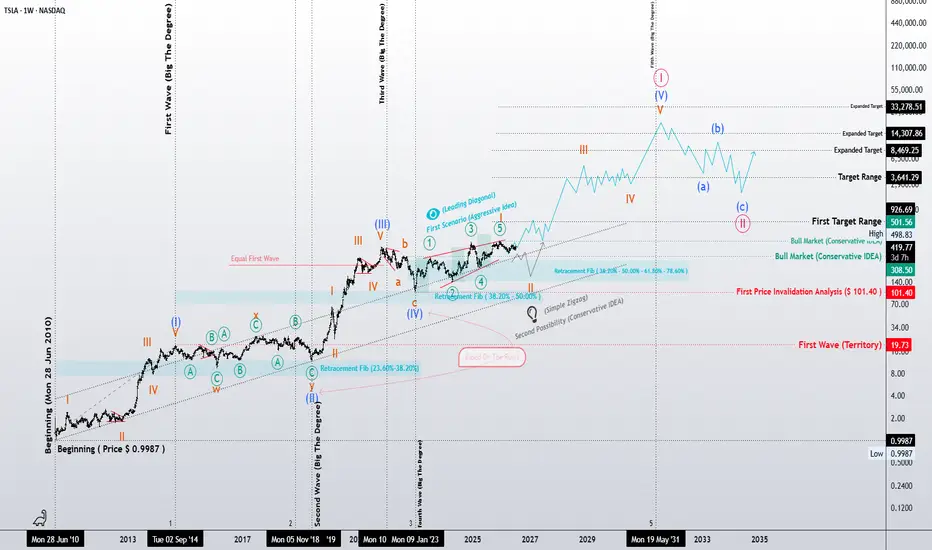
TSLA: A Structural Blueprint of the Grand Cycle
"Price is the consequence. Structure is the cause."
This analysis is not a simple price forecast. Rather, it is a structural study of Tesla's position within its Grand Cycle through the principles and guidelines of Elliott Wave Theory.
Since its 2010 low, Tesla has developed a sequence of impulsive and corrective waves, each forming part of a much larger market geometry. The objective of this study is to identify the market's current position within that hierarchy and explore the most probable paths ahead based on wave structure, Fibonacci relationships, and Elliott Wave principles.
Aggressive Scenario (Turquoise Path): A Developing Leading Diagonal
The primary interpretation assumes that Primary Wave (IV) has already completed and the market has begun constructing a Leading Diagonal, marking the first phase of a new higher-degree impulsive cycle.
Within Elliott Wave Theory, a Leading Diagonal typically emerges at the beginning of a new trend, when market sentiment remains uncertain and confidence has yet to fully return. Rather than signaling weakness, this structure often reflects the gradual transition from accumulation toward expansion.
The key question is therefore:
Has the current correction already fulfilled the structural requirements of a Leading Diagonal?
If the answer proves to be yes, Tesla may already have established the structural foundation for the next higher-degree advance, potentially leading into a powerful Primary Wave (III), which is often the strongest and most dynamic phase of an impulsive sequence.
Conservative Scenario (Blue Path): The Correction May Require Further Development
The conservative interpretation remains equally bullish over the long term but suggests that the current correction may not yet be structurally complete.
Under this scenario, the market could still require a more mature corrective formation, such as:
Zigzag
Flat
or a more complex corrective combination
Once that correction is completed—while respecting Elliott Wave rules and structural guidelines—the market would still be expected to follow the same long-term bullish path illustrated by the aggressive scenario.
In other words, the destination remains the same. The only difference lies in the maturity, depth, and internal structure of the current correction.
Key Structural Levels
Structural Invalidation Level: 101.40
First Wave Territory: 19.73
The long-term objectives presented in this study are not arbitrary price projections. They are derived from Fibonacci expansion relationships and the mathematical structure of Elliott Wave development.
Research Note
Alongside the two primary scenarios, an alternative wave count remains under continuous evaluation.
Under this alternative interpretation, the current diagonal could ultimately prove to be an Ending Diagonal, completing Primary Wave (III) rather than initiating a new impulsive cycle. Should that interpretation prevail, the market would still require a larger-degree Primary Wave (IV) correction before the next long-term advance begins.
At present, however, the available structural evidence continues to favor the Leading Diagonal interpretation. The Ending Diagonal remains a secondary research hypothesis, maintained not because it is currently preferred, but because Elliott Wave analysis requires every credible structural alternative to remain open until the market itself resolves the pattern.
My objective is not to defend a preferred wave count, but to continuously refine structural understanding through the observation of real market behavior.
Markets are often dominated by noise.
Structure reveals the logic behind price.
Patterns whisper. I listen.
– Mr. Nobody 🎧📊
Elliott Wave Researcher  Long
Long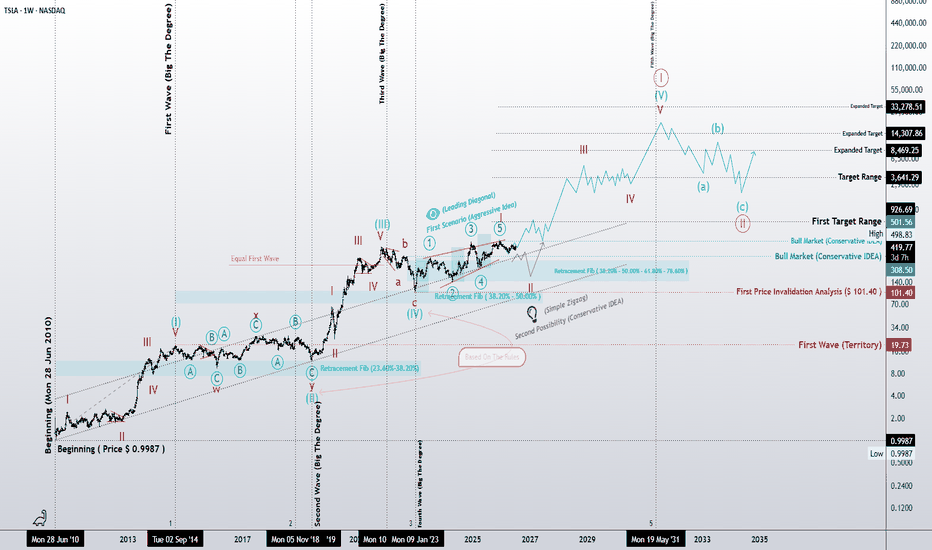
Is the Leading Diagonal Completing Wave A Before the Next RallySilver Elliott Wave Analysis (XAGUSD) | Is Wave A Near Completion Before a Classic Zigzag Correction?
Financial markets reward discipline—not certainty.
Every price movement reflects collective market psychology, and the Elliott Wave Principle provides a structured framework for studying that behavior through objective market structure.
This analysis is based on Elliott Wave rules, guidelines, Fibonacci relationships, channel analysis, and price action—not prediction.
Ultimately, the market will determine which scenario unfolds.
Primary Structural Scenario
My primary scenario interprets the current decline as a Leading Diagonal, potentially forming Wave A of a larger Wave IV correction.
So far, the internal structure continues to respect Elliott Wave rules and guidelines.
From a Fibonacci perspective, Wave (3) has advanced only approximately 61.8% of the length of Wave (1).
Meanwhile, Wave (5) has already exceeded both the 61.8% and 78.6% Fibonacci projections of Wave (3), leaving equality with Wave (3) as the final remaining Fibonacci objective.
Because of this relationship, one final decline cannot be ruled out before the Leading Diagonal is fully completed.
As long as price respects the initial invalidation level, this wave count remains technically valid.
What Could Happen Next?
If the Leading Diagonal completes as expected, I anticipate the beginning of Wave B, most likely developing as a three-wave corrective rally.
Until price proves otherwise, I will continue treating every bullish move as corrective rather than the beginning of a new impulsive uptrend.
Should Wave B remain below the previous major high while maintaining a corrective structure, the probability of an impulsive Wave C completing the larger Wave IV Zigzag correction would increase significantly.
Only after the completion of Waves A-B-C would I begin monitoring the potential development of Wave V.
Gold and Silver Correlation
Gold and Silver have historically maintained a strong positive correlation, although they rarely move in perfect synchronization.
Silver often demonstrates greater volatility and, at important turning points, can occasionally lead Gold.
For that reason, I continuously evaluate both markets together rather than in isolation.
If both markets confirm similar Elliott Wave structures, confidence in the larger scenario naturally increases.
What Should Aggressive Traders Watch?
The current 15-minute price action deserves close attention.
At this stage, the market may still be developing either:
Three nested 1–2, 1–2, 1–2 sequences, suggesting another decline before the correction begins, or
The final subdivision of the current Leading Diagonal, signaling that Wave A is approaching completion.
Until one of these structures is confirmed, every corrective move should be evaluated according to its own degree while respecting the initial invalidation level.
Patience remains one of the most valuable trading tools.
Allow the market to complete the first impulsive move and its following correction before drawing larger conclusions.
My Analytical Philosophy
My objective is not to predict the market.
My objective is to identify the structure the market is building.
If this scenario is confirmed, the analysis has fulfilled its purpose.
If market structure changes, my wave count will change with it—without hesitation and without emotional attachment.
In Elliott Wave analysis, flexibility is not weakness.
It is respect for objective market evidence.
Risk Management Comes First
The market has no sympathy for undisciplined traders.
It rewards patience, respects discipline, and punishes emotional decisions without exception.
Our responsibility does not end after entering a position.
Our responsibility is to minimize risk, protect capital, and preserve profits whenever the market provides the opportunity.
Because in the end...
The market always has the final word.
Facts always win.
Final Thoughts
This publication represents an independent Elliott Wave study based entirely on objective market structure.
It is not financial advice, nor a promise that this scenario will unfold exactly as presented.
The market owes us nothing.
Our responsibility is simply to follow the structure, respect the rules, and adapt whenever new information appears.
That is the essence of Elliott Wave analysis.
"Patterns whisper. I listen."
— Mr. Nobody 🎧📊 Long 
Is the Leading Diagonal Signaling the Beginning of Wave IV?Gold Elliott Wave Analysis (XAUUSD) | Is the Leading Diagonal Signaling the Beginning of Wave IV?
Financial markets reward discipline—not certainty.
Every price movement reflects collective market psychology, and Elliott Wave Principle provides a structured framework for studying that behavior. My objective is not to predict the future, but to evaluate market structure through Elliott Wave rules, guidelines, Fibonacci relationships, channel analysis, and price action.
The market will ultimately determine which scenario is correct.
The Aggressive Scenario
The aggressive scenario interprets the current decline as a Leading Diagonal, a structure whose internal wave relationships continue to respect Elliott Wave rules and guidelines.
Within this interpretation, Wave (3) is approximately equal in length to Wave (1), while Wave (5) has advanced only about 61.8% of Wave (3). These Fibonacci relationships strengthen the possibility that the diagonal is approaching completion rather than extending further.
Since no Elliott Wave rule has been violated, the initial invalidation level remains the most important price reference for this scenario.
What Could Happen Next?
If this interpretation proves correct, I expect the market to begin a sharp corrective rally, most likely developing at least a three-wave recovery before another decline unfolds to complete a larger classic Zigzag correction (Wave IV).
However, one additional possibility should not be ignored.
The final subdivision of the current Leading Diagonal may still require one more decline before the structure is fully completed, allowing price to reach the downside target area highlighted on the chart.
For that reason, patience remains essential.
Rather than anticipating every price movement, I prefer waiting for the first completed impulsive wave, followed by its corrective structure. Only then can the market confirm whether the larger Wave IV correction has truly begun.
What Should Aggressive Traders Watch?
The current price action on the 15-minute timeframe deserves close attention.
At this stage, the market may still be developing either:
Three nested 1–2, 1–2, 1–2 sequences, suggesting further downside before a reversal, or
A nearly completed Leading Diagonal, signaling that a corrective rally could begin soon.
Until one of these structures is confirmed, every corrective move should be evaluated relative to its own degree while respecting the initial invalidation level shown on the chart.
My Analytical Approach
My objective is not to predict the market.
My objective is to identify the structure the market is building.
If price confirms this scenario, the analysis has served its purpose.
If market structure changes, my wave count will change with it—without hesitation and without emotional attachment.
In Elliott Wave analysis, flexibility is not weakness.
It is respect for objective market evidence.
Risk Management Comes First
The market has no sympathy for undisciplined traders.
It rewards patience, respects discipline, and punishes emotional decisions without exception.
Our responsibility as traders does not end after entering a position.
Our real responsibility is to minimize risk, protect capital, and preserve profits whenever the market provides the opportunity.
The market always has the final word.
Final Thoughts
This analysis represents a research-based interpretation of the current market structure using Elliott Wave Principle.
It is not financial advice, nor a prediction of future prices.
Like every wave count, it remains valid only as long as market structure supports it.
When the structure changes, the analysis must change with it.
Because in financial markets...
Facts always win.
"Patterns whisper. I listen."
— Mr. Nobody 🎧📊 Long 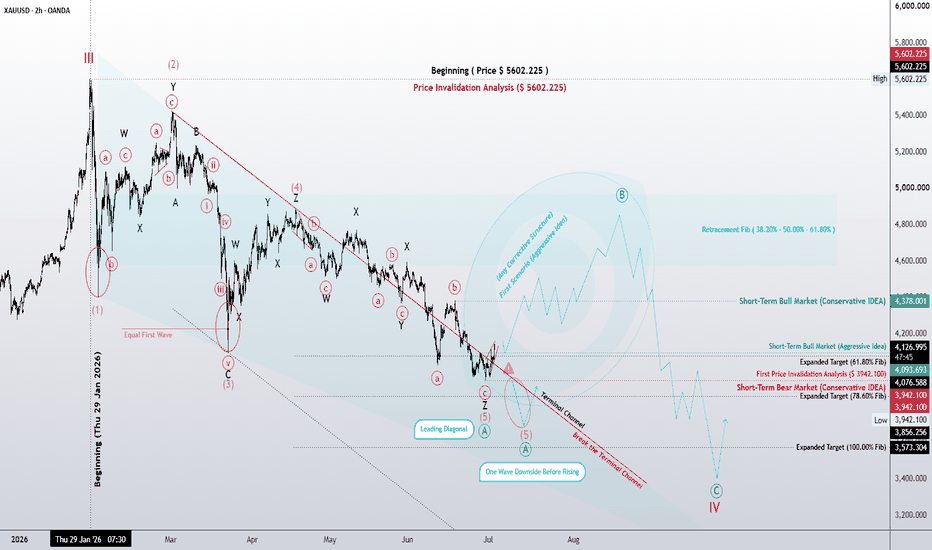
Is Wave IV Building the Foundation for the Final Fifth Wave?Silver (XAGUSD) | Is Wave IV Building the Foundation for the Final Fifth Wave?
Financial markets are not random.
Every price movement reflects the collective decisions of millions of market participants, and over time those decisions tend to organize themselves into recognizable structures. Elliott Wave Principle is not simply a forecasting tool—it is a framework for studying collective market behavior through objective price structure.
This publication is shared from that perspective.
Its purpose is not to predict the future, but to evaluate the probabilities suggested by Elliott Wave rules, guidelines, Fibonacci relationships, channel analysis, and price action.
Ultimately, the market—not the analyst—will decide which scenario is correct.
Has Wave III Already Finished?
My conservative interpretation suggests that Wave III has most likely been completed.
One of the strongest arguments supporting this view is the extension of Wave 5 within Wave III, a characteristic frequently observed in powerful commodity trends such as Gold and Silver.
The termination area also aligns with key Fibonacci projections, channel resistance, and several classical Elliott Wave guidelines, strengthening the probability that the third wave has reached completion.
What Does the Principle of Alternation Suggest?
Within this wave count, Wave II developed as an Expanded Flat correction.
According to the Elliott Wave guideline of Alternation, Wave IV would be expected to develop into a different type of corrective structure, making a classic Zigzag or a complex Zigzag variation the higher-probability outcome.
The current decline also resembles a Leading Diagonal, which could represent the opening phase of Wave A within the larger Wave IV correction.
If this interpretation proves correct, I would expect the market to complete a three-wave corrective recovery (Wave B) before another impulsive decline develops as Wave C, completing the entire Wave IV correction.
Why I Still Treat Every Rally as Corrective
One of the most common mistakes in market analysis is assuming that every strong rally marks the beginning of a new bullish trend.
From my perspective, every bullish advance should be considered corrective until price successfully breaks and holds above the previous major high.
Corrective rallies are often sharp, fast, and emotionally convincing. They frequently create the illusion of a renewed uptrend while remaining nothing more than part of a larger corrective structure.
For that reason, I remain focused on market structure rather than market emotion.
Why the Final Fifth Wave Remains a Valid Possibility
There is another reason why I continue to keep the bullish fifth-wave scenario open.
Historically, Silver has often demonstrated stronger relative momentum than Gold during the later stages of precious metals bull markets, although this relationship is not consistent in every cycle.
That historical tendency leaves room for Silver to complete one final impulsive advance before the larger-degree Wave (I) reaches completion.
At the same time, Elliott Wave also provides another important guideline.
When Wave III becomes exceptionally extended, the following Wave V may occasionally terminate as a truncated fifth wave, failing to produce a significant new high before a major reversal begins.
The exceptional expansion of Waves I and III, illustrated on this chart, keeps both possibilities technically valid.
If Wave IV completes while respecting its initial invalidation level, I will begin monitoring the development of the final impulsive advance.
Whether that advance produces a new all-time high or ends as a truncated fifth wave will ultimately be determined by market structure—not personal expectation.
My Analytical Framework
Every chart I publish follows the same objective process:
Elliott Wave Rules
Elliott Wave Guidelines
Fibonacci Relationships
Channel Analysis
Price Action
These principles are never applied selectively.
If market structure invalidates a wave count, the wave count must change.
In Elliott Wave analysis, flexibility is not weakness—it is respect for market reality.
Why I Share My Research
My objective has never been to prove that I am right.
Every chart I publish is part of an ongoing effort to better understand collective market behavior through Elliott Wave Principle.
Sometimes the market validates a wave count.
Sometimes it invalidates it.
Both outcomes are equally valuable because both contribute to a deeper understanding of market structure.
In Elliott Wave analysis, no wave count is sacred. The only thing that matters is the structure the market ultimately builds.
That is why I have always believed:
Facts always win.
Ralph Nelson Elliott left behind a remarkable legacy for generations of market analysts and researchers.
Nearly a century later, his work continues to provide one of the most comprehensive frameworks for understanding collective market behavior.
This publication is shared as a small tribute to that legacy.
I am Mehdi Abbasi, an independent Elliott Wave researcher from Iran, also known as Mr. Nobody.
For more than seven years, I have dedicated my work to studying, practicing, and researching Elliott Wave Principle.
Every chart I publish becomes part of my public research record, and I prefer to let the market—not my words—evaluate the quality of that work over time.
I will continue following this structure objectively and revise my analysis whenever market structure requires it.
Because in the end...
The market always has the final word.
Facts always win.
Patterns whisper. I listen.
— Mr. Nobody 🎧📊
Silver / U.S. Dollar
Sep 5, 2023
Flat Corrective
CFDs on Silver (US$ / OZ)
Sep 13, 2023
Corrective Flat Done ?Market Continue Downside!
Silver / U.S. Dollar
Oct 13, 2023
Second wave completed!! Three waves down, three waves up!!
Silver / U.S. Dollar
Mar 5, 2024
Possible idea in silver bull market
May 27, 2024
The first idea: Silver is a Flat expanded corrective pattern
Silver / U.S. Dollar
May 21, 2025
“Silver on the Edge – Is Wave 5 Loading?”
Silver / U.S. Dollar
May 19
XAGUSD | 4H Wave Map — A Two-Layer Look at Structure
Short 
Gold Elliott Wave Analysis (GC1!) | Has the Impulse Cycle Ended?Financial markets are rarely random.
Behind every candlestick lies the collective psychology of millions of market participants, and over time, that psychology tends to organize itself into recognizable structures. Elliott Wave Principle is not simply a forecasting tool—it is a framework for studying collective market behavior through objective price structure.
This analysis is shared in that spirit.
It is not a prediction. It is an ongoing research study based on Elliott Wave rules, guidelines, Fibonacci relationships, channel geometry, and price action. The market—not the analyst—will ultimately determine which scenario is correct.
Why I Believe the Impulse Phase Has Ended
My current wave count suggests that the entire impulsive cycle has already been completed.
From an Elliott Wave perspective, Wave (5) has finished across three consecutive degrees (5 of 5 of 5). Until every lower-degree subdivision is complete, an impulse cannot be considered finished. However, when multiple fifth waves terminate simultaneously, the probability of a completed impulse increases significantly.
The termination area also aligns with major Fibonacci projections, channel resistance, and several classical characteristics of an extended fifth wave.
For these reasons, my primary assumption is that Gold has transitioned from an impulsive phase into a higher-degree corrective phase.
Interpreting the Current Decline
The recent decline appears to resemble a Leading Diagonal, which may represent the opening leg of a much larger correction.
If this interpretation is correct, the correction is still incomplete.
Any bullish recovery from current levels should therefore be treated with caution. Unless price breaks and successfully holds above the previous all-time high, every rally should be viewed as a corrective advance, rather than the beginning of a new impulsive uptrend.
Corrective rallies are often sharp, fast, and emotionally convincing. They frequently create the illusion that a new bullish trend has begun, while structurally remaining part of a larger corrective sequence.
Should this scenario continue to unfold, I expect the current recovery to develop as Wave B, followed by a bearish impulsive Wave C that completes the higher-degree correction.
The Previously Published Aggressive Scenario
The aggressive scenario that I shared previously remains my primary working scenario.
This analysis is not intended to replace it. Instead, it presents another structural interpretation built upon the same Elliott Wave principles and guidelines.
An important observation is that both wave counts currently anticipate the same three-wave corrective structure. At this stage, there is no meaningful difference in the expected short-term price behavior.
The distinction lies in the degree of the correction and its position within the larger market structure—something that only the market itself will reveal as the pattern continues to develop.
For that reason, my focus remains on objective price behavior, not on defending a preferred wave count.
My Analytical Framework
Every chart I publish follows the same objective process:
Elliott Wave Rules
Elliott Wave Guidelines
Fibonacci Relationships
Channel Analysis
Price Action
These principles are never applied selectively.
If market structure invalidates a wave count, the wave count must change.
In Elliott Wave analysis, flexibility is not weakness—it is respect for market reality.
Why I Share My Research
My goal has never been to prove that I am right.
Every published chart is part of an ongoing effort to better understand collective market behavior through Elliott Wave Principle.
Sometimes the market validates a wave count.
Sometimes it invalidates it.
Both outcomes are equally valuable because both provide information.
In Elliott Wave analysis, no wave count is sacred. The only thing that matters is the structure the market ultimately builds.
That is why I have always believed:
Facts always win.
Ralph Nelson Elliott devoted his life to studying recurring market behavior.
Nearly a century later, his work continues to provide one of the most sophisticated frameworks for understanding financial markets.
This publication is shared as a small tribute to that legacy.
I am Mehdi Abbasi, an independent Elliott Wave researcher from Iran, also known as Mr. Nobody.
For more than seven years, I have dedicated my work to studying, practicing, and researching Elliott Wave Principle.
Every chart I publish becomes part of my public research record, and I prefer to let the market—not my words—evaluate the quality of that work over time.
I will continue following this structure objectively and will revise my analysis whenever market structure requires it.
Because in the end...
The market always has the final word.
Facts always win.
Patterns whisper. I listen.
— Mr. Nobody 🎧📊
Gold Spot / U.S. Dollar
Sep 18, 2023
If the triangle pattern is running correctly?!
Gold Spot / U.S. Dollar
Oct 16, 2023
Wave 2 Complete ! Bullish Market Ready !
Gold Futures
Jun 25, 2024
Triangle sideways pattern in the fourth wave
Gold Spot / U.S. Dollar
May 17
Gold 4H: Leading Diagonal or Just the Beginning?
Short 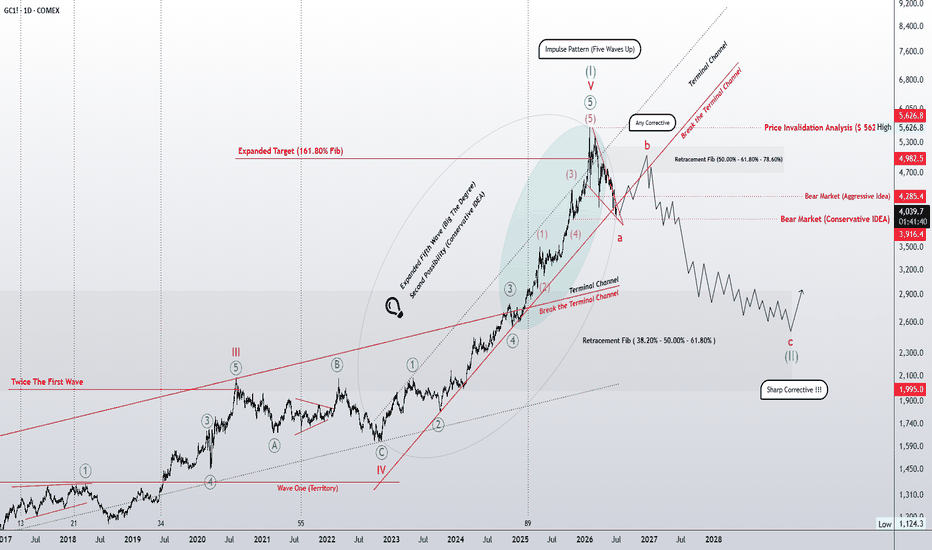
Long 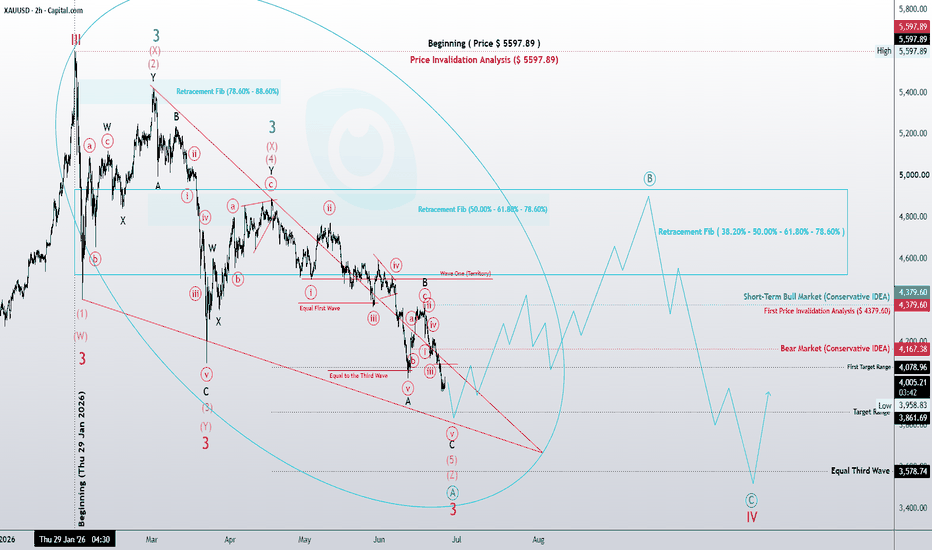
XAUUSD: Leading Diagonal Completed – Wave B Rebound AheadXAUUSD — 4H (Leading Diagonal Update)
According to The Wave Principle, the recent bearish sequence has concluded as a textbook Leading Diagonal within Wave (A). The internal geometry is highly consistent: Wave 5 reached the 61.8% Fibonacci projection of Wave 3, and Wave 3 remained longer than Wave 1, validating the structural integrity of the diagonal.
The market is now expected to transition into a three-wave corrective rebound for Wave (B) to retracing the preceding diagonal.
Primary Scenario (Aggressive Idea):
Following the completion of Wave (A), the focus shifts to a corrective structure (Wave B). Potential upside targets for this retracement lie within the 50.00% - 78.60% Fibonacci zones, near the 4,338 - 4,478 levels. Once this corrective phase is exhausted, a final impulsive decline in Wave © is anticipated to complete the Classic Zigzag structure.
Revision Scenario:
The low at 4,023 (Wave A terminal) serves as the immediate invalidation level. A sustained break below this point would suggest an extension of Wave 5 or a structural shift. The ultimate invalidation for the entire corrective roadmap remains at 5,602.
Patterns whisper, and I listen.
The Wave Principle reflects the social nature of markets.
— Mr. Nobody
Gold Spot / U.S. Dollar
May 17
Gold 4H: Leading Diagonal or Just the Beginning?
Long 
NDQ 1W — Expanded Fifth Wave structure within a Terminal ChannelThis analysis is conducted strictly under The Wave Principle, adhering to its core rules and guidelines to ensure structural integrity in wave interpretation.
From a market sentiment perspective, price action reflects the collective psychology of the crowd within an extended bullish phase. The current geometry highlights the social mood’s tendency to sustain the prevailing trend through recognizable patterns.
Primary Scenario (Aggressive):
The outlook is centered on an Expanded Fifth Wave structure, developing as either a Leading Diagonal or a series of nested (1-2) sequences. Price remains confined within a Terminal Channel, pointing toward mid-to-long-term targets at 42,038 and 55,717. In a more conservative view, price stability within the 14.6% - 23.6% Fibonacci retracement zones is vital for trend persistence.
Revision Scenario:
In the worst-case scenario, a breach below the critical structural level of 22,986 will invalidate the current count. Based on the latest understanding of the patterns, the wave structure will then require a complete reassessment and revision.
Patterns whisper, and I listen.  Long
Long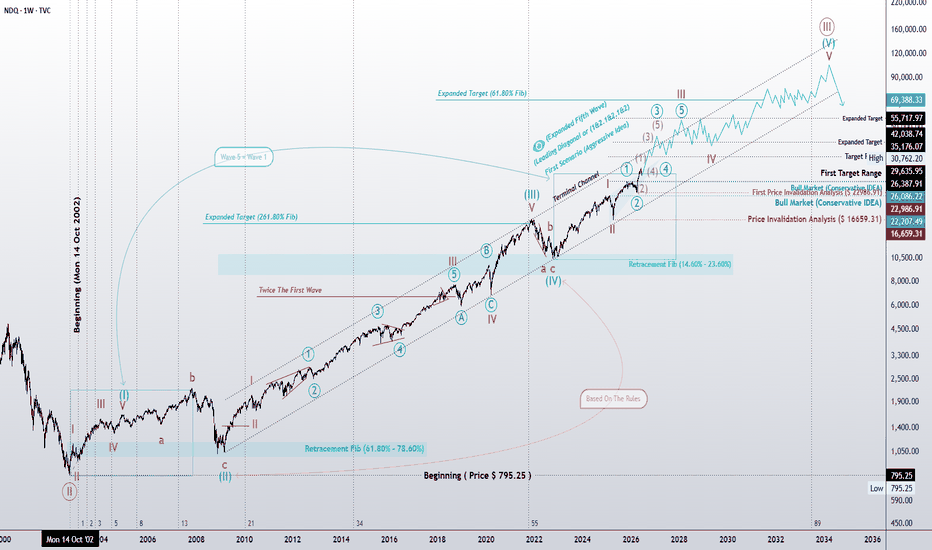
DXY Structural Analysis: Navigating the DiagonalOverview:
In the 4H timeframe, the Dollar Index (DXY) is currently navigating the corrective phase of a larger structure. We are positioned within Wave 4 of a Leading Diagonal. Our primary working hypothesis dictates that this consolidation will resolve into a Zigzag formation to finalize the current market cycle.
The Structural Thesis:
We are avoiding the “retail trap” of looking for simple directional trends. Instead, we are focused on the internal geometry of the structure. We are currently evaluating two distinct paths, characterized by a “Structural Swap” technique—a critical filter to identify potential liquidity traps before they manifest:
Scenario A (The Standard Progression): A Leading Diagonal (Wave A) followed by a corrective Wave B, culminating in a robust Impulse (Wave C).
Scenario B (The Inverted Structural Swap): An Impulse (Wave A) followed by a correction, culminating in a Leading Diagonal (Wave C).
This flexibility is not about guessing; it is about risk management. By identifying the structural maturity of Wave A, we define our exposure limits for the subsequent Waves. If the structural integrity of this Wave 4 is violated, the thesis is immediately invalidated, preventing unnecessary drawdown.
Critical Pivot Levels:
These are not just numbers; they are the boundaries of our structural thesis:
$109.881: Primary Invalidation/Resistance (The Ceiling).
$104.448: Target Extension.
$102.483: Key Structural Target.
$100.518: Initial Target.
$99.124: Conservative Upside Pivot.
$97.342: First Structural Invalidation (Early Warning).
$95.240: Final Invalidation/The “Mr. Nobody” Threshold.
Final Assessment:
Retail traders often rely on static Fibonacci extensions. At the institutional level, we rely on proportional expansion and structural maturity. Whether we see the Diagonal early in Wave A or late in Wave C, the destination remains congruent with our long-term cycle analysis. We monitor, we wait for the structural confirmation, and we trade the geometry.
— Mr. Nobody Long 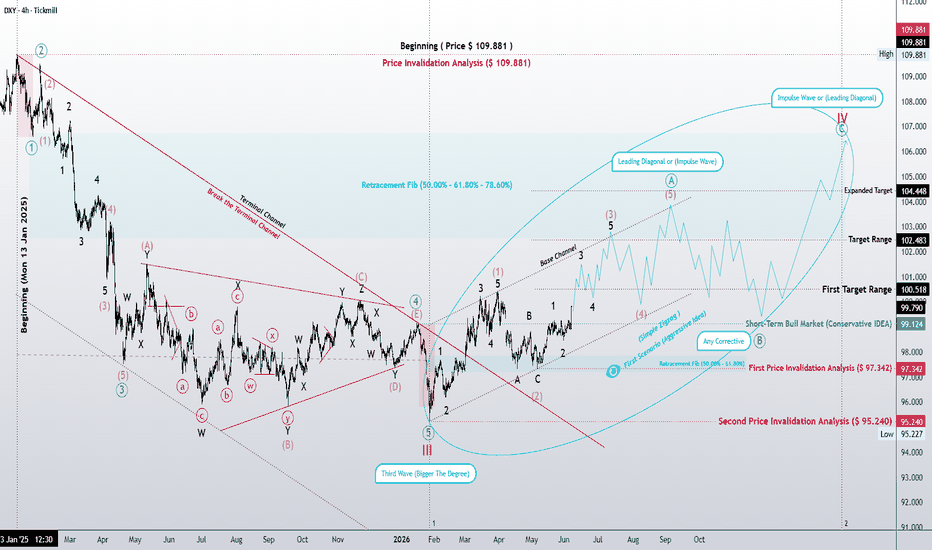
Short 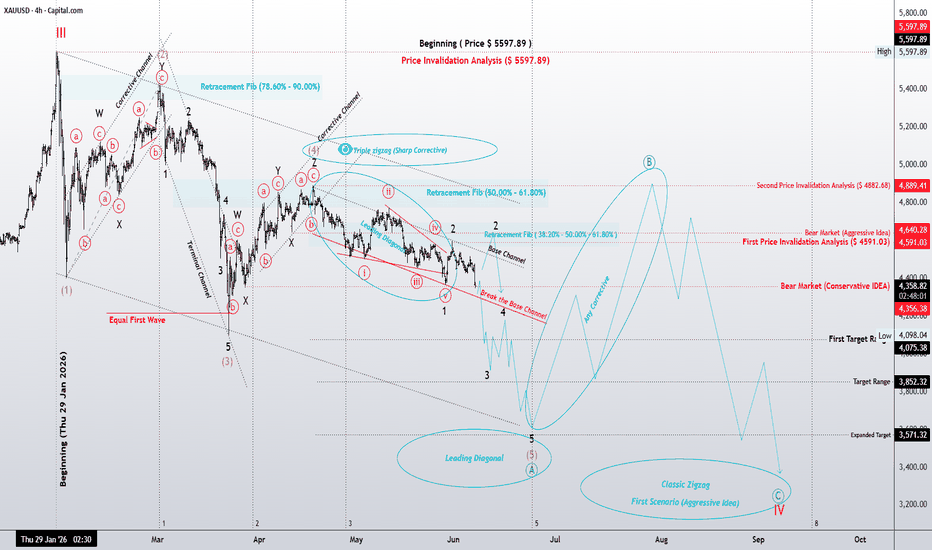
NATGAS — The Diagonal Trap & The Second Wave QuestionThis count is built on Elliott Wave rules and the guidelines shown on the chart. I’m treating the first leg as a Leading Diagonal in wave (1) (compression, overlap, and the typical 5-3-5-3-5 rhythm). Inside a Leading Diagonal, waves 1/3/5 can look motive, but the whole structure is still a Diagonal, not a standard Impulse.
Educational note (why there are two scenarios)
The core question here is simple: is the post-diagonal correction a Zigzag or a Flat (especially an Expanded Flat)?
That’s why two scenarios stay valid until price breaks the rules:
A clean, direct correction favors a Zigzag.
A fast sweep above the prior peak followed by a sharp dump often supports an Expanded Flat (liquidity grab behavior).
Market psychology
In diagonal/corrective environments, the market isn’t “trending” — it’s negotiating. It tests patience, hunts liquidity, and once structure is complete… continuation can appear suddenly and aggressively.
The plan (only while the rules hold)
Aggressive: correction is complete and price transitions into a new motive sequence after a clear break of the corrective rhythm/channel.
Conservative: one more corrective rotation (Flat/Zigzag) before the larger bullish continuation.
Invalidation / structure: the key invalidation levels marked on the chart are non‑negotiable. Without them, it’s not analysis — it’s a story.
Patterns whisper. I listen.
— Mr. Nobody
 Long
Long
The Whisper of a Leading Diagonal in the Energy Market🌊 The Whisper of a Leading Diagonal in the Energy Market
Sometimes the market doesn’t shout.
It whispers.
We saw that whisper in crude oil.
A Leading Diagonal formed —
an early structural footprint that often appears at the beginning of a major trend.
And now, natural gas may be telling a similar story.
Why a Leading Diagonal?
Because the structural rules are respected:
Wave 2 does not retrace 100% of Wave 1 ✅
Wave 4 overlaps Wave 1 ✅
Wave 3 is not the shortest ✅
More importantly, the internal price action is compressed yet progressive —
a market building pressure, not releasing it.
That’s not distribution.
That’s structural preparation.
Is the Current Correction Complete?
If we interpret the recent move as a Double Zigzag,
with a full seven-swing corrective sequence,
then we are potentially looking at a completed corrective structure.
Under this interpretation:
✅ The aggressive scenario becomes active
❗ Unless price breaks below the first invalidation level:
First Price Invalidation = $2.6698
That level is non‑negotiable.
Markets may be complex.
They are never lawless.
The Conservative Perspective
From a conservative standpoint,
price could still revisit the first black target zone and decline once more.
Or at the next target area,
we may see a sideways corrective formation
before a deeper pullback unfolds.
Energy markets are cyclical.
And before expansion, they often breathe.
The Structural Confirmation
Oil and gas are both strengthening structurally.
If crude confirms its bullish development,
natural gas is likely to follow.
However, the X wave within the Double Zigzag must:
Break the corrective rhythm decisively
Show impulsive intent
Hold above the $2.6698 invalidation level
Only then can we confidently anticipate sustained upside continuation.
A Personal Note
I am a lifelong student of Elliott Wave.
I listen to the waves behind the chart.
And I translate their language through structure.
But remember this:
The market is a strict law enforcer.
Unforgiving.
Certain.
And extremely expensive when ignored.
It respects discipline.
It punishes deviation.
Clear, concise rules are essential —
especially in chaotic conditions.
Success lies not in prediction alone,
but in consistent adherence to structure.
The market may not always be predictable.
But it is always lawful.
Long 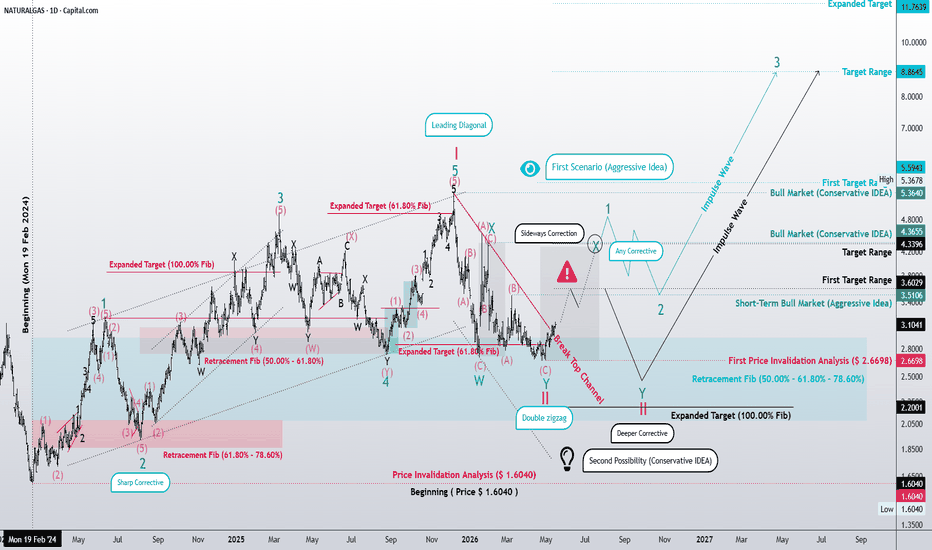
#HYPE Is Building a Massive Move –But first, a Painful Shakeout?
Yello Paradisers! Are you prepared for another classic rising wedge trap in #HYPE that could wipe out impatient traders before the real move even begins?
💎#HYPEUSDT is forming a rising wedge after a prolonged downtrend, and this is where things get interesting. Many traders see bullish continuation, but this structure is more complex and demands precision.
💎This is not just a standard rising wedge. It is a leading diagonal, typically signaling the early stage of a new impulsive structure. This suggests that even if the crypto market remains in a broader downtrend, a long-term reversal could already be quietly developing. It is showing clear relative strength against the broader market. Strong assets tend to lead when conditions shift, and #HYPE is positioning itself as a potential leading horse.
💎From an Elliott Wave perspective, wave 4 appears complete, and wave 5 is now forming. This wave is subdividing into three waves, with waves 1 and 2 already completed. The current move is likely wave 3, which should push the price toward the upper wedge boundary near $50, acting as minor resistance. The RSI indicator is showing divergence, which is an added confluence.
💎The key level to watch is the major resistance at $54. A clean break above this level would invalidate the short-term bearish bias and shift momentum toward bullish continuation.
On the downside, minor support sits at $32, while major support rests at $25 in case of an extended move.
💎Rising wedges often resolve with sharp downside moves. So while the long-term outlook for #HYPE remains bullish, this structure is likely a corrective phase that still offers short-term trading opportunities.
💎The bigger picture remains intact. This leading diagonal signals a developing long-term uptrend, but corrections are necessary. We will reassess after a pullback and look to shift fully bullish for the next major move.
Paradisers, strive for consistency, not quick profits. Treat the market as a businessman, not as a gambler.
MyCryptoParadise
iFeel the success🌴  Short
Short
Silver Pushed Higher| But the Chart Is Starting to DisagreeAs I expected in the previous idea , Silver ( OANDA:XAGUSD ) started to rise and reached all its targets (full target).
At the moment, silver is moving near a resistance zone ($79.56-$77.54), and we can see negative Regular Divergence (RD-) between consecutive peaks.
From an Elliott Wave perspective, it seems silver is forming a leading diagonal in the recent upward move, and we could expect a downward correction wave to complete.
I expect silver to drop at least to around $72.56, and if the lower line of the leading diagonal breaks, we can expect further decline.
First Target: $72.56
Second Target: $71.10
Stop Loss(SL): $80.00
Points may shift as the market evolves
What’s your view on silver? Could it rise above $80 next week, or should we expect another drop?
💡 Please respect each other's opinions and express agreement or disagreement politely.
📌 Silver/ U.S. Dollar Analyze (XAGUSD), 4-hour time frame.
🛑 Always set a Stop Loss(SL) for every position you open.
✅ This is just my idea; I’d love to see your thoughts too!
🔥 If you find it helpful, please BOOST this post and share it with your friends. Short 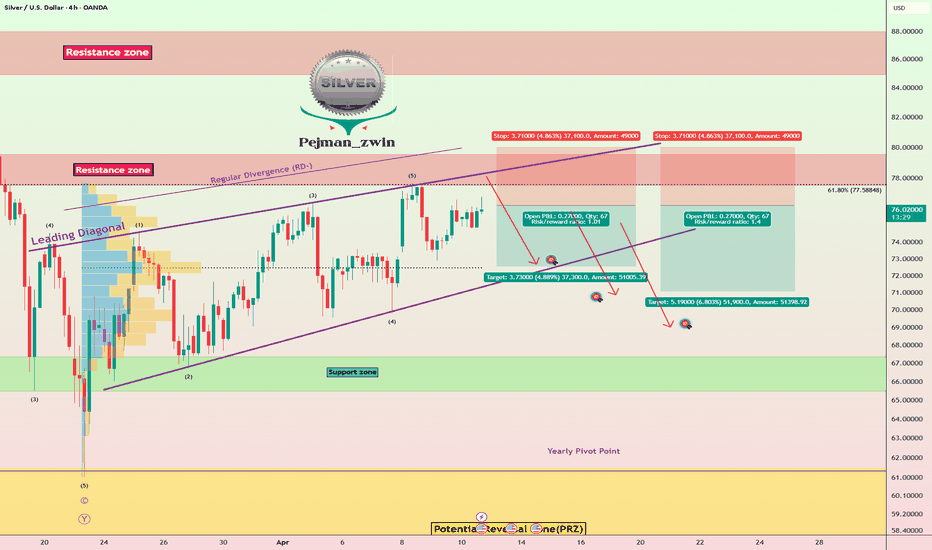
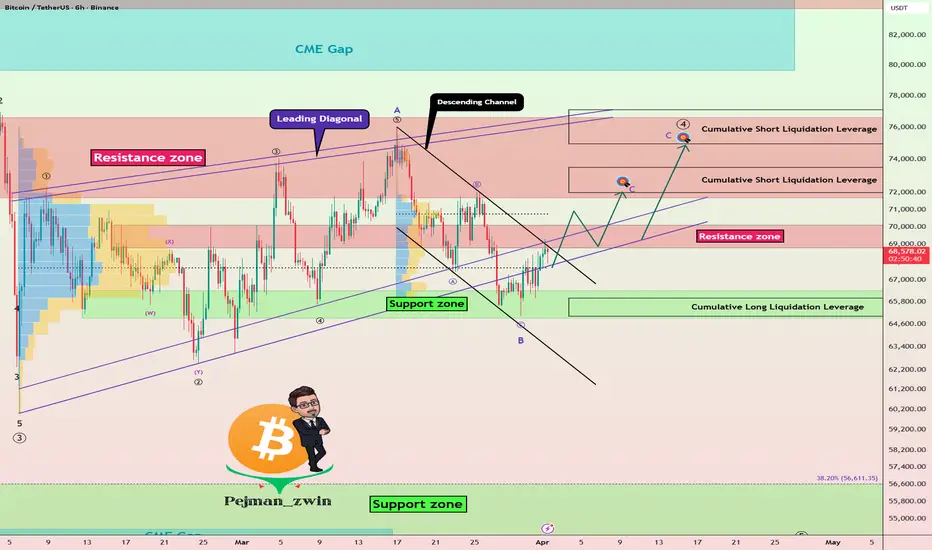
Bitcoin RoadmapToday, I want to share with you a mid-term outlook on Bitcoin ( BINANCE:BTCUSDT ) by analyzing it in a higher time frame—specifically, a 6-hour time frame—which could trigger a bullish move for Bitcoin, so stay with me.
In general, financial market movements over the past month have been heavily influenced by the military conflict in the Middle East, as well as statements by politicians like Trump, which can rapidly shift the direction of financial markets. On the other hand, financial markets, like gold( OANDA:XAUUSD ), the S&P 500 index( FX:SPX500 ), and crypto, have shown a high correlation and tend to pump or dump together.
Bitcoin is currently trying to break the resistance zone($70,100-$68,790) and the upper line of the descending channel, which I believe will happen in the coming hours.
From an Elliott Wave theory perspective, considering Bitcoin’s movements over the past two months, it seems that Bitcoin completed its main wave A as a leading diagonal, and the main wave B is forming inside this descending channel. Thus, we can expect a bullish impulsive wave after breaking the upper line of the descending channel.
I expect that Bitcoin will be able, in the coming hours, to break the upper line of the descending channel and continue a bullish move, rising at least up to the Cumulative Short Liquidation Leverage($73,510-$72,000).
First Target: Cumulative Short Liquidation Leverage($73,510-$72,000)
Second Target: Cumulative Short Liquidation Leverage($77,880-$74,950)
Stop Loss(SL): $65,980
Points may shift as the market evolves
Cumulative Long Liquidation Leverage: $66,000-$65,000
CME Gap: $84,560-$79,660
Note: Any news or escalation of the Middle East conflict can cause a sudden shift in Bitcoin’s trend, so, once again, manage your capital carefully in your trades.
Note: Given that the S&P 500 index is currently bullish—my personal analysis of the S&P 500 is that it is bullish—and considering Bitcoin’s strong correlation with it, the rise in the S&P 500 could lead to a rise in Bitcoin as well.
What do you think about Bitcoin—can it rise above $70,000, or will we see another decline again?
💡 Please respect each other's opinions and express agreement or disagreement politely.
📌Bitcoin Analysis (BTCUSDT), 6-hour time frame.
🛑 Always set a Stop Loss(SL) for every position you open.
✅ This is just my idea; I’d love to see your thoughts too!
🔥 If you find it helpful, please BOOST this post and share it with your friends.  Long
Long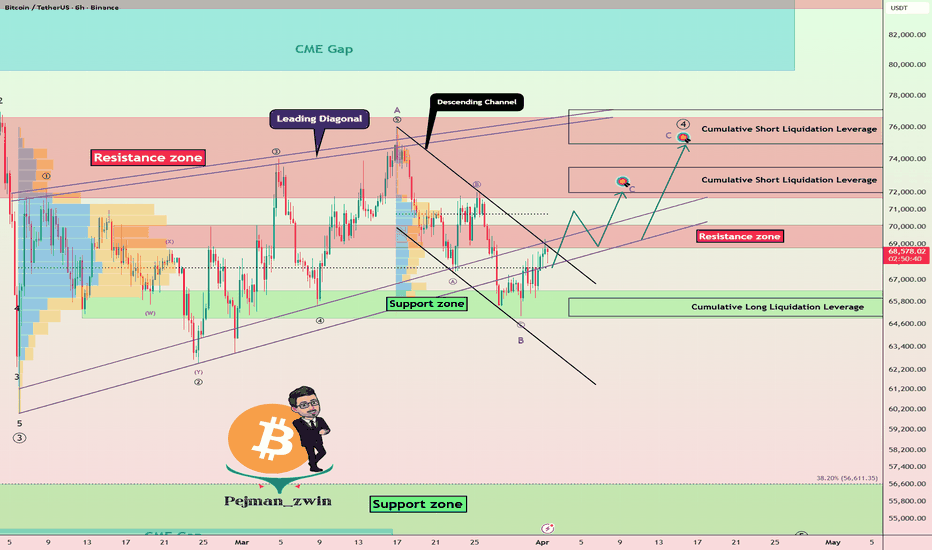
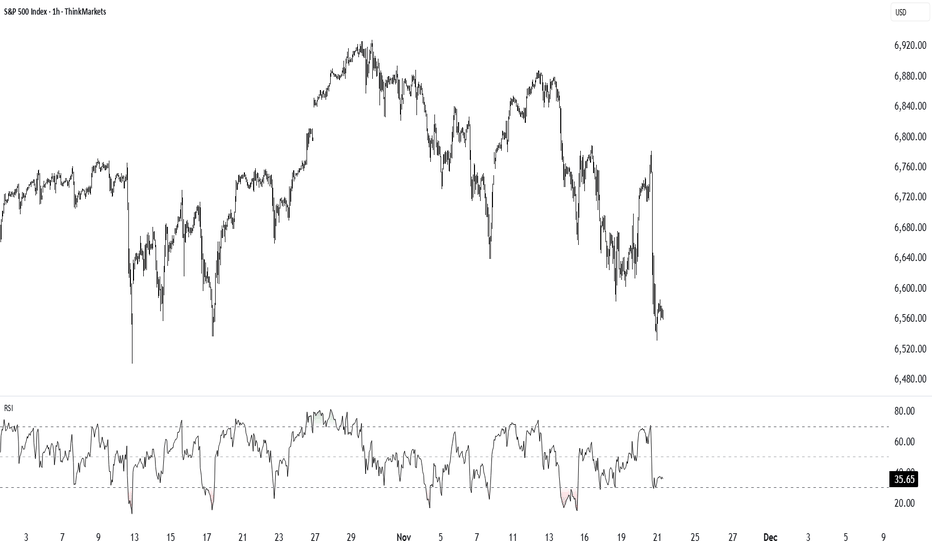
S&P500 crashes! Due relief rally or further pain?Nvidia delivered impressive earnings, but the stock reversed and closed nearly 3% lower, triggering heavy selling across tech and risk assets as odds for a December rate cut have collapsed to just 34%, with policy uncertainty amplified by the cancelled October NFP report. Despite a strong market and rising unemployment in September's NFP report, traders remained defensive and fuelled the declines.
Key drivers:
Nvidia beat earnings, but post-report selling intensified sector losses.
The Fed’s odds for a December rate cut have dropped to 34%, amplifying caution.
The abrupt cancellation of the October NFP means the market lacks fresh labour data, fuelling defensive positioning.
S&P 500, Nasdaq, and Bitcoin broke major supports, confirming risk-off conditions.
Right now, the S&P 500 has broken below channel support near 6,600 and failed to climb back in. If prices stay below this threshold, expect another sharp move lower targeting 6,500 and possibly 6,350. There’s potential for upside, given momentum divergence on the RSI 4-hour chart. If we see a short-term bounce and a return to the channel, a move toward 6,682 is possible, which sets up a tactical short opportunity.
Trade idea:
Entry: Midpoint of 23.6/38.2 Fibonacci (6,655–6,682 area)
Stop-loss: Above 61.8% Fib (6,775)
Take Profits: TP1 6,500 (recent low/support), TP2 6,440 (major support), TP3 trail stop to 6,170 (long-term support)
Risk-off drivers are in control. Earnings reversals, Fed uncertainty, and cancelled NFP data are fuelling this price action. Technically, it comes down to whether we see a return inside the channel for a relief bounce or a sharp continuation downward.
Watch your levels, remain nimble, and let fundamentals and technicals, not emotions, guide your trade.
Let me know your setups in the comments, and follow for more high-action technical and macro trade ideas.
This content is not directed to residents of the EU or UK. Any opinions, news, research, analyses, prices or other information contained on this website is provided as general market commentary and does not constitute investment advice. ThinkMarkets will not accept liability for any loss or damage including, without limitation, to any loss of profit which may arise directly or indirectly from use of or reliance on such information.  Short
Short