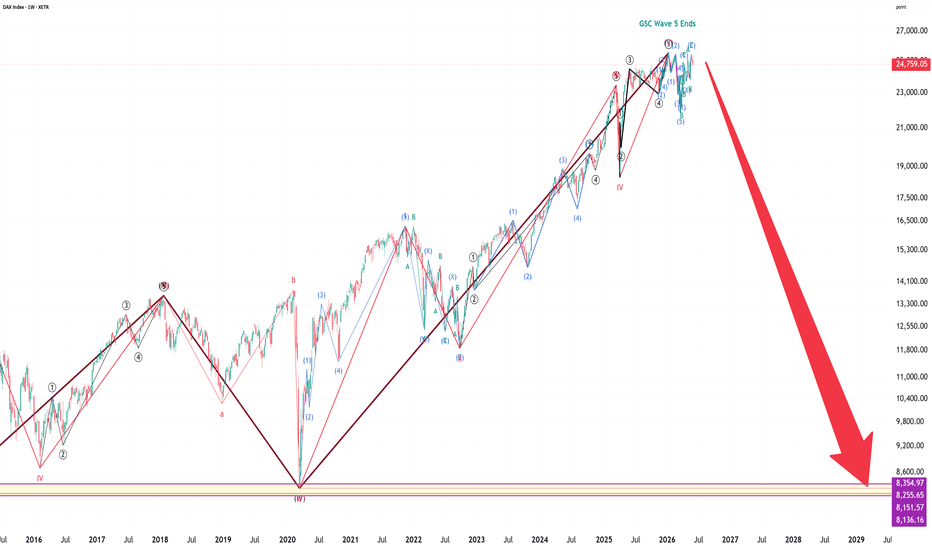
DAX Elliott Waves Analysis: End of Grand Super Cycle Bull MarketIn this video, I analyzed the Germany DAX index on a Grand Super Cycle (GSR) level starting from 1970s. Alarmingly, this analysis tells me that DAX GSR bull market has ended in Jan 2026. What follows will then be a fall to March 2020 low region where I brought up the importance of that price region as a support.
DAX has recently completed it's first sub-wave 1 and sub-wave 2 down and is currently on sub-wave 3 down. I expect a wave 3 type of crash for DAX, similar to Nikkei, S&P500, and Nasdaq.
Good luck!
Elliott Wave
Crude Oil: The Long-Term Elliott Wave ProjectionCrude Oil: The Long-Term Elliott Wave Projection
Let’s be honest—if you tell most traders today that crude oil could someday trade around 430 USD, 766 USD, or even 840 USD per barrel, they will likely say: “That is impossible.”
From today’s perspective, it does sound extreme. However, history teaches us that markets have a way of embarrassing the crowd.
History Favors the Unbelievable
When Ralph Nelson Elliott developed his wave theory in the 1930s, the idea that the Dow Jones could recover from the Great Depression and enter a massive, multi-decade bull market was met with deep skepticism. Similarly, years ago, the idea of Bitcoin trading at 120,000 USD would have been dismissed as absurd.
This leads to one critical lesson: In financial markets, disbelief is often the precursor to a major expansion.
The Elliott Wave Perspective
This chart visualizes crude oil inside a significant market cycle. From an Elliott Wave perspective, we are likely moving through the final stages of a massive impulsive structure—what we define as the final fifth wave.
In this theory, wave five is often the emotional climax of the cycle. It is the stage where supply shortages, geopolitical shocks, and panic-buying converge, pushing prices into “extreme” territory.
The Targets
The 766 USD target is not a random number; it is an expanded Fibonacci target based on the structural relationship of previous waves. While it sounds massive today, markets do not care about what feels comfortable. They care about structure, time, and global macro conditions.
Risk Management and Invalidation
To be clear, this does not mean crude oil must reach these targets tomorrow. Markets do not owe anyone anything.
That is why invalidation levels are essential. In this analysis, 61.09 USD and 25.71 USD act as our key structural guardrails. If price breaks these levels in a way that violates the wave count, we must accept that the current scenario is invalid and adjust our analysis accordingly.
Professional analysis is not about predicting with ego. It is about building scenarios, defining the invalidation points, and respecting the market structure at all times.
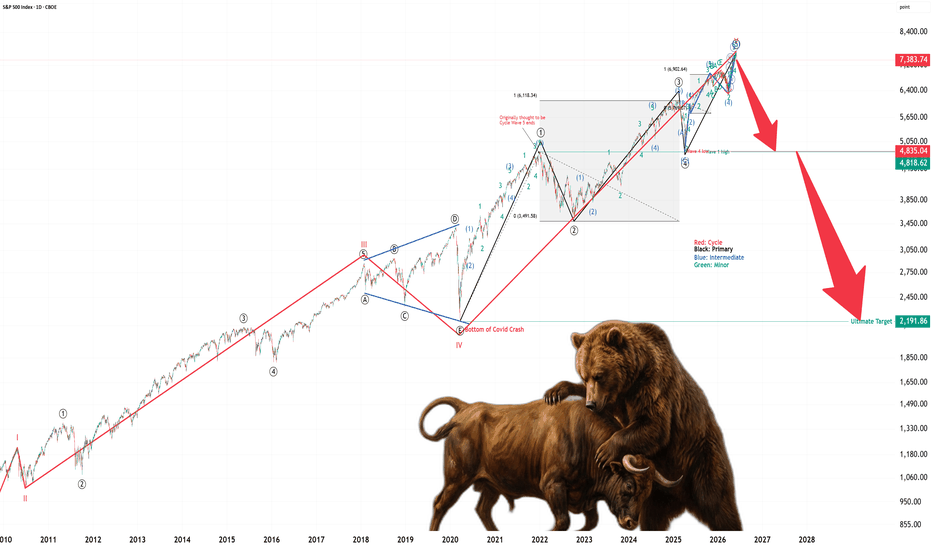
SPX Elliott Wave Cycle Level Study: The Beginning of Bear MarketIn this video, I talk about the big picture for S&P500 using SPX. The entire wave that starts from March 2009 and ended on June 2026. I discussed the huge wave structure, the Fibonacci extension levels, and the breakdown of the sub-waves for the final cycle wave 5.
Essentially, the warning here is that we can see SPX going down another 2500 points to 4835 as the initial target, and potentially going down even more to 2020 March low of 2192.
Be careful out here.
Good luck!
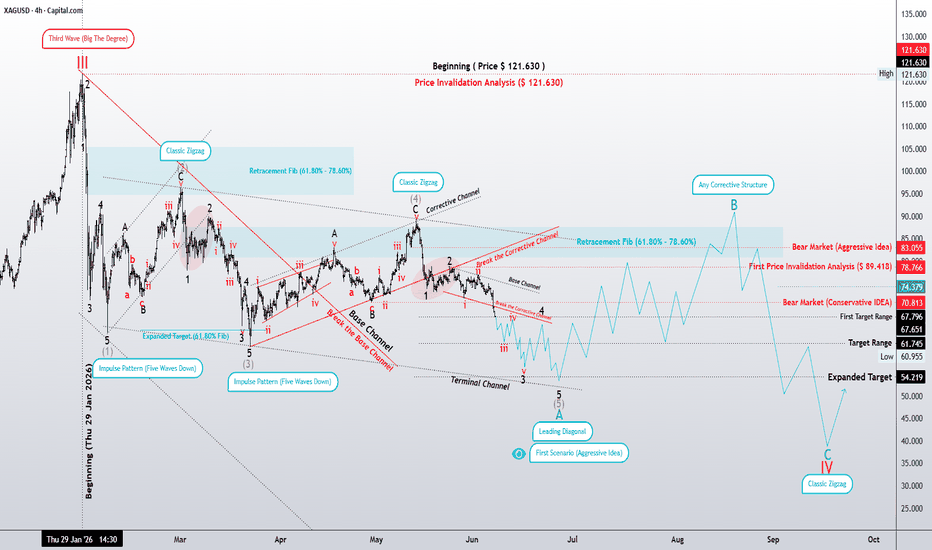
XAGUSD — Patience Before the TurnThere are phases in the market where movement looks dramatic, yet structure is still incomplete.
Silver is currently in one of those phases.
Many traders are anticipating a reversal. The price is approaching levels that feel “cheap.” But markets do not reverse because something feels cheap. They reverse when structure completes.
Right now, structure is still unfolding.
1️⃣ Crowd Psychology
The crowd loves early bottoms.
Not confirmed bottoms — early ones.
The emotional urge to “catch the turn” is strongest when volatility increases. That is precisely when discipline must increase as well.
A level alone does not create a reversal.
Completion does.
2️⃣ Structural Thesis
From an Elliott Wave perspective, XAGUSD continues to develop within a broader Zigzag (A‑B‑C) formation.
The current focus is on the terminal phase of Wave 5 of A.
Internally, this fifth wave is maturing as a Leading Diagonal — a structure that often signals exhaustion, but only after its internal subdivisions complete.
The recent interaction with the Base Channel suggests that momentum has not fully dissipated yet. This implies the diagonal may require one more structural push before true exhaustion appears.
Structure first. Reaction later.
3️⃣ Tactical Focus
The working exhaustion zone remains:
61.745–61.745–54.219
This is not a prediction of certainty.
It is a mapped probability zone where Wave 5 of A could finalize, assuming the diagonal structure continues to behave as expected.
Until that structural completion is visible, aggressive positioning remains premature.
Patience here is not inactivity.
It is positioning without exposure.
4️⃣ Behavioral Trap
Most losses do not come from being wrong about direction.
They come from being early.
Entering before completion is like interrupting a sentence halfway and assuming you know the ending.
Markets tend to finish their sentences.
Final Thought
The market does not reward urgency.
It rewards alignment.
For now, Silver is not asking to be chased.
It is asking to be observed.
Structure never lies. It simply unfolds.
— Mr. Nobody
Elliott Wave Researcher
Educational analysis only. Elliott Wave interpretations are probabilistic and subject to change with new data. Risk management remains essential.
Silver / U.S. Dollar May 19: XAGUSD | 4H Wave Map — A Two-Layer Look at Structure
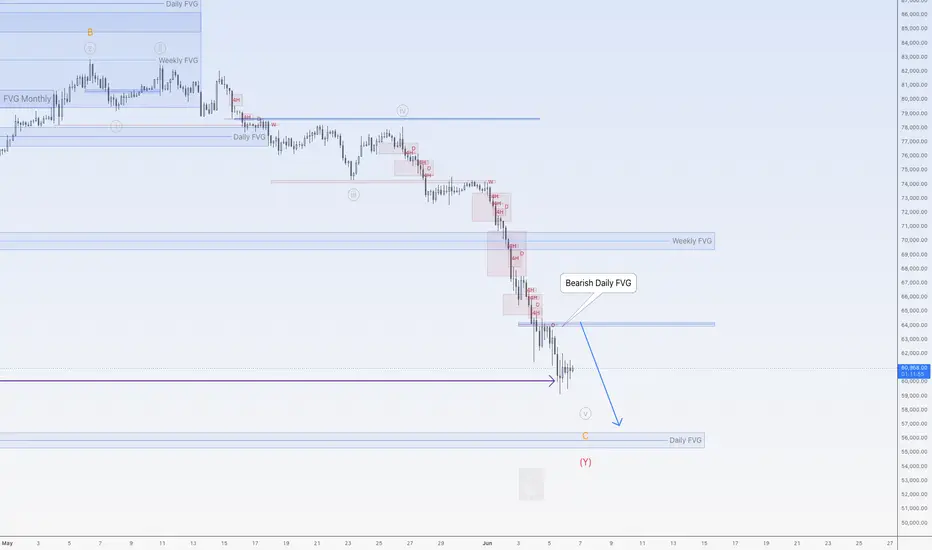
Now Bitcoin is ready to go up (corrective)Hi traders,
Last week Bitcoin melted and broke the swing low of February.
Now the bigger WXY-correction could be completed, but at the moment price is still bearish and it could go down a little bit more.
Let's see what the market does and react.
Trade idea: Wait for a correction up and a change in orderflow to bearish to trade (short term) shorts.
This shared post is only my point of view on what could be the next move in this pair based on my technical analysis.
But I react and trade on what I see in the chart, not what I've predicted or expect.
Manage your emotions, trade your edge!
Eduwave
Still more downside for goldHi traders,
Last week gold didn't close above the bearish Daily BPR and went down (updated wavecount).
Now we could see a correction up and a final downmove to finish the correction.
Let's see what price does and react.
Trade idea: Wait for a correction up and a change in orderflow to bearish on a lower timeframe to trade shorts.
This shared post is only my point of view on what could be the next move in this pair based on my technical analysis.
But I react and trade on what I see in the chart, not what I've predicted or expect.
Manage your emotions, trade your edge!
Eduwave
Big correction down for S&P500Hi traders,
Last week SPX500USD went a little more up to finish wave 5 (updated wavecount) and after that it dropped.
This could be the start of a big correction down into the bullish Monthly FVG.
Let's see what the market does and react.
Trade idea: Wait for a small correction up and a change in orderflow to bearish on a lower timeframe, to trade shorts.
This shared post is only my point of view on what could be the next move in this pair based on my technical analysis.
But I react and trade on what I see in the chart, not what I've predicted or expect.
Manage your emotions, trade your edge!
Eduwave
More downside for EUHi traders,
As I said last week EU made the next move down. I hope you made a nice profit from my analysis.
Next week we could see more downside for this pair to break the purple line (red W-wave).
Let's see what the market does and react.
Trade idea: Wait for a correction up and a change in orderflow to bearish on a lower timeframe for shorts.
This shared post is only my point of view on what could be the next move in this pair based on my technical analysis.
But I react and trade on what I see on the chart, not what I've predicted or expect.
Manage your emotions, trade your edge!
Eduwave
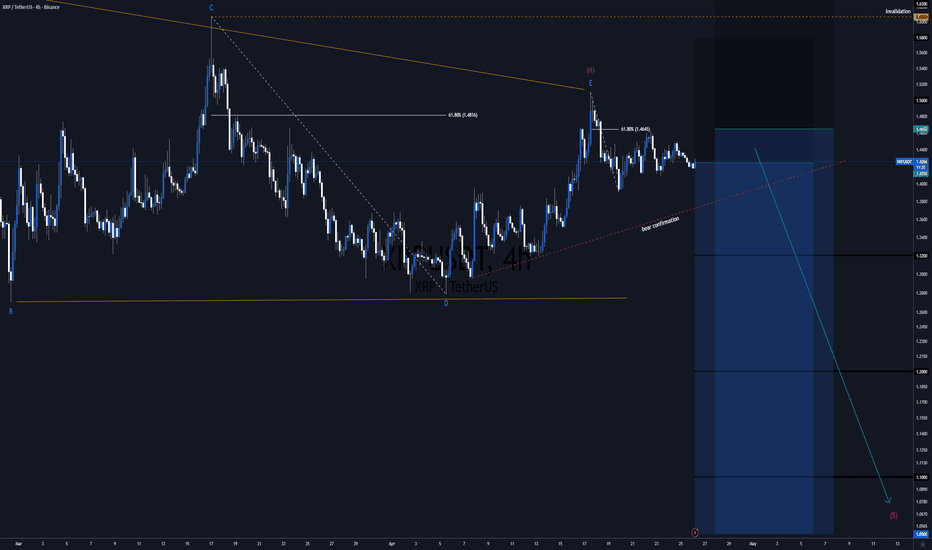
XRP Trade Alert - Bearish ImpulseCRYPTOCAP:XRP Trade Alert - Bearish Impulse
Summary: BITSTAMP:XRPUSD Trade Alert
- CITYINDEX:XRPUSD (#XRP) Bearish Impulse starting.
- BINANCE:XRPUSDT Sell Positions in focus.
Technical Analysis: CITYINDEX:XRPUSD Signal
Chart Structure:
- Descending Triangle
- Intermediate Wave (4) Completion
- Fibonacci Golden Ratio
CRYPTOCAP:XRP Prediction:
- Bearish Impulse
- Intermediate Wave (5)
Ripple ( BITSTAMP:XRPUSD ) Trade Levels
- Ticker: BINANCE:XRPUSDT
- Direction: SHORT
- Market Entry @ $1.4250
- Strategic Entry @ $1.465
- SL@ $1.580 & $1.630
- TP1 @ $1.320
- TP2 @ $1.20
- TP3 @ $1.10 / $1.050
BITSTAMP:XRPUSD 4H Chart
BINANCE:XRPUSDT Daily Chart
* Trade Signals are subject to risk, DYOR.
* Not investment advice, only market commentary.
XAUUSD: Weekly Downtrend Still Points Lower
Gold is still trading inside a broad descending channel, and the weekly structure continues to favour the downside. From Kelly’s view, the latest price action does not yet show a strong reversal signal. Instead, the chart suggests that sellers are still controlling the larger trend, with the market now moving towards lower target zones.
The main idea for next week is simple: gold remains under pressure while price stays below the descending structure.
⟡ Market structure
The broader chart shows a clear sequence of lower highs after the previous peak. Each recovery attempt has been rejected below the upper channel boundary, while price continues to move lower inside the bearish channel.
Gold is now trading around 4,327, after failing to rebuild strength above the mid-channel area. This keeps the weekly bias defensive. The next important downside zone sits around 4,100–4,150, where price may show a temporary reaction. If that area fails, the larger structure could continue towards the deeper target zone around 3,650–3,700.
➤ Key levels
◌ 4,400–4,450: near-term resistance and retest area
◌ 4,327: current weekly reaction zone
◌ 4,100–4,150: Target zone 1 and first major downside support
◌ 3,650–3,700: Target zone 2 and deeper weekly liquidity area
◌ Above 4,550: area where bearish pressure may start to weaken
⌁ Elliott Wave view
From an Elliott Wave perspective, gold appears to be developing a larger bearish wave sequence after completing the previous upside cycle.
The current structure suggests that price may be moving inside a wave 5 decline on the larger timeframe. The earlier wave 3 pushed strongly lower, wave 4 developed as a corrective rebound, and now the market may be extending into the final bearish leg.
If this wave count remains valid, the next major focus is the 4,100–4,150 area first. A stronger wave 5 extension could later open the path towards 3,650–3,700.
▸ Weekly trading scenario
Preferred scenario: wait for sell continuation or a bearish retest before looking for downside follow-through.
Entry zone: 4,400–4,450 if price retests and shows bearish rejection
Stop loss: above 4,550
Take profit 1: 4,100–4,150
Take profit 2: 3,650–3,700
Alternative scenario: if gold reclaims 4,550 and holds above the descending channel pressure, the bearish weekly count would weaken and the chart may need a more neutral reassessment.
⌁ Kelly’s view
For Kelly, this is still a bearish continuation structure. The market is not showing enough strength to confirm a weekly bullish reversal, and the descending channel remains the main guide for direction.
The cleaner approach is not to chase price at the low, but to wait for a controlled retest or clear continuation signal.
Gold remains under weekly pressure.
Until resistance is reclaimed, the next meaningful move may still be lower.
Share your view below.
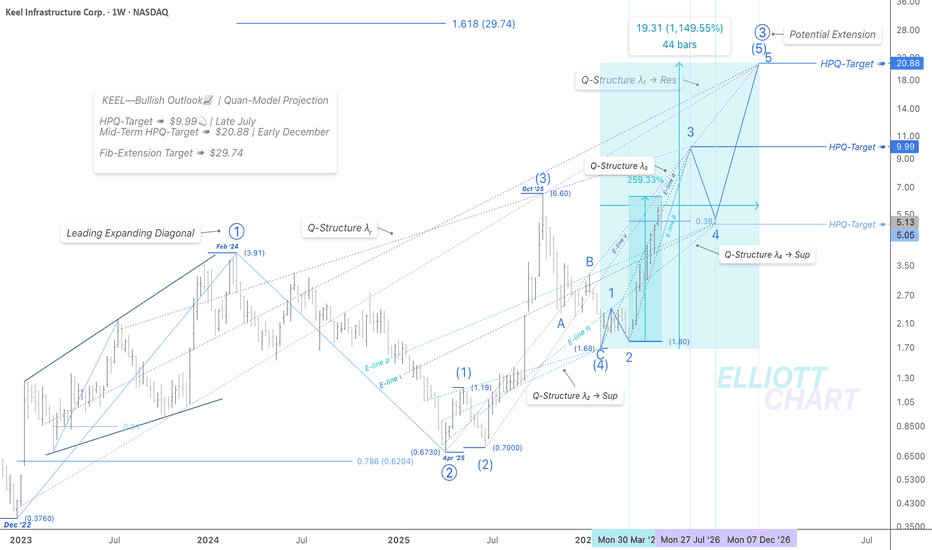
KEEL | WeeklyNASDAQ:KEEL — Quan-Model Projection
Bullish Outlook | Advancing Phase 📈
KEEL continues to develop its advancing structure, progressing cymatically along the defined
E-lines of the projected trajectory—surging approximately 260% since late March.
With price action holding between E-lines α and β within Q-Structure λ₃ , Q-Structure λ₄ continues to provide firm infrastructural support for the advancing trend of Minor Wave 3.
Price is anticipated to continue extending through Minor Wave 3 within Intermediate Wave (5), which remains projected as an extended sequence—maintaining the HPQ Target at ➤ $9.99 💫 by late July .
Meanwhile, the converging Q-Structure λ₁ continues to project the broader HPQ Target ➤ $20.88 🎯 into early December .
#AI #AIInfrastructure #AICloud #DataCenters #GPU #CloudComputing #HPC #StockMarket #GrowthStocks #TradingSetup #Investing #TechnicalAnalysis #TrendAnalysis #MarketStructure #ElliottWave #QuantumModels
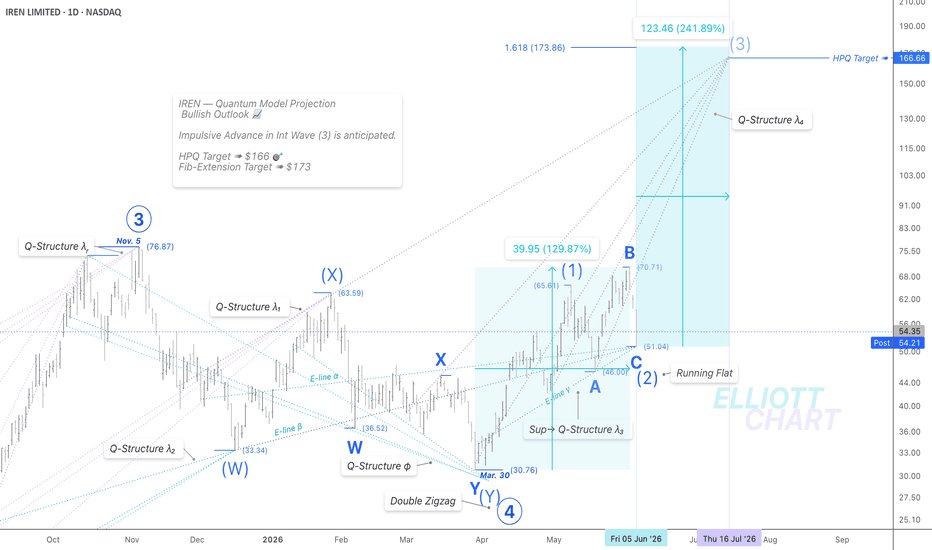
IREN | DailyNASDAQ:IREN — Quan-Model Projection
Set for the Next Phase | Extending Impulsive Advance Ahead 📈
IREN unfolded a Running Flat correction in Intermediate Wave (2), with its final leg — the decline of Minor Wave C — now appearing complete.
The overall structure remains well-positioned for the projected impulsive advance of Intermediate Wave (3), with a Fib-Extension Target of ➤ $ 173 and an HPQ Target of ➤ $ 166 🎯 projected into mid-July .
🔖 HPQ Targets remain defined by the Q-Structures mapped across the weekly timeframe, while current momentum dynamics and structural geometry continue to favour higher continuation.
#QuantumModels #TradingSetup #TechnicalAnalysis #AI #AIInfrastructure #AICloud #DataCenters #GPU #CloudComputing #HPC
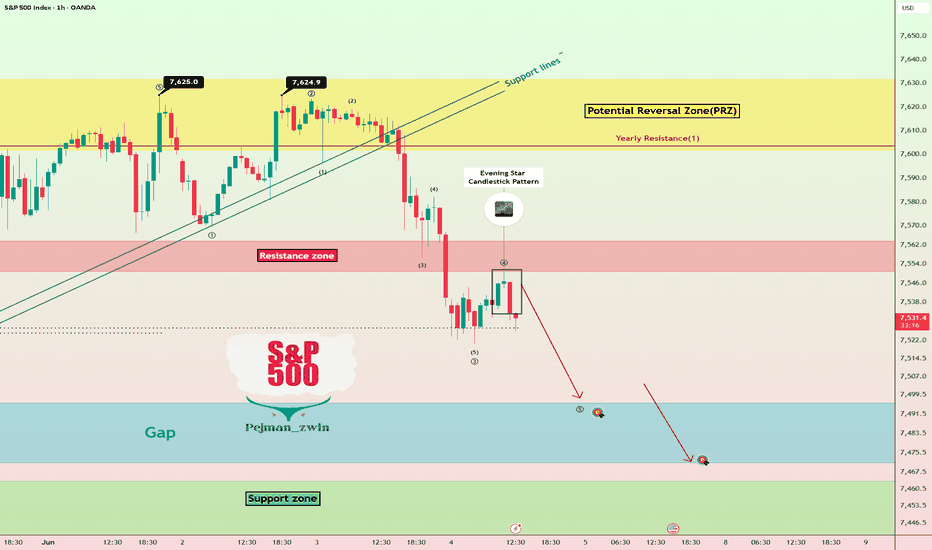
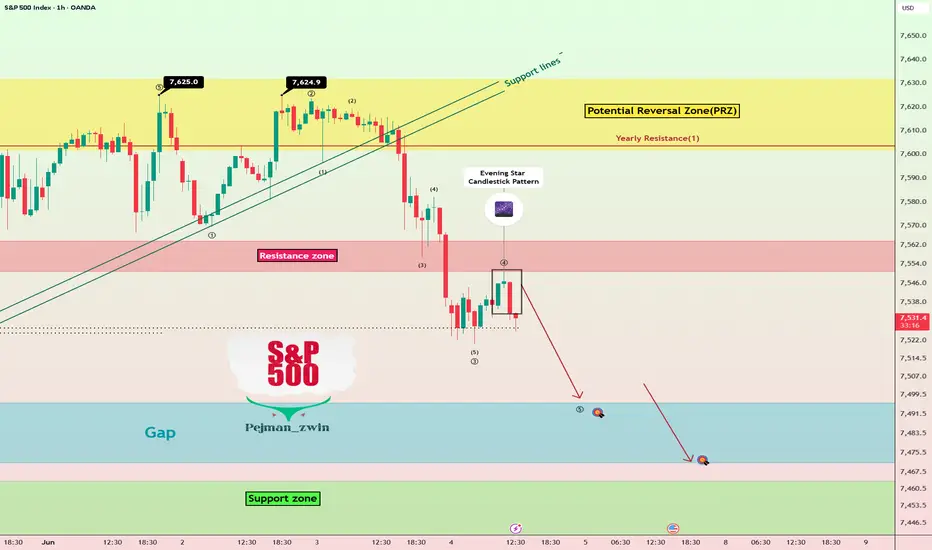
S&P 500 Rejected Near the Highs — More Downside Next?As I expected in the previous idea, the S&P 500 ( FOREXCOM:SPX500 ) started its decline from the Potential Reversal Zone(PRZ) and marked its all-time highs right in that PRZ. After breaking significant support lines, the index began to drop—one key reason for this decline could be the escalating tensions in the Middle East.
Currently, the S&P 500 has broken a support zone($7,564-$7,551) and seems to have completed a pullback to that zone, forming an evening star candlestick pattern. We could expect further downside.
From an Elliott Wave theory standpoint, it appears that the S&P 500 is completing either its major wave 3 or wave 5.
I expect the S&P 500 to decline further once U.S. markets open, aiming to fill the lower Gap($7,496.20-$7,471.40).
First Target: $7,504
Second Target: $7,476
Stop Loss(SL): $7,573
Note: A sharp drop in the S&P 500 could also impact correlated markets like cryptocurrencies, especially Bitcoin( BINANCE:BTCUSDT ).
What’s your view on the S&P 500? Will it continue its decline, or could we see a new all-time high again?
💡 Please respect each other's opinions and express agreement or disagreement politely.
📌 S&P 500 Index Analyze (SPX500USD), 1-hour time frame.
🛑 Always set a Stop Loss(SL) for every position you open.
✅ This is just my idea; I’d love to see your thoughts too!
🔥 If you find it helpful, please BOOST this post and share it with your friends.
Gold May Be Building a Reversal Inside This Falling WedgeOver the past four to five days, Gold ( OANDA:XAUUSD ) has been drifting downward with very low momentum.
Currently, Gold is moving near a heavy support zone($4,502-$4,351) and close to the bottom of a descending channel.
From a classical technical analysis perspective, if we look at Gold’s chart on the 1-hour time frame, it seems to be forming a falling wedge pattern. If it breaks the upper line and the resistance zone($4,497-$4,476), we could expect an upward move.
From an Elliott Wave theory perspective, Gold appears to be completing its corrective waves within the falling wedge pattern. After that, we can anticipate the next five-wave impulse upward.
I expect Fold to rise from the Potential Reversal Zone(PRZ) or if it breaks the upper line of the falling wedge pattern, we could expect a stronger upward move.
First Target: $4,491
Second Target: $4,526
Stop Loss(SL): $4,399
Points may shift as the market evolves.
Note: Geopolitical developments in the Middle East could have a swift impact on Gold’s trend.
What’s your view on Gold? Can it hold its heavy support zone($4,502-$4,351), or should we expect a sharper decline in Gold??
💡 Please respect each other's opinions and express agreement or disagreement politely.
📌 Gold Analyze (XAUUSD), 1-hour time frame.
🛑 Always set a Stop Loss(SL) for every position you open.
✅ This is just my idea; I’d love to see your thoughts too!
🔥 If you find it helpful, please BOOST this post and share it with your friends.
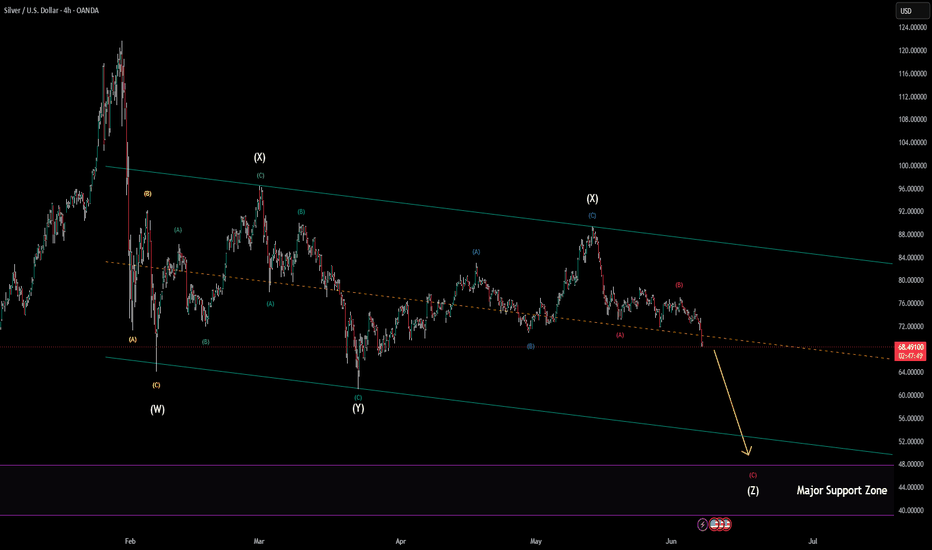
XAG/USD – 4H Final Z Wave (Jun 5, updated)OANDA:XAGUSD
📍 Price at $68.64, just broke below orange dashed mid-channel support
🔻 Z wave (C) leg confirmed — no more bounces expected, straight drop mode
🎯 Target: ~$50 — where yellow arrow meets Major Support Zone (purple line)
📐 Green descending channel still guiding price lower cleanly
⏱️ Completion expected: late June / early July
❌ No rally until Z wave fully completes at support
⚠️ Not financial advice. Trade responsibly.
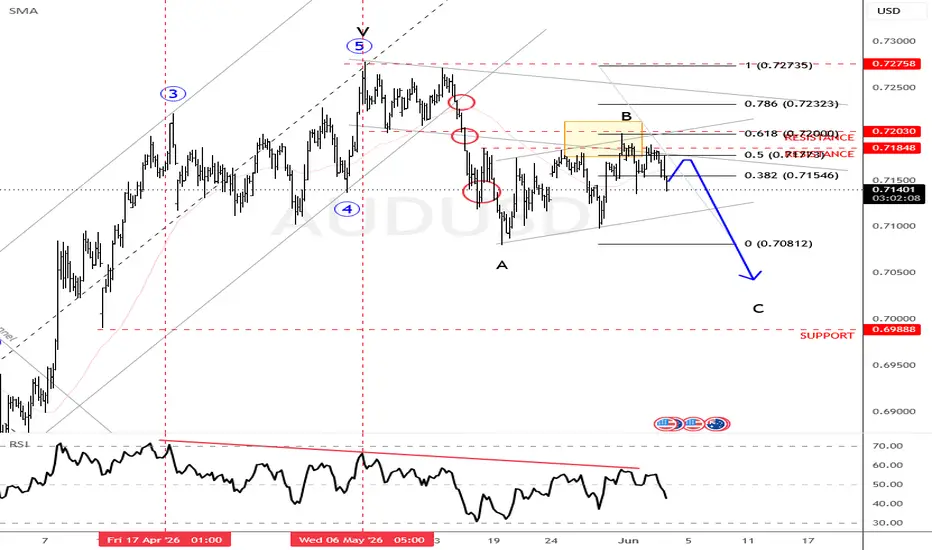
AUDUSD Breakout and Potential Retrace!Hey Traders, in today's trading session we are monitoring AUDUSD for a buying opportunity around 0.71200 zone, AUDUSD was trading in a downtrend and successfully managed to break it out. Currently is in a correction phase in which it is approaching the trend at 0.71200 support and resistance area.
Trade safe, Joe.
Gold- Wave 4 structure setting up for downside expansionGold is currently unfolding a higher timeframe Wave 4 correction within a broader bullish structure.
On the HTF (purple count), Wave 4 is developing as a W–X–Y correction :
Wave W appears completed
Wave X likely topped around the 50% Fibonacci retracement
This opens the door for a potential Wave Y move to the downside
Lower Timeframe (1H):
We’re starting to see structure align for continuation:
Triangle breakdown → early sign of weakness
Initial impulse (Wave 1) already formed
Pullback into 61.8% Fib (Wave 2) → textbook behavior
Now approaching a key moment:
👉 Break below Wave 1 low = confirmation
This would signal the start of a Wave 3 expansion , building the first 5-wave sequence of Wave Y.
Trading Plan (Conditional):
🔻 Entry: 4734.52 (confirmation level)
🛑 Stop-loss: 4834.79 (above Wave 2 high)
🎯 TP: To be adjusted as structure develops
If confirmed, this setup could initiate the next leg of the higher timeframe correction before potential bullish continuation later on.
Gold – Early Signs of a Potential Expansion?On the higher timeframe , our current working assumption is that Wave 4 (in purple) has completed in a WXY structure — potentially setting the stage for a final Wave 5 push.
Drilling down to the lower timeframe , price action is starting to show characteristics of an emerging impulse. We’ve likely seen a completed Wave 1, followed by a clean Wave 2 pullback into the 61.8% Fibonacci level yesterday — a reaction that caught our attention.
Now comes the important part:
We’re not rushing in.
Instead, we’re patiently waiting for confirmation that the market is ready to transition into continuation mode. If this structure holds, we could be looking at the early phase of a larger expansion.
For now, it’s all about observation > anticipation.
Let’s see if gold is about to show its hand.
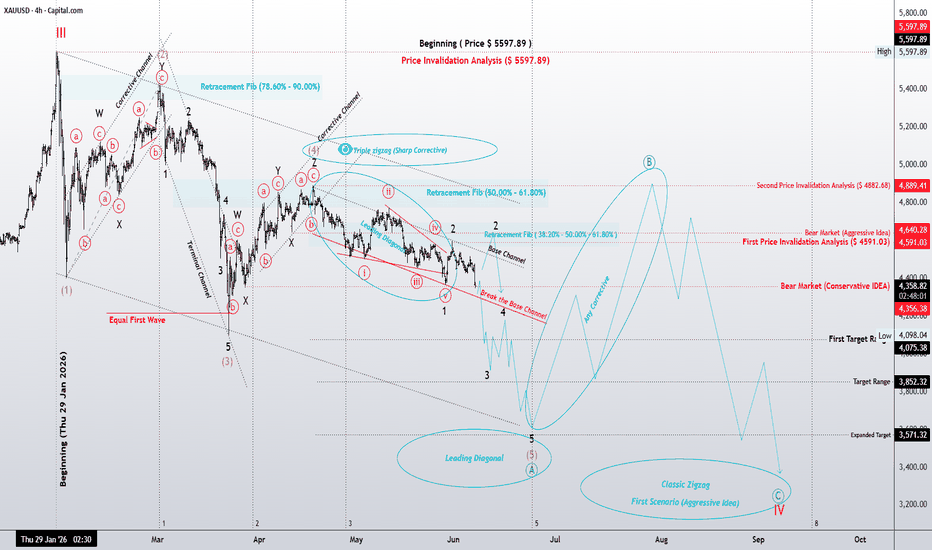
Gold (XAUUSD) — The Evolution of a Structural Thesis: From DiagoGold (XAUUSD) — The Evolution of a Structural Thesis: From Diagonal to Triple Zigzag
In my previous analysis on May 17, I identified the early stages of a Leading Diagonal in Gold. At that time, the market was whispering its first intentions. (Link to the May 17 post provided below).
Fast forward to June 05: The market didn’t just talk; it started shouting. 🗣️📈
The structure has now matured into a more complex and refined bearish roadmap. What started as a simple idea has evolved into a Triple Zigzag (Sharp Corrective) sequence. This isn’t a change of heart—it’s a refinement of the vision.
The Roadmap Ahead:
We are currently navigating the internal sub-waves of this corrective cycle.
The breakdown of the Base Channel serves as a structural confirmation.
Targets in Focus:
4,075.38—4,075.38—3,852.32 — $3,571.32.
The “Mr. Nobody” Rule:
I don’t argue with the tape. I don’t “hope” for a direction. I map the geometry and wait for price to hit the invalidation triggers.
As long as we stay below the Price Invalidation levels (4,591 & 4,882), the bears are still driving the bus. 🚌📉
🔗 Evolution History: Check out where this journey began on May 17:
(See the attached screenshot for the May 17 structural seed)
Patterns whisper. I listen.
— Mr. Nobody
Elliott Wave Researcher
Aussie shows bearish pattern, while RBA can be on holdAussie is seeing a pretty strong turn from the high, so it’s possible that we already saw the top of wave five. Notice that price broke below the trend line support of that bullish channel, which makes us think that wave five may already be completed and that we could see much deeper weakness later on. In fact, we see an impulsive drop from the highs, so we may now be stepping into a higher degree A B C decline, meaning that after B wave rise, pair could see much more weakness. Plus, we have seen a weekly close around 0.7136 level, which seems like important confirmation that the trend is reversing, which after all has been expected because of the higher degree completed 5-wave structure visible on the daily chart.
Resistance on rallies is at 0.7180-0.7200.
One of the reasons for a potential deeper pullback on Aussie is also the unexpected rise in unemployment and lower than expected CPI, which means RBA can stay on hold for now, especially since they have already hiked three times this year.
Grega
NEAR — Crash Into Golden PocketNEAR has been one of the stronger coins during this bullish cycle. After completing wave 5 right at the 1.136 Fibonacci extension, price saw a sharp -35% correction and is now approaching a very interesting long setup.
The key area I’m watching is the golden pocket, which aligns with several strong confluences:
Anchored VWAP support
Untested high / liquidity zone
Moving average support
Psychological $2.00 level
0.618 Fib speed fan reaction
Clear invalidation below the setup zone
NEAR already swept the low at $2.01, tapped the 0.618 Fib speed fan, and bounced from there, which gave a solid long opportunity.
For this setup, I’d be looking for entries between $2.00–$1.89, as long as price shows a strong reaction and holds the zone.
The take-profit targets for this long setup are:
TP1: $2.20
TP2: $2.27
Overall, this is a clean high-probability long setup with clear invalidation.
_________________________________
💬 If you found this helpful, drop a like and comment!
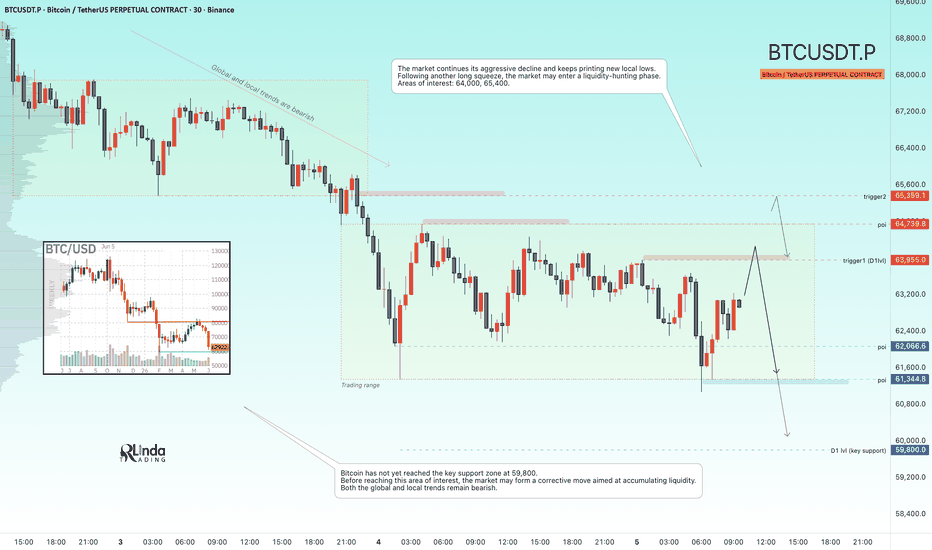
BITCOIN - A pullback before a drop to 60K, or perhaps even lowerBINANCE:BTCUSDT is moving toward 59,800 — the key support zone. However, after retesting a local level, the market is forming a correction against the broader trend
The market remains in panic mode and is testing the 60K area. Dynamic buyers have yet to appear, while fear continues to intensify. A move below 60K could trigger a cascade of liquidations, as many institutional hedging strategies are concentrated around this level.
There is currently no fundamental support for the market, while a series of weak news catalysts has fueled aggressive selling. Large funds continue transferring Bitcoin to exchanges.
Technically, the primary area of interest remains 59,800–53,300. Before reaching this target zone, Bitcoin may enter a local corrective phase
Resistance levels: 64,000, 64,740, 65,360
Support levels: 61,350, 59,800
A long squeeze from local support is driving the current correction. Technically, this is not buying pressure but rather a reaction to profit-taking. The market has entered a liquidity-hunting phase ahead of a potential continuation lower. Key triggers (areas of interest) are located at 63,955 and 65,360. A short squeeze could trigger the next leg down.
Best regards, R. Linda