Long
Long
 Short
Short
$ALO €100B Backlog. Europe Rearming. I'm Buying the War CatalystI am buying Alstom because of what the Iran war is doing to oil.
Brent crude surged past $100 per barrel within weeks of the conflict starting, peaking near $120.
The IEA called it the worst global energy supply disruption in history. Diesel has exceeded €2 per litre in Germany, France, Italy, Finland and the Netherlands. Fuel prices across Europe are up more than 30%. The European Commission President called it a stark reminder of Europe's vulnerability in relying on other regions for oil and gas.
When oil becomes scarce and expensive, the world shifts to electric transport. Electric mass transit means trains.
Alstom builds the trains.
The numbers confirm the demand is already locked in. Q3 fiscal 2026 orders more than doubled year-over-year to €9.6 billion. Nine-month order intake reached €20 billion. Q3 organic sales grew 5.9%. The backlog as of December 31, 2025 hit a record €100.3 billion.
ScotRail contract secured this month for £330 million. Free cash flow guidance stands at at least €1.5 billion over three years. Medium-term EBIT margin target 8% to 10%. JP Morgan maintains Buy. Analyst consensus target €26.18, high target €34.30. Next earnings May 13, 2026.
🟢 Buy Zone (€22.17 area)
0.236 Fibonacci retracement and horizontal monthly support.
Stop: €1.74 below entry (7.277%) / €980 position
Qty: 11
Risk/Reward Ratio: 9
Target: +65.496% (€39.57 area / €1,180)
Key Levels:
🔑 Current Price: €23.96
🔑 Buy Zone: ~€22.17
🔑 52-Week Low: €15.85
🔑 52-Week High: €30.23
🔑 Record Backlog: €100.3B
🔑 9-Month Order Intake: €20B
🔑 Free Cash Flow Target: €1.5B over 3 years
🔑 JP Morgan Rating: Buy
🔑 Analyst Consensus Target: €26.18
🔑 High Analyst Target: €34.30
🔑 Next Earnings: May 13, 2026
🎯 Target: €39.57 (+65% / €1,180)
⚠️ Hard Stop: €1.74 below entry  Long
Long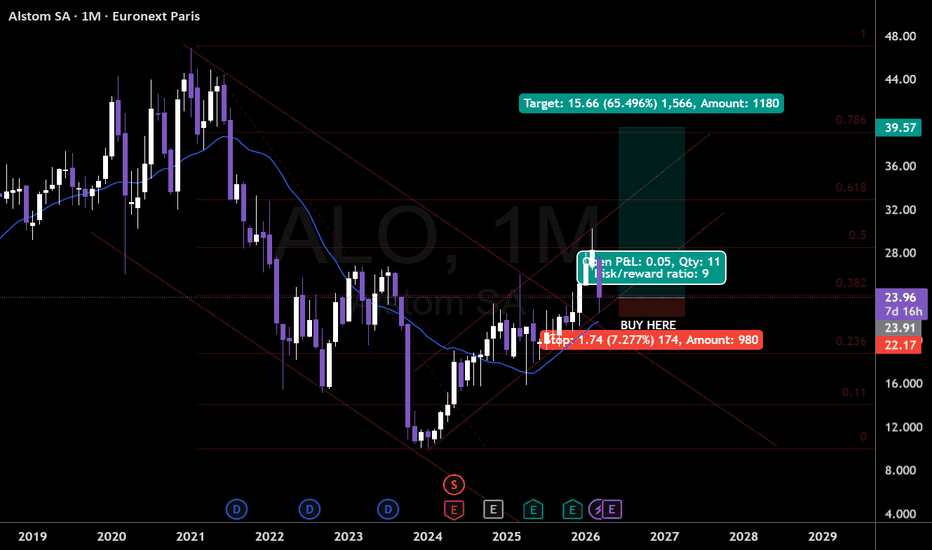
$CS | Solid Insurance Franchise, Awaiting Breakout ConfirmationAXA EURONEXT:CS
This analysis reflects personal views and does not constitute financial advice. Always conduct your own due diligence before making any investment decision.
AXA continues to deliver as a dependable insurance franchise, combining steady top line growth with an attractive dividend package. The company's diversified exposure across life, property & casualty, and asset management provides resilience across market cycles. Fundamentally, this remains a quality compounder.
Technical outlook:
The immediate challenge is clear: price currently trades below all major EMAs (20/50/100/200) and faces a well defined resistance at €38.68. This confluence of technical barriers creates a significant overhead supply zone that bulls need to absorb before any meaningful advance can materialize.
Should price manage to reclaim all four EMAs and break decisively above €38.68, the next target opens up at €43.77. That breakout would represent a structural shift from consolidation to confirmed uptrend, and likely attract momentum flows.
However, the geopolitical landscape remains a variable to monitor closely. Insurance stocks are inherently sensitive to macro disruption, catastrophe risk repricing, and interest rate volatility, all of which could be amplified by an unstable geopolitical environment.
Bias: Neutral with bullish potential. The setup is conditional on clearing the EMA cluster and the €38.68 resistance. No reason to front run the breakout. Watch and wait.
Key levels:
- Resistance / Trigger: €38.68
- Breakout target: €43.77
- Dynamic resistance: EMA 20/50/100/200
 Long
Long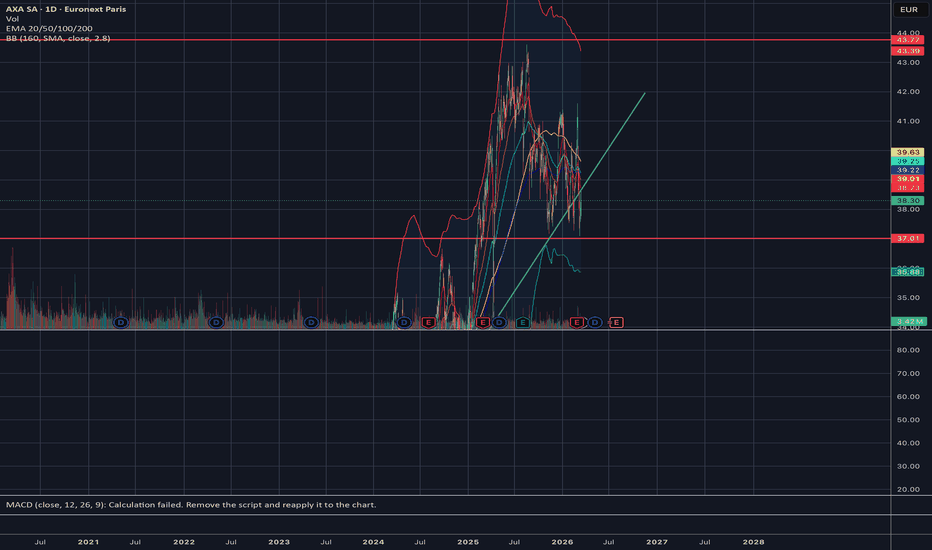
 Short
Short
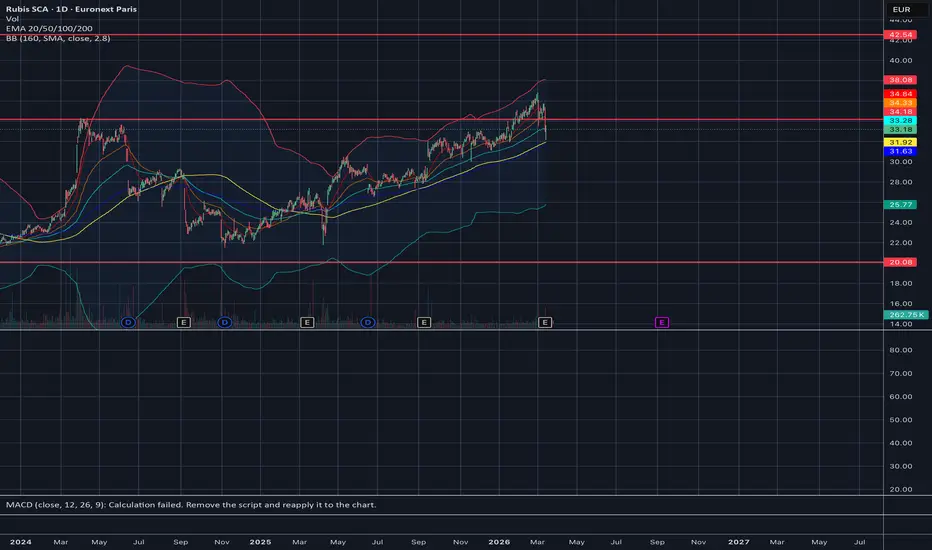
$RUBIS Euronext Paris : Below resistance, support failed$RUBIS — Rubis SCA
Rubis has staged a significant recovery from the €20 floor, benefiting from a supportive oil price environment. However, the steady but uninspiring dividend growth trajectory raises questions about the company's ability to accelerate value creation beyond its current pace. This warrants caution despite the favorable macro tailwind.
Technical outlook:
Weekly EMAs are opening up, suggesting building momentum on the higher timeframe. Conversely, daily EMAs remain tightly compressed, reflecting indecision and a potential inflection point. Price has now reached the daily EMA 200, a critical juncture that will likely define the next directional move.
Scenario 1 (Bullish): Price bounces off the EMA 200, reclaims upward momentum, and breaks through the €34 resistance level. A confirmed breakout with €34 flipping to support would invalidate the bearish thesis and open room for further upside.
Scenario 2 (Bearish, favored): Price fails to hold the EMA 200, triggering a breakdown and renewed selling pressure. This would confirm distribution and likely accelerate downside.
Current position: Selling at €31.44
Bias: Bearish leaning. The technical setup at the EMA 200 is a make or break level, and the lack of strong fundamental catalysts tilts probability toward Scenario 2.
Key levels:
- Support: EMA 200 (dynamic)
- Resistance: €34  Short
Short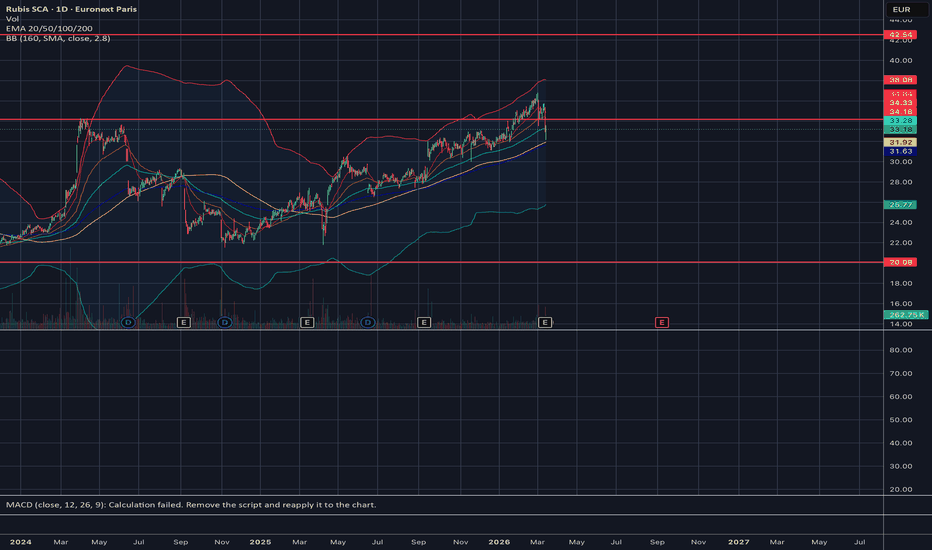
 Long
Long
 Short
Short
 Long
Long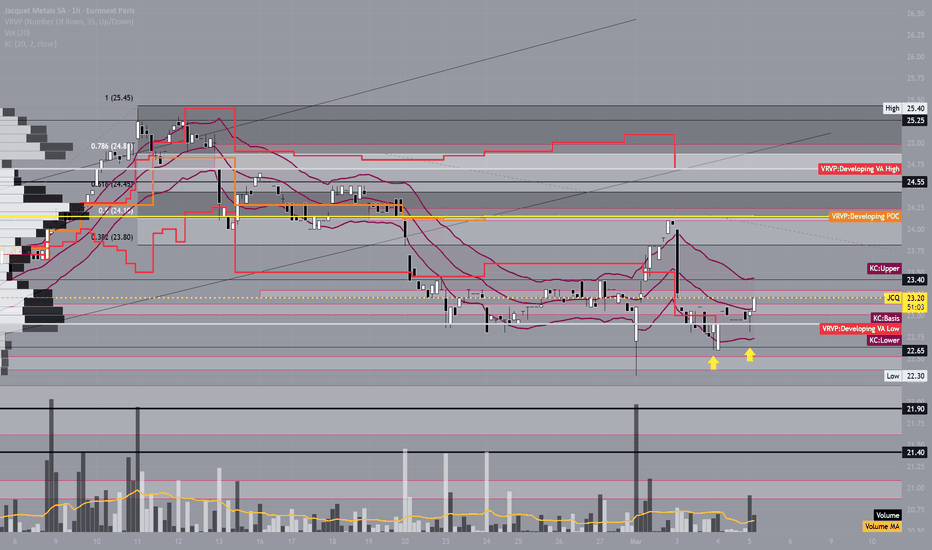
Is Air France a Good Buy ? - AnalysisDue to the current conflict happening in the middle east, a lot of commercial airlines have seen their stocks depreciate quite a lot. And as we the DFM (Dubai stock market is closed), Air Arabia hasn't had its stock move. Moreover, in order to buy Air Arabia one has to have a NIN, which might take days if not weeks to get depending on your situation. As such, a big European company that is available on big brokers is Air France. This company has dropped (15%) since the start of this conflict and might give us a good run back to its previous level. As remember, here the business model won't be impacted, only short term profits will be. Once the war ends, the air pathways in the middle east will re-open, and logically the business model of such commercial airlines won't have changed if the situation is safe and airlines keep operating there. So, lmk if you guys think its a good buy or not.
Disclaimer:
This analysis is for informational and educational purposes only and does not constitute financial advice, investment recommendation, or an offer to buy or sell any securities. Asset prices, valuations, and performance metrics are subject to change and may be outdated. Always conduct your own due diligence and consult with a licensed financial advisor before making investment decisions. The information presented may contain inaccuracies and should not be solely relied upon for financial decisions. I am not a licensed financial advisor or professional trader. I am not personally liable for your own losses; this is not financial advice.  Long
Long
 Long
Long

Fugro: The Green Bubble or a Tactical Long?EURONEXT:FUR is selling its soul to offshore wind, but the 2024 price tags on 2026 costs are a ticking time bomb. We are one subsidy cut away from a fleet of high-tech ghost ships
Technicals:
- price trades close to lower bound of a local ascending channel
- after gapping above the resistance zone price started consolidation phase since 13 Feb.
- this zone rejected price three times before, and a further retest of support is expected
- should support hold, I will be looking for a movement targeting Jul.25 and Aug.25 highs at 12.40 and 12.80
- if support does not hold, I will be looking for a short to 11.63 as first target
Macro:
- the revenue share from Renewables and Infrastructure is steadily pushing out traditional Oil & Gas, while the order book continues to grow with fresh contracts
- but, having booked orders at 2024 price levels, the operating costs in 2026 have spiked, so every new project now only deepens the company`s loss
- Fugro is now critically dependent on the pace of offshore wind farm construction. It means that if governments begin cutting "green" subsidies or projects are frozen due to inflation, the company will be left with a massive fleet of specialized vessels and no orders
- this means a high concentration of risk in a single sector for a company, which has to overperform itself just in order to "be on line" with competitors
Conclusion:
- bullish scenario invalidates if price breaks below bottom bound of ascending channel and closes with 2 bars below 11.65
- bearish scenario invalidates if 2 bars close above 12.09
- Take care of Risk Management! Even if you think your stop is a good stop and the price will not reach it - add extra 10 pips beyond the latest SL you expected to put, because the price can go beyond the level you expected it can go
# - - - - -
What do you think — which direction will the price move further? Are you looking for a bounce or a breakdown? Do you think the support zone at will hold, or are we heading higher? Share your bias in the comments below 👇
# - - - - -
Good Luck! ☺️
# - - - - -
DISCLAIMER: Not financial advice. Everyone must make trading decisions at their own risk, guided only by their own criteria and strategy for opening or not opening a trade
# - - - - - L’Oréal accelerates for Gucci Beauty and reignites LuxuryBattleL’Oréal accelerates for Gucci Beauty and reignites the battle for luxury
By Ion Jauregui – Analyst at ActivTrades
L’Oréal wants to move ahead of the calendar. The French group has acknowledged that it is holding discussions with Kering and Coty in an attempt to assume, before 2028, the Gucci beauty license, currently in the hands of the U.S. company.
The move is not minor. The license was one of the strategic pillars of the agreement signed following the sale of Creed for around €4 billion. Now, L’Oréal seeks to take early control of an asset it considers key to strengthening its luxury division.
Coty, which holds the contract until 2028, has not made official comments regarding a possible early transfer. However, its new CEO has stated that he will consider any transaction that generates value for shareholders, leaving the door open to negotiation if the price proves attractive.
A strategic opportunity
Gucci is one of the most recognized brands in the luxury sector, but its beauty business has not reached the same level of development as its fashion and accessories division. For L’Oréal, this is where the opportunity lies: applying its industrial structure, global distribution network, and premium marketing expertise to drive growth in the segment.
In an increasingly competitive and mature beauty market in Europe and the United States, large multinationals are seeking assets with high profitability potential and capacity for international expansion. Gucci Beauty fits that profile.
Fundamental Analysis
From a financial standpoint, L’Oréal starts from a position of strength. The group maintains:
Solid operating margins within the sector.
Strong cash generation.
Controlled indebtedness.
Geographic and category diversification.
An early integration of Gucci Beauty could strengthen the L’Oréal Luxe division and improve the product mix toward higher-margin segments. If structured efficiently, the transaction could have a positive impact on earnings per share in the medium term.
For Coty, the scenario is different. The Gucci license represents a relevant asset within its portfolio. An early exit would require revising forecasts, although adequate financial compensation could ease balance sheet pressure and strengthen its financial position.
Kering, for its part, maintains a strategy of monetizing assets without assuming direct operational risk, relying on industrial partners to maximize the value of its brands.
Technical Analysis – L’Oréal (EPA: OR)
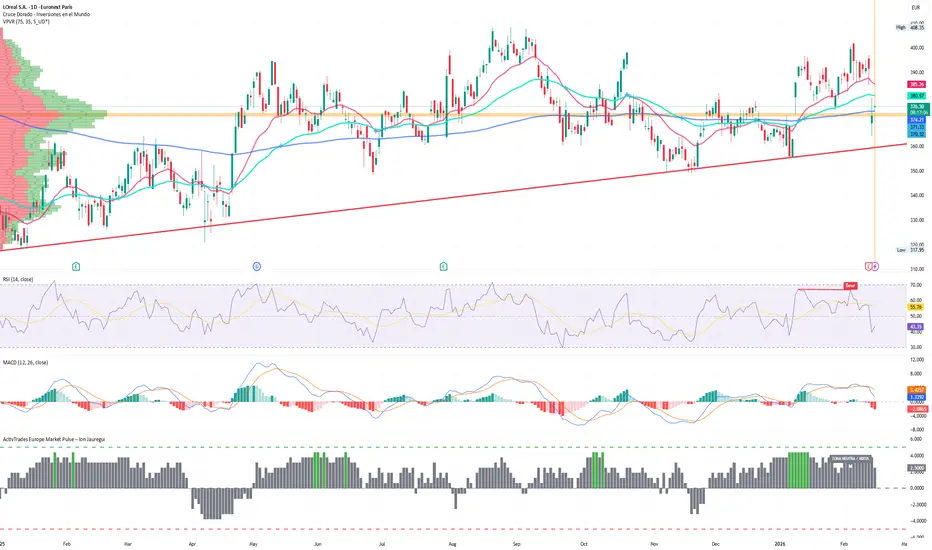
From a technical standpoint, L’Oréal maintains a long-term bullish structure, although the price has been developing a consolidation phase in the highs area for several months.
One of the most relevant levels is the Point of Control (POC) located around €374, an area that has acted as the zone of highest trading activity since April of last year and continues to function as a key reference of balance between supply and demand.
In recent weeks, the stock has corrected from highs, moving below the 50-session moving average (currently at €386.20) and fluctuating near the 100-session moving average, with a recent close around €372.35. This behavior suggests a technical adjustment phase rather than structural deterioration.
Regarding indicators:
The RSI retreated toward levels close to 40%, approaching technical oversold territory, which reduces immediate downside pressure.
The MACD has confirmed a short-term bearish crossover, signaling a temporary loss of momentum, although still within a context of positive primary trend.
Key levels to monitor:
Main resistance: €400–410, recent historical highs (€408.35).
First dynamic support: 100-session moving average around €380.75.
Relevant structural support: €360 area.
Control level (POC): €374.
As long as the price remains above the €360–374 area, the underlying structure will continue to be constructive. A potential confirmation of an early agreement regarding Gucci Beauty could act as a catalyst and favor a renewed push toward historical highs.
In technical terms, the current scenario reflects consolidation within trend, not a cycle change.
The ActivTrades Europe Market Pulse indicator shows an increase in RiskOn sentiment but remains in neutral/mixed territory, suggesting that upward evolution could continue for the moment.
Coty (NYSE: COTY)
The technical behavior is more lateral and sensitive to corporate news.
Resistance around $13–14.
Relevant support in the $10 area.
A negative outcome regarding the license could generate downside pressure, while favorable compensation could stabilize the stock.
Conclusion
The negotiation over Gucci Beauty reflects growing competition in the luxury segment and the interest of large multinationals in reinforcing their strategic positioning.
L’Oréal seeks to move ahead of the contractual expiration and consolidate its global leadership in premium beauty. The market will closely follow the discussions. In an environment where scale and brand make the difference, every strategic move counts.
*******************************************************************************************
The information provided does not constitute investment research. The material has not been prepared in accordance with the legal requirements designed to promote the independence of investment research and such should be considered a marketing communication.
All information has been prepared by ActivTrades ("AT"). The information does not contain a record of AT's prices, or an offer of or solicitation for a transaction in any financial instrument. No representation or warranty is given as to the accuracy or completeness of this information.
Any material provided does not have regard to the specific investment objective and financial situation of any person who may receive it. Past performance and forecasting are not a synonym of a reliable indicator of future performance. AT provides an execution-only service. Consequently, any person acting on the information provided does so at their own risk. Political risk is unpredictable. Central bank actions can vary. Platform tools do not guarantee success.
 Long
Long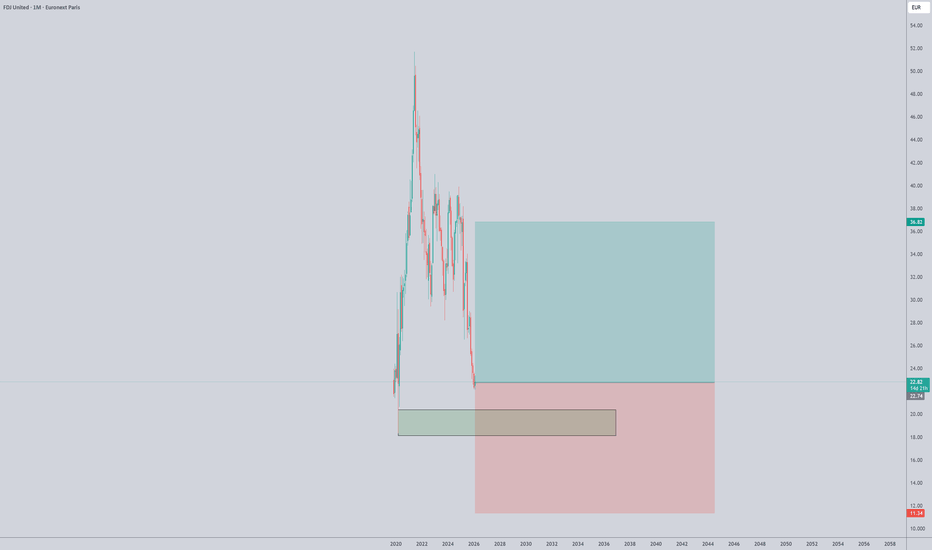
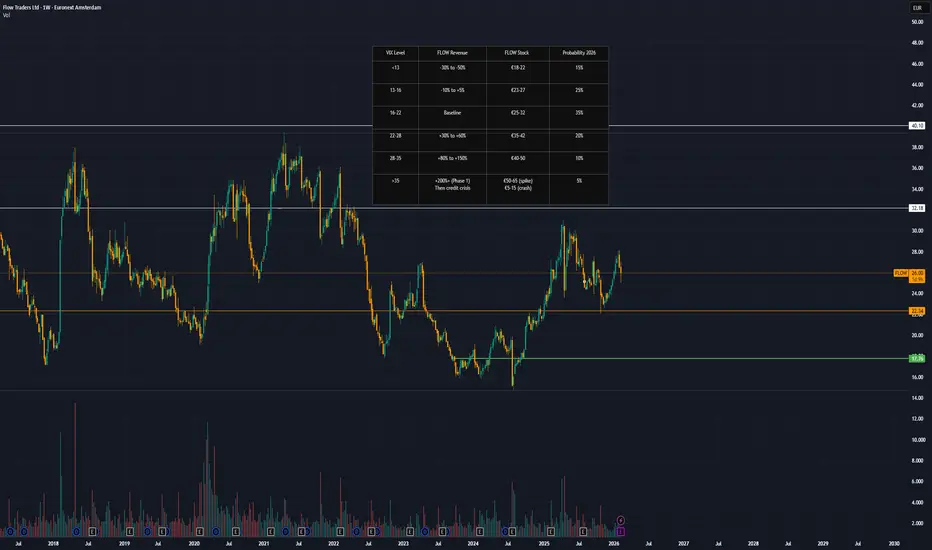
Deep Value or Value Trap? A Comprehensive Analysis at €25.80
Executive Summary
Flow Traders, www.flowtraders.com
the Amsterdam-listed ETP market maker, presents a fascinating risk/reward proposition at its current price of €25.80. Trading at a P/E of just 7.2x with a 23.6% ROE and a remarkable Beta of 0.14, the stock appears significantly undervalued. However, beneath the surface lie critical risks including €1.96B in short-term debt, zero dividend yield (down from 6.92%), and extreme earnings volatility. This analysis breaks down whether FLOW is a contrarian opportunity or a trap for the unwary.
📊 Company Overview
Flow Traders N.V. is a leading global financial technology-enabled liquidity provider specializing in Exchange Traded Products (ETPs). Founded in 2004, the company operates across equity, fixed income, commodities, and digital assets, providing liquidity to over 1,800 ETPs across 80+ exchanges worldwide.
Key Facts:
Market Cap: €1.178B
Current Price: €25.80 (as of Feb 11, 2026)
52-Week Range: €22.10 - €31.04
Employees: 635 FTE
Headquarters: Amsterdam, Netherlands
Exchange: Euronext Amsterdam (FLOW.AS)
💰 Q4 2025 & FY2025 Results Breakdown
The Good
Volume Growth:
ETP Value Traded: €516B (+22% Q4, +26% FY)
Market share gains across all regions
Trading Capital increased 35% to €1,044M
Profitability Maintained:
FY25 Net Income: €133.6M (EPS €3.07)
EBITDA Margin: 41% (both Q4 and FY)
ROE: 23.6% (TTM)
The Concerning
Revenue & Profit Decline:
Q4 Net Trading Income: -20% YoY (€123.8M)
Q4 Net Profit: -44% YoY (€35.1M vs €63.2M)
Asia revenue crashed -56% in Q4
Rising Costs:
Fixed Operating Expenses: +17% YoY (€52.4M Q4)
FY26 guidance: €220-230M opex (+8-13%)
Technology & employee costs surging
Cash Flow Deterioration:
Operating Cash Flow: €32M (down from €271M in 2020)
Working Capital drain: -€191M in 2024
Free Cash Flow nearly zero
📈 Historical Performance: The 2020 Distortion
│ Year │ Revenue │ Net Income │ EPS │ ROE │ DPS │ Comment │
├──────┼─────────┼────────────┼───────┼─────┼──────┼─────────
│ 2019 │ €352M │ €53M │ €1.14 │ 16% │ €0.76│ Pre-COVID baseline │
│ 2020 │ €1,090M │ €464M │ €9.81 │ 79% │ €5.52│ COVID volatility bonanza │
│ 2021 │ €542M │ €115M │ €2.51 │ 23% │ €1.14│ Normalization begins │
│ 2022 │ €677M │ €127M │ €2.76 │ 21% │ €1.27│ Recovery year │
│ 2023 │ €577M │ €36M │ €0.81 │ 6% │ €0.38│ Weak volatility │
│ 2024 │ €801M │ €160M │ €3.56 │ 21% │ €0.00│ Dividend cut │
└──────┴─────────┴────────────┴───────┴─────┴──────┴─────────
💡 Key Insight: The 5-year CAGR of 25.5% for EPS is heavily skewed by the 2020 outlier (€9.81 EPS).
Normalized EPS (excluding 2020 and 2023): ~€2.60
⚖️ Valuation Analysis: Cheap or Fairly Priced?
Current Metrics
P/E Ratio: 7.16x (vs. sector average 12-18x)
P/B Ratio: 1.45x (Book Value €17.80/share)
PEG Ratio: 0.28 (anything <1.0 is typically attractive)
EV/EBITDA: ~6.5x
Fair Value Estimates
│ Method │ Fair Value │ Upside │ Assumption │
│ Sector P/E (12x) │ €43.20 │ +67% │ Re-rating to peer average │
│ Normalized Earnings (10x P/E) │ €26.00 │ +1% │ €2.60 normalized EPS │
│ ROE-Based (Gordon Growth) │ €38-42 │ +47-63% │ 8-10% sustainable growth │
│ Sum-of-Parts │ €28-30 │ +9-16% │ Core + growth options │
│ DCF (Conservative) │ €22-26 │ -9 to +1%│ Based on weak current FCF │
📊 Consensus: €30-35 represents fair value (+16-36% upside)
🎯 Market is currently pricing: Normalized earnings at fair P/E, with ZERO value assigned to growth initiatives (China, tokenization, AI)
🚨 Critical Risk Factors
1. Extreme Leverage - The Elephant in the Room
Total Debt: €1.96B
Shareholders' Equity: €767M
Debt-to-Equity: 256%
Short-term Debt: €1.91B (97% of total)
The Problem: Almost all debt matures within 12 months. In a credit crisis (2008-style), refinancing could become impossible, leading to forced deleveraging or bankruptcy.
Historical Parallel: Bear Stearns collapsed in 2008 despite being profitable when credit lines were cut.
2. Dividend Annihilation
From a reliable 6.92% yield (€5.52 in 2020) to ZERO in 2024.
Why it matters:
Removed income support for stock price
Total dividends 2020-2023: €452M (more than 2024's full-year profit!)
Signals management prioritizing growth over shareholder returns
3. Earnings Volatility
EPS Range (2019-2024): €0.81 to €9.81 (12x variance!)
This isn't a steady compounder—it's a volatility lottery ticket.
4. Cash Flow Collapse
2020 Operating CF: €271M
2024 Operating CF: €32M (-88%)
Working Capital increasing dramatically (€191M drain in 2024)
Implication: Despite profitable on paper, the business is consuming cash.
🎯 Growth Initiatives: Hope or Hype?
1. China Expansion 🇨🇳
Status: Just launched Q4 2025
Investment: €30-40M
Potential: €50-100M annual revenue
Timeline: 12-24 months
Success Probability: 40%
Risks: Regulatory uncertainty, capital controls, geopolitical tensions (Taiwan)
2. Tokenization / Real-World Assets 🪙
Status: Early stage (Dinari partnership for 24/7 tokenized equities)
Investment: €40-50M
Potential: €30-80M annual revenue
Timeline: 24-36 months
Success Probability: 30%
Opportunity: Flow's 20 years of ETP expertise + crypto native capabilities = unique positioning
Reality Check: Tokenization is 2-5 years from mass adoption. Regulatory framework unclear.
3. AI & Deep Learning 🤖
Investment: €30-40M
Potential: Efficiency gains, margin improvement
Timeline: 18-24 months
Success Probability: 60%
Most Credible: Incremental improvements likely, but unlikely to be transformational alone.
📊 Scenario Analysis: 12-Month Price Targets
BEAR CASE (30% probability): €12-20 (-53% to -22%)
Triggers:
Sustained low volatility (VIX <14 for 6+ months)
China expansion blocked/fails
Credit crunch affecting debt refinancing
FY26 EPS falls to €0.80-1.20
Investment Implication: Avoid or exit immediately
BASE CASE (40% probability): €26-32 (+1% to +24%)
Triggers:
Moderate volatility (VIX 16-22)
China contributes modestly (€20-30M earnings)
Margins stabilize at 38-40%
FY26 EPS: €2.80-3.20
Investment Implication: Fair value already priced in; limited upside without catalysts
BULL CASE (25% probability): €38-45 (+47% to +74%)
Triggers:
China delivers strong results (€50M+ contribution by Q3 2026)
Tokenization partnerships announced at Capital Markets Day
Market re-rates to 11-12x P/E
FY26 EPS: €5.00-6.00
Investment Implication: Significant upside if growth stories materialize
VOLATILITY SPIKE (25% probability): €40-48 (+55% to +86%)
Triggers:
Market correction -15-25% (S&P 500)
VIX sustained 25-35
Trump tariff chaos / geopolitical crisis
2020-style revenue surge
Investment Implication: Best case for FLOW, but...
CRITICAL WARNING: In extreme crashes with credit freezes, initial spike could reverse to €5-10 if debt refinancing fails (Phase 2 credit crisis).
🔑 The Beta 0.14 Advantage: Portfolio Diversifier
What Beta 0.14 Means:
When S&P 500 drops -10%, FLOW typically moves only -1.4%
Near-zero correlation with broad markets
Market makers profit from volatility, not direction
Historical Evidence:
2020: Market crashed -30%, FLOW had its BEST year ever (+464M profit)
2023: Bull market with low volatility = WORST year (€36M profit)
Portfolio Application:
FLOW acts as a volatility hedge, not a traditional equity position. Ideal for investors expecting turbulent markets regardless of direction.
💡 Investment Thesis: For Whom?
✅ BUY IF:
You believe 2026 will see elevated volatility (Trump tariffs, geopolitical tensions, recession fears)
You can tolerate 50%+ drawdowns
You view this as 8-12% of a diversified portfolio (NOT 25%+)
You're patient with 18-24 month time horizon
You believe tokenization will become mainstream by 2028-2030
❌ AVOID IF:
You need dividend income
You require stable, predictable earnings
You're investing >15% of portfolio in single position
You can't monitor for credit crisis warning signs
You're conservative/risk-averse
📋 Recommended Position Sizing & Strategy
For Aggressive Growth Investors:
Allocation: 8-12% maximum (NOT 25%)
Entry Strategy:
6% at current levels (€24-26)
6% on dip to €22-23 (if occurs)
Exit Strategy:
Sell 50% at €32-35 (+24-36%) - lock in gains
Sell 25% at €40-45 (+55-74%) - take profits on volatility spike
Keep 25% for moonshot (€50+ if tokenization hits)
STOP LOSS: €20 (-22%) - if breached, thesis broken
For Moderate Investors:
Allocation: 5-8% maximum
Entry: Split between current and dips
Exit: More aggressive profit-taking at €30-32
Pair with: Defensive stocks (Nestlé, Roche) and 30%+ cash
For Conservative Investors:
Allocation: 0-3%
Recommendation: PASS - Too volatile, zero dividend, high leverage risk
Alternatives:
Deutsche Börse (DB1.DE) - Similar volatility exposure, stronger balance sheet
Gold miners - Crash hedge with less refinancing risk
🚨 Critical Sell Signals - Exit Immediately If:
│ Warning Sign │ Action │ Reason │
├─────────────────────────────────┼──────────────┼───────────
│ VIX <12 for >3 months │ Sell 50% │ Low volatility = low earnings │
│ Q1 2026 margins <30% │ Sell 50% │ Structural deterioration │
│ Credit spreads >200bps │ Sell 100% │ Credit crisis imminent │
│ ECB emergency meetings │ Sell 100% │ Systemic risk (2008 repeat) │
│ China regulatory block │ Sell 25-50% │ Growth story dead │
│ FLOW hits €35+ on spike │ Sell 75% │ Lock gains before potential crash│
📅 Key Catalysts to Watch (2026)
Q1 2026:
✅ Capital Markets Day (details on tokenization strategy)
✅ Q1 earnings (margin trajectory critical)
⚠️ Trump tariff implementation (volatility catalyst)
Q2-Q3 2026:
✅ First China operations metrics
✅ Dinari partnership volume data
⚠️ Potential market correction (recession fears)
Q4 2026:
✅ FY26 guidance
✅ Potential dividend reinstatement
⚠️ Credit market stress signals
🎯 Final Verdict
Rating: 3/5 Stars ⭐⭐⭐
HOLD / SELECTIVE BUY at €25.80
The Bull Case:
Extreme valuation discount (P/E 7.2x vs 12-18x sector)
China + tokenization optionality worth €260-530M (not priced in)
Beta 0.14 = perfect Trump-era volatility hedge
2026 macro environment likely volatile (tailwind)
The Bear Case:
€1.96B short-term debt = existential risk in credit crisis
Cash flow deterioration (-88% since 2020)
Zero dividend = no income support
Growth initiatives unproven (40% China success rate, 30% tokenization)
The Reality:
Flow Traders is fairly valued for normalized earnings (~€2.60 EPS @ 10x P/E = €26). The stock is essentially a free call option on:
Sustained market volatility (VIX >20)
China expansion success
Tokenization revolution
If you believe any of those three, FLOW offers 50-100% upside. But if wrong, -20-50% downside (or worse in credit crisis).
💬 Conclusion
Flow Traders at €25.80 is neither a screaming buy nor a clear avoid. It's a calculated speculation for investors who:
Believe 2026 will be volatile (Trump, tariffs, recession)
Can size it appropriately (8-12% max)
Have discipline to sell on spikes
Understand the leverage risks
This is not a buy-and-hold dividend compounder. It's a volatility lottery ticket with better odds than most.
For those with conviction on elevated 2026 volatility and tokenization's long-term potential, a small position (8-12%) at current levels makes sense with strict risk management.
For everyone else, there are safer ways to play the "crash trade" (gold, defensive stocks, cash).
📊 Quick Reference Scorecard
┌───────────────────────┬─────────┬──────────┐
│ Factor │ Score │ Weight │
├───────────────────────┼─────────┼──────────┤
│ Valuation │ 8/10 │ High │
│ Growth Potential │ 7/10 │ Medium │
│ Financial Health │ 3/10 │ High │
│ Dividend │ 0/10 │ Low │
│ Risk Level │ 2/10 │ Critical │
│ Management Vision │ 8/10 │ Medium │
├───────────────────────┼─────────┼──────────┤
│ OVERALL │ 5.5/10 │MODERATE │
└───────────────────────┴─────────┴──────────┘
Disclaimer: This analysis is for educational purposes only and does not constitute financial advice. Always conduct your own due diligence and consult with a financial advisor before making investment decisions. The author may or may not hold positions in the securities discussed.
Key Takeaway: Flow Traders is a high-risk, high-reward volatility play trading at fair value with significant optionality. Size appropriately, manage risk religiously, and be prepared to act quickly in either direction. 📈📉 Short 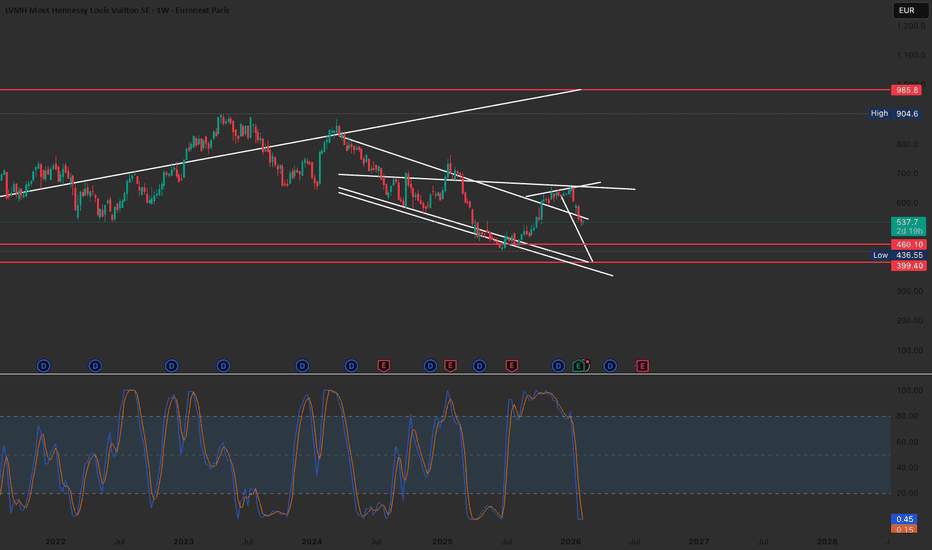
𝗘𝘃𝗲𝗿𝘆 𝗠𝗼𝗿𝗻𝗶𝗻𝗴 𝗧𝗵𝗲𝘆 𝗠𝗮𝗿𝗸 𝗜𝘁 𝗨𝗽In Parts I and II, I built the fundamental case: 19 January deliveries (worst this decade, below pandemic levels), engine constraints through 2030 per P&W's own president, no supply agreement between Airbus and P&W for the foreseeable future, Singapore Airshow producing one order for four aircraft, and the CEO's leaked memo warning of "unprecedented crises."
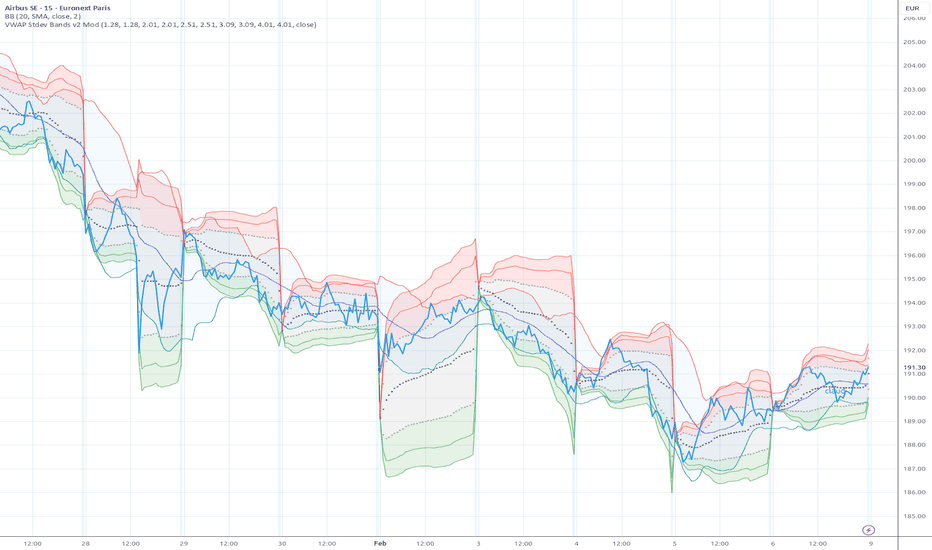
Today I want to show what that looks like on the tape. Because the daily chart says this stock is "consolidating." The intraday chart says it's being sold to you.
𝗧𝗛𝗘 𝗣𝗔𝗧𝗧𝗘𝗥𝗡
I've been running Airbus at 1-second and 5-second resolution with anchored VWAP and standard deviation bands. The pink zone above the VWAP line is where longs are in profit. The green zone below is where sellers are in control. Watch what happens every single session.
𝗠𝗼𝗻𝗱𝗮𝘆, 𝗙𝗲𝗯 𝟵 (today): Opens around €191, spikes hard to €193.60 by mid-morning, right into the resistance zone I flagged in Part I. The pink zone is wide. Looks like a breakout. Then it reverses. Sells straight through VWAP. By early afternoon price is at €189, deep in the green. A €4.60 intraday range. Then a late bounce back to €190.70, below VWAP, below the open. The entire morning move was given back and then some.
𝗧𝗵𝘂𝗿𝘀𝗱𝗮𝘆, 𝗙𝗲𝗯 𝟲: Opens near €189–190, ramps into the upper VWAP bands by 10:00–10:30. Deep into the pink. Looks bullish. Then, from 11:00, the fade. Slow. Steady. Every bounce lower than the last. By 15:00–16:00, the gains are given back. Close near the open.
𝗪𝗲𝗱𝗻𝗲𝘀𝗱𝗮𝘆, 𝗙𝗲𝗯 𝟰: Same template, more aggressive. Price spikes into the pink zone, tops out around 10:30–11:00. Then a one-way bleed for the rest of the session. By afternoon, deep in the green. If you bought the morning strength, you're red by the close.
𝗠𝗼𝗻𝗱𝗮𝘆, 𝗙𝗲𝗯 𝟯 (the Faury day): Faury confirms engine constraints extend through 2026 at the Dubai summit. Gap down at the open. Price crashes through VWAP instantly. Never recovers. Eight hours of continuous selling. No morning markup needed, the news provided the cover.
𝗙𝗿𝗶𝗱𝗮𝘆, 𝗝𝗮𝗻 𝟯𝟬: Quiet all day. Price drifts between VWAP and the lower bands. Looks like nothing. Then in the final 15–20 minutes, a vertical flush into deep green. End-of-day institutional block hitting the tape when retail is at dinner and liquidity is thinnest.
Seven sessions. One script. Morning strength absorbed by afternoon weakness. The only variation is how aggressive the selling gets.
𝗪𝗛𝗔𝗧 𝗧𝗛𝗘 𝗩𝗪𝗔𝗣 𝗕𝗔𝗡𝗗𝗦 𝗔𝗥𝗘 𝗧𝗘𝗟𝗟𝗜𝗡𝗚 𝗬𝗢𝗨
In a healthy, demand-driven move, price tracks above VWAP and stays there. Bands widen symmetrically. Volume confirms direction.
That is not what is happening.
On the up mornings (Feb 2, 4, 6, 9), price pushes into the pink zone but cannot hold. By afternoon it has migrated to VWAP or below. The pink zone expands in the morning but price exits it by the afternoon. The morning volume was selling volume disguised as buying volume. Institutions were providing the offers that absorbed the retail bids.
On the down days (Feb 3) and the flat days (Jan 30), the green zone dominates from the start. No morning markup needed because institutional sellers didn't need to manufacture liquidity, news or end-of-day timing did it for them.
Today was the cleanest example. The spike to €193.60 landed exactly at the resistance I identified in Part I. That's not coincidence. That's a sell program using €193 as a distribution ceiling. Every retail buyer who "bought the dip at 190" in the morning was underwater by 1 PM.
𝗪𝗛𝗬 𝗧𝗛𝗘 𝗗𝗔𝗜𝗟𝗬 𝗖𝗛𝗔𝗥𝗧 𝗟𝗜𝗘𝗦
Pull up the daily chart. What do you see? A stock range-bound between roughly €185 and €195 since mid-January. Looks like consolidation. Looks like it's basing. Analysts say €230. Retail on X says "what a discount at 190!"
The intraday charts show what is happening inside that range. The range is not consolidation. It is a controlled descent disguised as stability. Every session, institutions sell the morning into retail. Every session, the close is weaker than it should be. The range holds because the selling is patient enough not to break it, yet.
Breaking the range would accelerate the decline and reduce exit prices for the remaining positions. So they distribute slowly. Mark it up, sell the markup, repeat tomorrow. The daily chart stays flat. The intraday chart bleeds.
This is Wyckoff distribution. Mark price up to attract buying. Sell into that buying until inventory is exhausted. The public sees rising prices and assumes demand. The institution sees rising prices and knows it's supply, their supply, absorbed by less-informed participants.
𝗧𝗛𝗘 𝗕𝗔/𝗘𝗔𝗗𝗦𝗬 𝗥𝗔𝗧𝗜𝗢
One more thing. On the Boeing/Airbus ADR ratio chart (BA ÷ EADSY), the move has been extraordinary. The ratio sat in the low 2s through late December. It started moving January 12, the day Scherer gave his press conference confirming no engine supply agreement. Spiked through Boeing's January 27 earnings. Now sits above 4.
A near-doubling in seven weeks. In a duopoly where the two companies share a single addressable market, that is not noise. It is repositioning. And it is not because Boeing is suddenly excellent. It is because the denominator, Airbus, is being repriced by people who understand the engine supply math.
𝗧𝗛𝗘 𝗙𝗘𝗕 𝟭𝟵 𝗦𝗘𝗧𝗨𝗣
Earnings in 8 days. The distribution I am showing you can continue as long as the range holds. Patient selling. Flat daily chart. Bullish analyst notes.
Feb 19 is the event that can break the range.
If Airbus reports in-line and guides 850+, the range holds. Distribution continues. Institutions have more time. The daily chart stays boring.
If Airbus misses FCF or guides below 850, the range breaks. €185 support fails. The institutions who have been patiently distributing for weeks are suddenly competing with each other to exit. The controlled descent becomes a disorderly one.
That is when the morning markup disappears entirely and the daily chart starts telling the same story the intraday chart has been telling for weeks.
Watch the VWAP bands. They're showing you exactly who is buying this stock, and who is selling it to them.
 Short
Short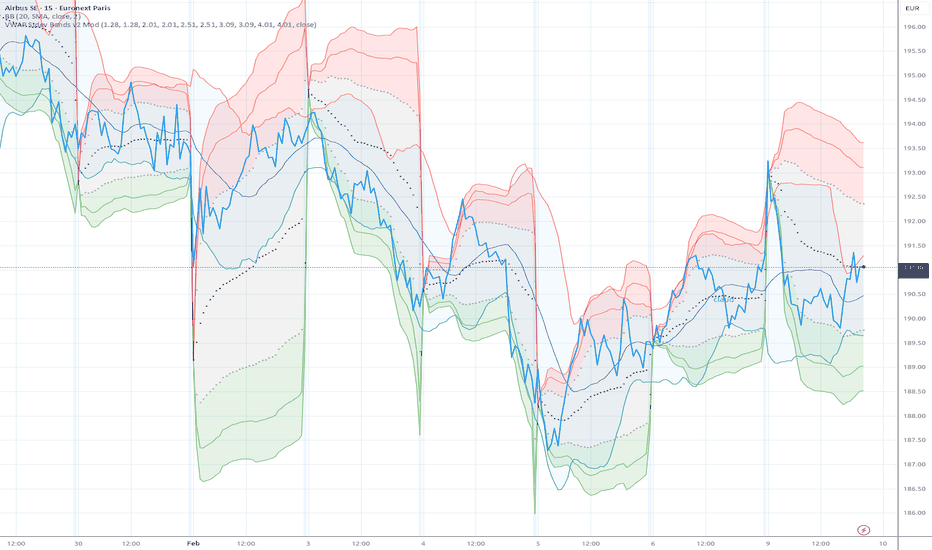
19 January Deliveries. Worse Than the Pandemic.In my first post on Friday, I argued the "record backlog + Boeing weakness = buy" narrative is structurally broken. Engine constraints, margin compression on legacy-priced orders, and aircraft being scrapped at age six for parts.
Zero engagement. Fair enough. Maybe the thesis felt speculative. So here are two hard numbers that dropped since then. They aren't speculative. They're from Airbus's own data, published Thursday.
𝗧𝗛𝗘 𝗡𝗨𝗠𝗕𝗘𝗥
Airbus delivered 19 aircraft in January 2026.
Not a typo. Nineteen. To 15 customers. Only one widebody, a single A350, for SWISS. Everything else narrowbodies and three A220s. The first delivery didn't happen until January 7. Then nothing for another week.
For context, here is every January this decade:
2020 — 31
2021 — 21 (pandemic)
2022 — 30
2023 — 20
2024 — 30
2025 — 25
𝟮𝟬𝟮𝟲 — 𝟭𝟵
This is the worst January since COVID. Worse than 2021's pandemic January. And it came immediately after December's 136-delivery blitz where 17% of 2025's entire output was crammed into 8% of the calendar year.
That pattern, "starve for eleven months, then sprint in December", is the delivery model now. Airbus needs it because engines don't arrive on schedule. Planes sit as engineless "gliders" for weeks or months. Cash gets trapped in inventory. Then in December, everything that can possibly be pushed out the door gets pushed. The January hangover is the cost.
𝗕𝗼𝗲𝗶𝗻𝗴 𝗱𝗲𝗹𝗶𝘃𝗲𝗿𝗲𝗱 𝗮𝗻 𝗲𝘀𝘁𝗶𝗺𝗮𝘁𝗲𝗱 𝟰𝟱 𝗮𝗶𝗿𝗰𝗿𝗮𝗳𝘁 𝗶𝗻 𝗝𝗮𝗻𝘂𝗮𝗿𝘆. More than double Airbus. On a stock trading at less than half the P/E.
If consensus is right that Airbus needs roughly 900 deliveries in 2026 to validate the 75/month rate ramp for 2027, the remaining eleven months now require an average of 80 per month. They have not sustained that rate in any month outside of a Q4 year-end push.
---
𝗧𝗛𝗘 𝗔𝗜𝗥𝗦𝗛𝗢𝗪
The Singapore Airshow, Asia's largest, closed today. Airbus's total commercial haul from a week of the biggest aerospace event in the region:
Four A321neos. One customer. Tigerair Taiwan.
The widely discussed AirAsia deal for up to 100 A220s? Not signed. Airbus's own SVP admitted at the show that only 21 A220s have ever been delivered across the entire Asia-Pacific region. The backlog there is 19 more.
Aerospace Global News called the order tally "exceptionally light," citing "airline frustration with delivery delays and manufacturers' constrained production capacity." Leeham News: "another quiet day for commercial aviation."
Meanwhile at the same show, P&W president Rick Deurloo repeated his timeline: engine normalisation by "the end of this decade." 2030. Airbus and P&W still have no supply agreement "for the foreseeable future," per Airbus's own departing commercial chief Christian Scherer on January 12.
And one more thing nobody here is watching: EASA test pilots flew COMAC's C919 in Shanghai in November. Certification projected 2028–2031. Faury himself called COMAC "a serious long-term competitor" in Dubai on February 3. When was the last time a duopoly incumbent publicly conceded there's "probably room for other players"?
FEBRUARY 19
Earnings in 11 days. Here is what 19 January deliveries tells you about what's coming:
If Airbus guides to 850+ deliveries for 2026 , they are betting engine supply improves dramatically from where it is right now. January says it hasn't. Deurloo says it won't until 2030.
If Airbus guides below 850 , the 75/month target for 2027 is dead and every model built on the rate ramp needs to be re-cut. The consensus €230 target assumes the ramp happens.
Free cash flow is the real tell . Airbus burned €4.8B in net cash in H1 2025. Needed a €5.4B single-quarter cash swing in Q4, the largest in company history, just to hit guidance. Ask yourself what happens when December's 136 deliveries become January's 19. Cash doesn't flow when planes don't deliver.
At 37x trailing earnings with its own CEO warning of "unprecedented crises" in a leaked memo, Airbus is priced for perfection eleven days before the numbers that will show whether perfection is remotely plausible. Short