ASMLASML Holding
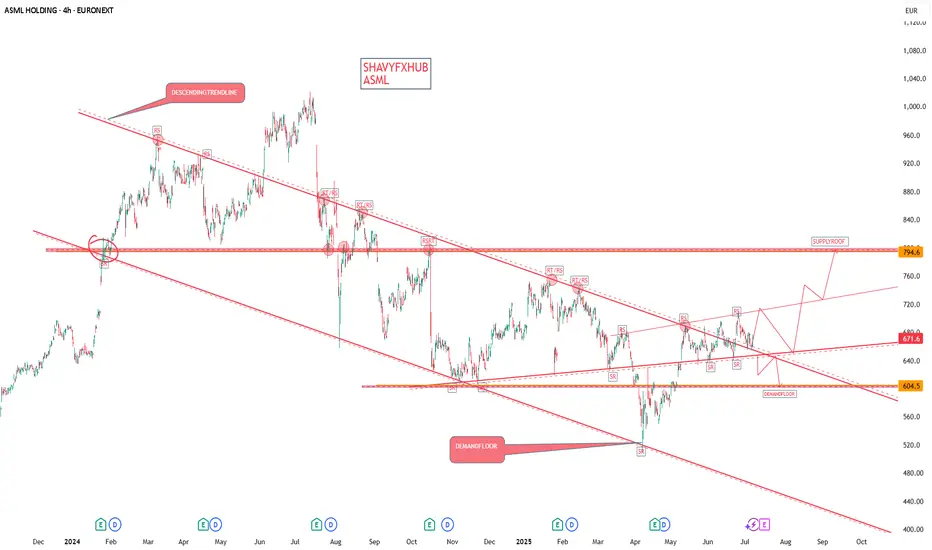
ASML closed at $671.6 on July 7, 2025.
Market Capitalization:
ASML's market cap is approximately $302–$314 billion as of early July 2025, making it one of the world’s 30 most valuable companies.
Key Financials and Outlook
Next Earnings Release:
Scheduled for July 16, 2025. The consensus estimate for Q2 2025 earnings per share is $5.94, with analysts expecting continued strong performance driven by demand for advanced lithography equipment
Recent Performance:
Q1 2025 EPS: $6.31 (be
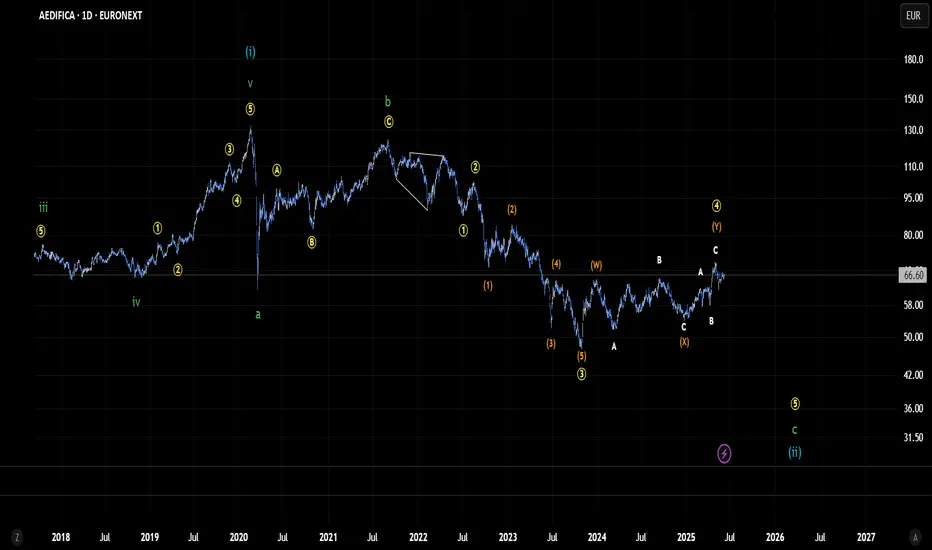
AEDIFICA - Alternative Medium Timeframe Elliot Wave analysisIn this scenario, I’m interpreting the larger Wave 1 as a potential leading contracting diagonal, where each subwave is unfolding as a zigzag (3-3-3-3-3) rather than the typical 5-3-5-3-5 structure.Currently, we appear to be in Wave 4 (Pink) of this diagonal, which seems to be in the final stages of its downward leg before starting Wave 5 the final move of the pattern. The decline in Wave 4 (Pink) may take the form of either a WXY or an ABC correction; continued price development will help valid
ASML ASML is trading around $659.4per share The stock has a market capitalization of approximately $312 billion
Company Overview
ASML is a global leader in advanced semiconductor equipment, specializing in lithography systems essential for chip manufacturing, including extreme ultraviolet (EUV) and deep ultraviolet (DUV) technologies.
The company serves major semiconductor manufacturers worldwide, including in Asia (China, Japan, South Korea, Taiwan), Europe, and the US.
CEO: Christophe D. Fouquet
AEDIFICA - Micro Timeframe EW-Analasyis *Updated* VersionThe bigger picture remains unchanged. As mentioned in the previous count, the Orange Wave 1/2 has either completed or is very close to completion. I can now say with confidence that we're approaching the end of Wave 2, which appears to be unfolding as an ABC correction within that second wave.
Disclaimer: This analysis is for informational and educational purposes only and should not be considered financial or investment advice. All trading involves risk, and you should perform your own due di
SOLB | Descending Triangle Breakout – Targeting +34% MoveTicker: EURONEXT:SOLB (Solvay SA – Euronext Brussels)
📆 Timeframe: 4H (4-hour)
📉 Price: €31.58
📈 Pattern: Descending triangle breakout from horizontal support
📊 Breakout Probability : ~73% upward breakout (short-term triangle)
🔍 Technical Setup:
SOLB has successfully broken above a descending resistance line, bouncing off a solid horizontal support level near €28.00. This forms a bullish descending triangle breakout – a structure that historically resolves upward in short- to mid-term timefra
With new wars appearing, is THALES a good buy?Pros:
Massive scale & diversified contract base
-€18 billion in annual revenue, 50+ years in defense—among Europe’s largest contractors .
Secured key recent contracts:
-NATO NCOP/BMD Phase 3 missile-defense and awareness system (ongoing since 2012, renewed in early 2025) .
-NATO NCIA IT modernization contract (~€100 million+, six years) awarded via Proximus consortium .
-Portuguese “ForceShield” VSHORAD air-defense system via NSPA .
These show active involvement and political support
KERING is ready to fly againKERING has seen his price fall and fall since COVID crisis.
This idea has two majors factors, one are fundamentals and the other is a technical analysis to buy in the correct price.
FUNDAMENTALS
Attractive Valuation
Kering currently trades at approximately 1/3 of the forward price‑to‑earnings multiple of its peer Hermès. Whereas Hermès commands a forward P/E of roughly 54×, Kering’s multiple stands near 15× or below. Translated, investors may acquire an analogous portfolio of high‑end b
AIRBUS STOCK FORMING BEARISH TREND PATTERNAIRBUS STOCK FORMING BEARISH TREND PATTERN.
Price drop sharply after forming high 177.30 and created a lower low.
Market was trading in secondary trend from last few sessions.
After secondary trend, reversal candlestick pattern is been spotted.
Price is expected to remain bearish for upcoming sessions.
On lower side market may hit the targets of 132 $.
On higher side market may test the resistance level of 178$.
Bullish Elliot Wave count on AEDThis is my bullish Elliott Wave count for Aedifica, which I consider the more probable scenario. The corrective structure that began in early February 2020 reached the ideal Fibonacci retracement levels for a sharp correction between 0.5 and 0.618 by October 26, 2023 (not shown in this chart), and has already unfolded over nearly four years.
Despite the fact that price action over the past year has remained largely corrective and we haven’t yet seen a clear impulsive move, I still view this as
Bearish EW count on Aedifica.Last Yellow 5th wave (micro degree) to the downside to end correction that started on 18/02/2020. If prices moves beyond the ending point of Yellow wave 4, then this count would
be invalidated, suggesting that the bullish count is likely underway.
Ps: The bullish count will be posted later.
Short on DERICHEBOURG (DGB)Over sold daily and weekly RSI state.
Major resistance level of 6.5 reached multiple times without breacking.
Big red candle and the next day a shooting star candlestick (not sure about this one but it looks like).
Currently hooked on the 6.0 major support level.
It could go up but I doubt, the seller pressure is truely visible and the resistance at 6.5 was pretty strong.
My safe TP target is 5.680 (-5,80%) which is the next major support level.
Sanofi takes a bold step by acquiring Blueprint MedicinesSanofi Makes Bold Move with $9.5 Billion Acquisition of Blueprint Medicines
By Ion Jauregui – Analyst at ActivTrades
French pharmaceutical giant Sanofi (EPA:SAN) has kicked off 2025 with a bold strategic move: the acquisition of U.S.-based biotech Blueprint Medicines (NASDAQ:BPMC) for up to $9.5 billion. The deal, expected to be the largest healthcare acquisition in Europe this year, includes an upfront payment of $129 per share, plus contingent value rights (CVRs) tied to the commercial succe
Short on PUBLICIS (PUB)I don't see any major support levels above 74.
Big red candle in the middle of 84 => can't go higher than this resistance level, high pressure of sellers.
Short with a TP at 74.
Warnings that makes me not sure: dividends coming soon so a lot of buyers will probably come + oversold RSI.
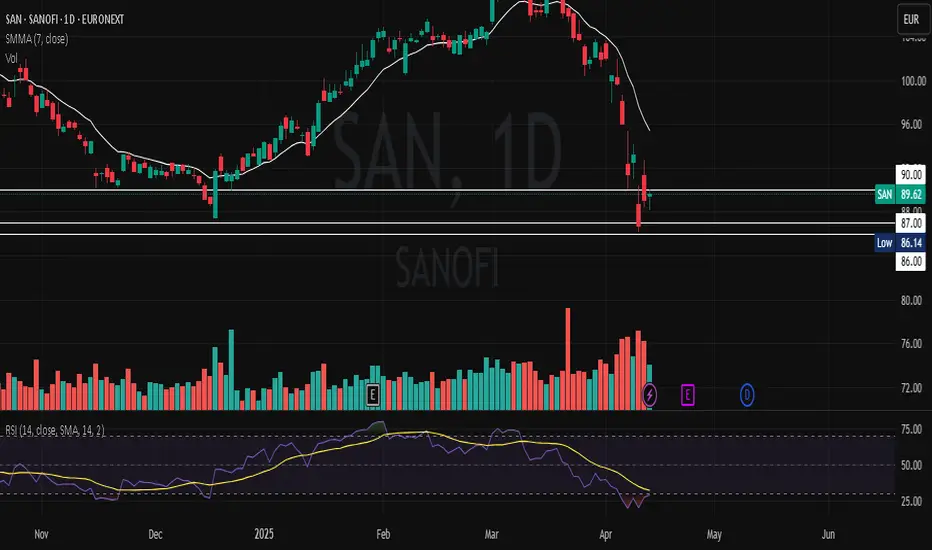
Short on SANOFI (SAN)Short until 87.0 (support zone).
Strong selling pressure confirmed by two large red candles.
Recent green candle shows buyer hesitation (small body, upper wick).
No significant volume to support a bullish rebound.
RSI remains weak but needs surveillance.
Rebound lacking conviction.
Wycoff Accumulation Phase?Carrefour is one of the world's largest grocery retailers, think of it as the European Walmart. But the execution of the business by management could not be any different. We are talking about a 90% decline since it's highs in 1999. Failed market expansion, competition from budget retailers like Aldi and Lidl, online retailers have taken market share. This company has suffered and anyone bag holding this must have written this off as a bad nightmare.
The chart suggests that we could be back in
Ryanair Takes Off Strong Despite TurbulenceBy Ion Jauregui – Analyst, ActivTrades
Ryanair (ISE: RYA) closed its 2024/25 fiscal year with results that—despite some headwinds—demonstrate the resilience of its ultra-low-cost model. The Irish carrier posted a 4 % increase in revenues to €13,950 m, up from €13,444 m in 2023, while net profit fell 16 % to €1,610 m, penalized by fares that were 7 % lower and disputes with online travel agencies that impacted ticket sales. Despite the drop in profitability, Ryanair carried a record 200.2 millio