AIRBUS - Beyond the Backlog: What the Consensus Is Missing𝗖𝘂𝗿𝗿𝗲𝗻𝘁 𝗣𝗿𝗶𝗰𝗲: €189 | 𝗖𝗼𝗻𝘀𝗲𝗻𝘀𝘂𝘀 𝗧𝗮𝗿𝗴𝗲𝘁: €230 | 𝗠𝗼𝗿𝗻𝗶𝗻𝗴𝘀𝘁𝗮𝗿 𝗙𝗩: €165
𝗞𝗲𝘆 𝗗𝗮𝘁𝗲: February 19, 2026 — FY 2025 Earnings Release
𝗧𝗛𝗘𝗦𝗜𝗦: 𝗧𝗛𝗘 "𝗥𝗘𝗖𝗢𝗥𝗗 𝗕𝗔𝗖𝗞𝗟𝗢𝗚 + 𝗕𝗢𝗘𝗜𝗡𝗚 𝗪𝗘𝗔𝗞𝗡𝗘𝗦𝗦 = 𝗕𝗨𝗬" 𝗡𝗔𝗥𝗥𝗔𝗧𝗜𝗩𝗘 𝗜𝗦 𝗦𝗧𝗥𝗨𝗖𝗧𝗨𝗥𝗔𝗟𝗟𝗬 𝗕𝗥𝗢𝗞𝗘𝗡.
Six months ago, Airbus CEO Faury told the US Chamber of Commerce the supply chain had "changed dramatically for the better." On February 3, speaking at the World Governments Summit in Dubai, he told a different story: engines remain the hardest components to source through both 2025 and 2026. His leaked internal memo to staff, seen by Reuters in late January, warned of "unprecedented crises," "unsettling geopolitical developments," and "significant collateral damage, logistically and financially" from US protectionism and US-China trade tensions. He named Pratt & Whitney and CFM engines as Airbus's "most serious difficulties."
This is not analyst speculation. This is the CEO, on the record and off, confirming the problem persists with no resolution timeline. The stock has dropped €31 from its January 13 all-time high above €220 to €189 today. I believe the repricing has further to go. Here's why.
1. 𝗧𝗛𝗘 𝗕𝗔𝗖𝗞𝗟𝗢𝗚 𝗜𝗦 𝗔 𝗠𝗔𝗥𝗚𝗜𝗡 𝗧𝗥𝗔𝗣
The 8,700+ aircraft backlog looks like a fortress. It isn't. These orders were priced in the 2015–2021 low-inflation era with escalation clauses designed for 1–2% annual cost growth. Actual input costs surged 20%+ cumulatively since 2021.
The result: in 2024, Airbus delivered 31 MORE aircraft than 2023 but EBIT fell 8% and EPS declined 6%. More planes shipped, less money made. BofA's own analysis admits better-priced contracts won't dominate until 2028+. That's two more years of structurally compressed margins.
Meanwhile, with a 10-year delivery queue, customers have zero urgency. Delta's CEO publicly stated Delta "will not be paying tariffs" on Airbus deliveries, effectively telling a "supply-constrained monopolist" to absorb costs or lose the order. That's not duopoly pricing power. That's a buyer's market disguised as a seller's market.
2. 𝗕𝗢𝗧𝗛 𝗘𝗡𝗚𝗜𝗡𝗘 𝗢𝗣𝗧𝗜𝗢𝗡𝗦 𝗔𝗥𝗘 𝗙𝗔𝗜𝗟𝗜𝗡𝗚, 𝗔𝗡𝗗 𝗔𝗜𝗥𝗕𝗨𝗦'𝗦 𝗢𝗪𝗡 𝗟𝗘𝗔𝗗𝗘𝗥𝗦𝗛𝗜𝗣 𝗦𝗔𝗬𝗦 𝗦𝗢
This is the most underappreciated risk, and Airbus's own management is now confirming it publicly.
On January 12, departing commercial aircraft CEO Christian Scherer told reporters that A320-family engines continued to arrive "very, very late" throughout 2025. His exact words: "We see that this trend continues in 2026, and in particular with Pratt & Whitney, with whom we are still in discussions." He then revealed that Airbus and P&W have not even agreed on engine supply volumes "for the foreseeable future." That's not a supply chain hiccup. That's a fundamental breakdown in planning between a manufacturer and one of its two sole-source engine suppliers.
Three weeks later, Faury confirmed it again in Dubai: engines are the most difficult components to procure in both 2025 and 2026. In his internal memo, he went further, naming both P&W and CFM as the company's "most serious difficulties."
Now look at the specifics.
On the Pratt & Whitney side: 835 aircraft grounded globally, 38% of the PW-powered A320neo fleet out of service, 300-day shop visits, recovery timeline extending to 2030 per P&W's own admission. Air Astana's CEO called it "a significant overall design problem," not a temporary recall.
On the CFM side, the supposed "safe choice" now on 75% of A320neo orders: HPT blades wearing prematurely in hot/dusty environments. Fuel nozzle coking issues. The durability fix was only certified December 2024. Q1 2025 LEAP deliveries fell 13% YoY. British Airways' CTO revealed that NONE of their engine deliveries arrived on schedule in 2025.
Airbus had 60 fully assembled "gliders" sitting in storage waiting for engines at the middle of last year. Scherer said the number is now "low" and "manageable," but only because Airbus cut its delivery target from 820 to 790 in the first place.
The 75/month A320 production target for 2027 requires roughly 150 engines/month from two suppliers who can't meet current demand and haven't committed to future volumes. The A220 needs 14/month to break even, already delayed to end-2026, currently at around 12.
3. 𝗦𝗜𝗫-𝗬𝗘𝗔𝗥-𝗢𝗟𝗗 𝗣𝗟𝗔𝗡𝗘𝗦 𝗕𝗘𝗜𝗡𝗚 𝗦𝗖𝗥𝗔𝗣𝗣𝗘𝗗 𝗙𝗢𝗥 𝗣𝗔𝗥𝗧𝗦
This is the chart that should terrify Airbus investors: two GTF engines leased separately at $250K/month each = $500K. Leasing the entire aircraft with engines = $460K. The engines are worth more than the plane.
Six-year-old A321neos are being dismantled in Castellon, Spain. EgyptAir sold its entire 12-aircraft A220 fleet for around $300M when the list price was over $1 billion. SWISS grounded its entire A220-100 sub-fleet to cannibalize engines for its A220-300s. Air Austral is retiring its A220s by summer 2026, with aircraft averaging 4.5 years old.
When your product is worth more dead than alive at age six, your business model has a problem.
4. 𝗦𝗔𝗙𝗘𝗧𝗬 𝗖𝗥𝗘𝗗𝗜𝗕𝗜𝗟𝗜𝗧𝗬 𝗜𝗦 𝗘𝗥𝗢𝗗𝗜𝗡𝗚
In November 2025 alone:
• 𝗘𝗟𝗔𝗖 𝗿𝗲𝗰𝗮𝗹𝗹: roughly 6,000 A320-family aircraft (60% of global fleet) grounded after an uncommanded pitch-down on a JetBlue flight injured 15. Airbus blamed "solar radiation." Engineers note the fix was literally rolling back to previous software; the new version introduced the vulnerability. Largest single-model recall since 737 MAX.
• 𝗔350 𝗳𝗹𝗶𝗴𝗵𝘁 𝗰𝗼𝗻𝘁𝗿𝗼𝗹 𝗔𝗗: FAA mandated software updates after hydraulic fluid contamination could cause uncommanded rudder/elevator movements, bypassing pilot overrides.
• 𝗔320 𝗳𝘂𝘀𝗲𝗹𝗮𝗴𝗲 𝗽𝗮𝗻𝗲𝗹 𝗱𝗲𝗳𝗲𝗰𝘁: Flawed panels from a Spanish supplier forced delivery target cut from 820 to roughly 790. Scherer said the panel issue, not engines, was what ultimately caused the missed target.
• 𝗚𝗧𝗙 𝗰𝗼𝗹𝗱-𝘄𝗲𝗮𝘁𝗵𝗲𝗿 𝗿𝗲𝘀𝘁𝗿𝗶𝗰𝘁𝗶𝗼𝗻𝘀: New takeoff limitations under freezing fog for PW-powered aircraft.
All in the same month. The A350 also has ongoing weather radar reliability issues (Honeywell fix not available until mid-2026), the unresolved Qatar Airways paint/skin degradation dispute, and A350 deliveries that stagnated in 2025 due to fuselage section problems inherited from Spirit Aerosystems.
5. 𝗖𝗢𝗠𝗣𝗘𝗧𝗜𝗧𝗜𝗩𝗘 𝗟𝗔𝗡𝗗𝗦𝗖𝗔𝗣𝗘 𝗦𝗛𝗜𝗙𝗧𝗜𝗡𝗚
Faury publicly acknowledged COMAC as a "serious long-term competitor" in both his February 2026 Dubai appearance and the January memo. At Dubai he conceded there is "probably room for other players" given the level of demand. That's a striking concession from a duopoly incumbent. China is the world's second-largest aviation market and historically Airbus's largest single-country customer. COMAC has 1,000+ C919 orders, almost entirely Chinese airlines. Meanwhile, Faury has reportedly conceded defeat on net new orders after a wave of Boeing deals tied to US foreign policy tours.
Boeing remains wounded but the 737 MAX uses only LEAP-1B. It completely avoids the GTF contamination crisis. If Boeing stabilises production, it competes with a cleaner engine story.
𝗕𝗢𝗧𝗧𝗢𝗠 𝗟𝗜𝗡𝗘
At €189, Airbus trades at roughly 37x trailing earnings for a company whose own CEO privately warns of "unprecedented crises" and publicly confirms engine shortages will persist through 2026, whose departing commercial chief admitted engines arrive "very, very late" with no supply agreement in place for the foreseeable future, whose margins are compressing despite growing deliveries, whose aircraft are being scrapped at age six for parts, and whose safety record just suffered its worst month since the A320 entered service.
The consensus €230 target assumes none of these structural issues matter. Morningstar at €165 assumes they do. The February 19 earnings will determine which narrative wins.
I'm watching the €185 zone. If that breaks, the market is pricing structural, not cyclical, risk.  Short
Short
 Long
Long
 Long
Long
Long 
Rise of AFME (French)Quick look at Affluent Medical (AFME.PA) on the weekly chart: after years of brutal downtrend from IPO we finally have the first real signs of a technical reversal heading into 2026.
Key Technicals (Ichimoku 9-26-52):Current price ~€1.855 (recent close +0.27%, with some intraday strength)
Breakout above the Kumo (light green cloud: Span A ~1.743 > Span B ~1.695)
Bullish crossover : Tenkan-sen (1.780) > Kijun-sen (1.705)
Chikou Span free above past prices → confirmed bullish momentum
Major support: €1.695-1.705 (cloud base + historical low zone)
Resistances : €1.90-2.00 (first hurdle), then €2.20-2.45 (2025 highs), mid-term target €2.50-3.00+ if volume picks up
The cloud is thin and rising ahead → bullish window open as long as we hold above ~€1.74.Fundamental Driver (the big one):Dec 2025 bombshell: Acquisition of Caranx Medical + Artedrone → creation of Carvolix (mini-robotic cardiovascular platform powered by AI)
TAVIPILOT (AI-guided TAVI software): FDA clearance July 2025, first commercial US rollout expected early 2026!
Massive addressable market: TAVI, stroke thrombectomy, mitral valve (~€23B+ potential)
EGM on Jan 30, 2026 to approve deals + financing (Truffle Capital + Edwards Lifesciences up to €30M)
Analyst consensus : Average PT ~€3.27-3.72 (highs up to €3.80-4.83) → +70-100%+ upside from here
Classic small-cap medtech risks: dilution, cash burn, clinical delays... but the newsflow since late 2025 has been extremely positive (Artus pivotal phase green light, Epygon TCT data, etc.).6-Month Scenario:Bull case: €2.20 → €2.80+ if milestones hit (TAVIPILOT launch, robot implants, strong EGM vote)
Bear case : Drop below €1.70 if heavy dilution or small-cap sell-off
Personally, this looks like an asymmetric bullish setup: limited downside to cloud support, huge catalyst-driven upside.
#AFME #MedTech #Ichimoku #Euronext #SmallCap #AI #Robotics
 Long
Long
 Short
Short
 Long
Long
 Long
Long
 Long
Long
Galp strengthens its Iberian strategy with MoeveIon Jauregui - Analyst at ActivTrades
Galp Energia has taken a significant strategic step by reaching a non-binding agreement with Moeve to integrate their downstream businesses in the Iberian Peninsula. The transaction, which aims to create two platforms with European scale —IndustrialCo and RetailCo— seeks to strengthen competitiveness against major players such as Repsol and to accelerate the energy transition using existing assets.
The transaction: size, scale, and strategic focus
The alliance envisages the merger of both companies’ service station networks, creating a pan-Iberian network of approximately 3,500 points of sale across Spain and Portugal. Under this structure, Galp’s service stations in Spain would largely transition to the Moeve brand, while those in Portugal would operate under the Galp brand, with Ballenoil remaining as a third brand.
On the industrial side, Galp would contribute its key asset, the Sines refinery, one of the most competitive complexes in Southern Europe, currently undergoing a transition toward a lower-carbon profile. Notable projects include advanced biofuels (HVO/SAF) and a 100 MW green hydrogen electrolyser, aligned with decarbonisation and energy security objectives.
Galp would retain more than 20% of IndustrialCo and shared control of RetailCo, while continuing to be listed on the Portuguese stock exchange. This structure allows Galp to preserve strategic assets outside the scope of the integration, such as upstream and renewables.
Fundamental analysis of Galp
From a fundamental perspective, the transaction is positive for Galp for several reasons. First, it allows the company to unlock value from mature industrial assets, reduce operational risks, and gain scale in retail without assuming full control. Second, it strengthens Galp’s positioning in electric mobility, convenience solutions, and end customers —segments with higher margins and recurring revenues.
In addition, the alliance improves the visibility of future cash flows, supports capital discipline, and reinforces Galp’s defensive profile in an environment of gradual energy transition.
Technical analysis of Galp
From a technical standpoint, the long-term structure remains broadly range-bound. In the short term, the company experienced sharp corrections in December last year, causing the 50- and 100-day moving averages to fall below the 200-day moving average. More recent news has driven a recovery from the lows around EUR 13.960 to the current price near EUR 15.455. The current Point of Control (POC) is located around EUR 15.843.
The stock is currently supported by the 50-day moving average, while the most relevant resistance lies first at the long-term average zone and subsequently at the highs reached last November at EUR 18.505. If the recovery trend is maintained, the price could target these highs and act as a catalyst for a new bullish leg. Conversely, failure to decisively break above the long-term average could be interpreted negatively by the market.
The RSI indicator is currently in neutral territory after having recently touched lows. The MACD also points to a recovery process, with a positive histogram but signal lines still below it, indicating some underlying weakness and buying interest concentrated around the current support level. The market interprets the transaction as structurally positive, although not without regulatory and execution risks between both companies, which has at least allowed the stock to embark on an apparent recovery path. Additionally, the ActivTrades Europe Market Pulse indicator signals an increase in RISK-ON sentiment, which could lead to partial profit-taking in stocks with stronger recent performance.
Moeve strengthens Galp Portugal
The potential integration with Moeve reinforces Galp’s strategic narrative: scale, specialisation, and a pragmatic energy transition. In the medium term, the transaction could act as an additional catalyst for the stock, provided that definitive terms are finalised and financial discipline is maintained.
*******************************************************************************************
The information provided does not constitute investment research. The material has not been prepared in accordance with the legal requirements designed to promote the independence of investment research and such should be considered a marketing communication.
All information has been prepared by ActivTrades ("AT"). The information does not contain a record of AT's prices, or an offer of or solicitation for a transaction in any financial instrument. No representation or warranty is given as to the accuracy or completeness of this information.
Any material provided does not have regard to the specific investment objective and financial situation of any person who may receive it. Past performance and forecasting are not a synonym of a reliable indicator of future performance. AT provides an execution-only service. Consequently, any person acting on the information provided does so at their own risk. Political risk is unpredictable. Central bank actions can vary. Platform tools do not guarantee success.
 Long
Long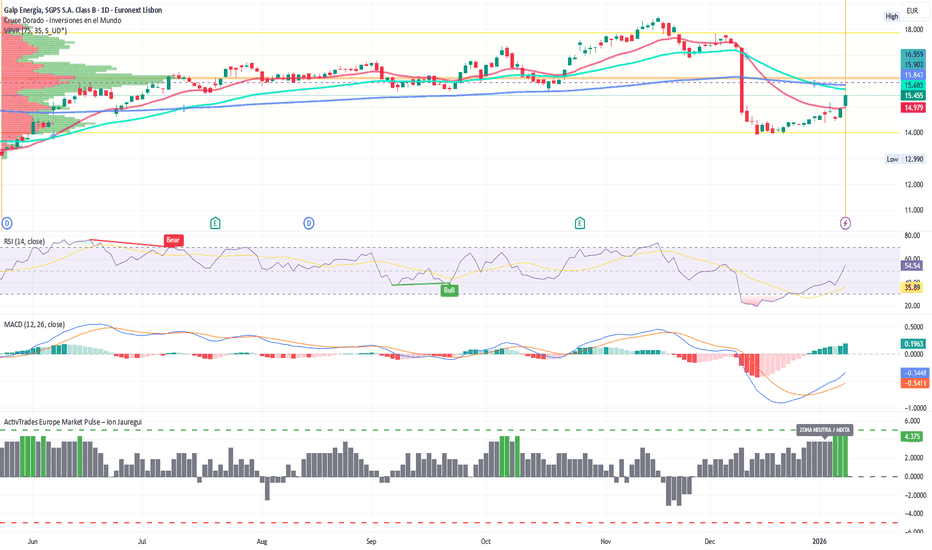
 Long
Long
 Long
Long
1st HL after MSR Bullish div on Daily IMCD #000191st HL after bullish missing right shoulder divergence on daily, also bullish div on weekly which acknowledges a possible upmove which can be seen on the daily.
V2 trigger on daily as well, forming the low.
Up after 1st HL, expectation is first target on 2 ATR when 1st higher high forms , then I take 33% out, remainder remains to be seen, I expect to exit another 33% on 3 ATR and remainder on 1 ATR 1W.
1st TP: 80,89
2st TP: 82,99
3st TP: 92,48
E: 77,36
SL: 75,48
R/R: 1:1.88
This is trade #00019
Closed 13 trades now.
Hitrate 13 out 18 trades = 72.22%
 Long
Long
ETL in an accumulation zoneEutelast is down roughly 96% from its all-time high, which strongly suggests that the macro Elliott Wave 5 cycle may be complete. After such a prolonged decline, the stock appears to have formed a bottom and entered an accumulation phase, with price moving sideways and selling pressure largely exhausted.
From a strategic perspective, Eutelsat has the potential to become increasingly valuable in satellite internet, secure communications, and military intelligence, especially as European defense and digital sovereignty gain priority.
Given this setup, I see ETL as a long-term opportunity rather than a short-term trade. My approach is to accumulate shares monthly, averaging into the position and allowing time for the thesis to play out.
If execution improves and strategic demand materializes, ETL could offer significant upside over the next 10 years, making it an interesting European growth-and-defense play.  Long
Long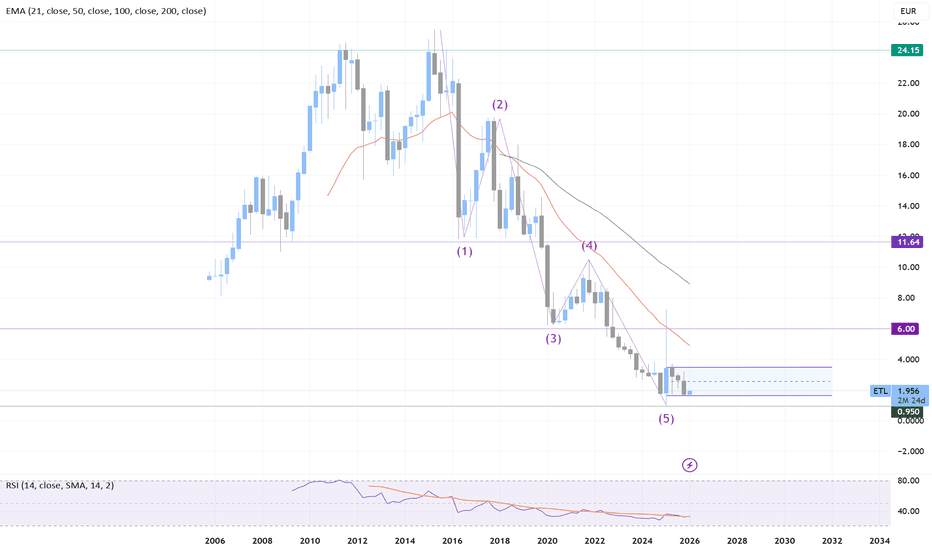
 Long
Long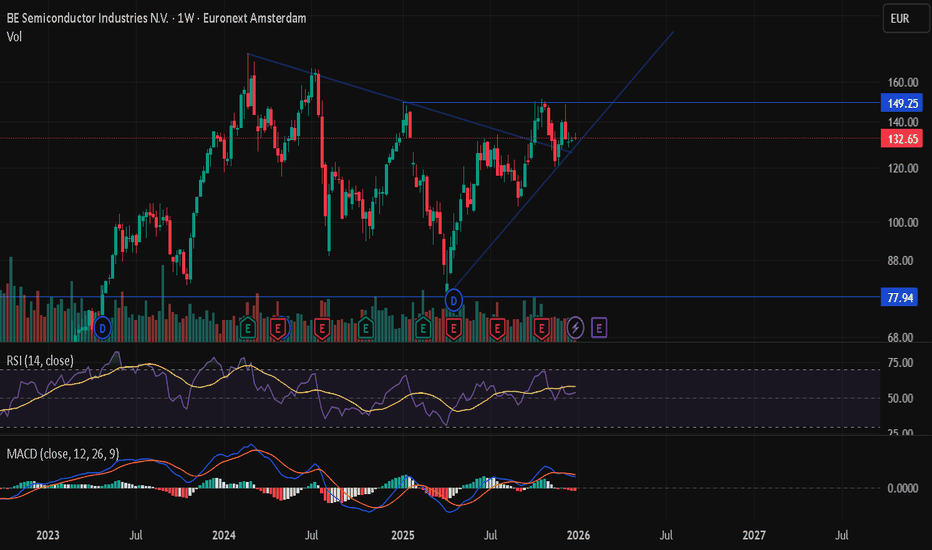
BESI Bullish ContinuationAfter a period of movement within this bull flag pattern, BESI looks ready for bullish continuation after retesting the upper trendline of the bull flag.
Fundamentally this adds up given the increasing demand in chips used for different technologies including AI.
What Besi Does:
- Designs & Builds Machines: They create the specialized equipment that semiconductor manufacturers use to build and package chips.
- Focuses on Advanced Packaging: Their technology supports traditional leadframe packaging, substrate-based packaging, and cutting-edge wafer-level packaging (like hybrid bonding) for complex chips.
- Provides Key Processes: Their equipment handles tasks like die bonding, molding the chip, trimming the leads, and marking the final package.
- Serves High-Growth Markets: They are crucial suppliers for consumer electronics, mobile internet devices, automotive systems, and increasingly, AI and high-performance computing.
I believe this will be a good stock to hold for 2026.
Long 
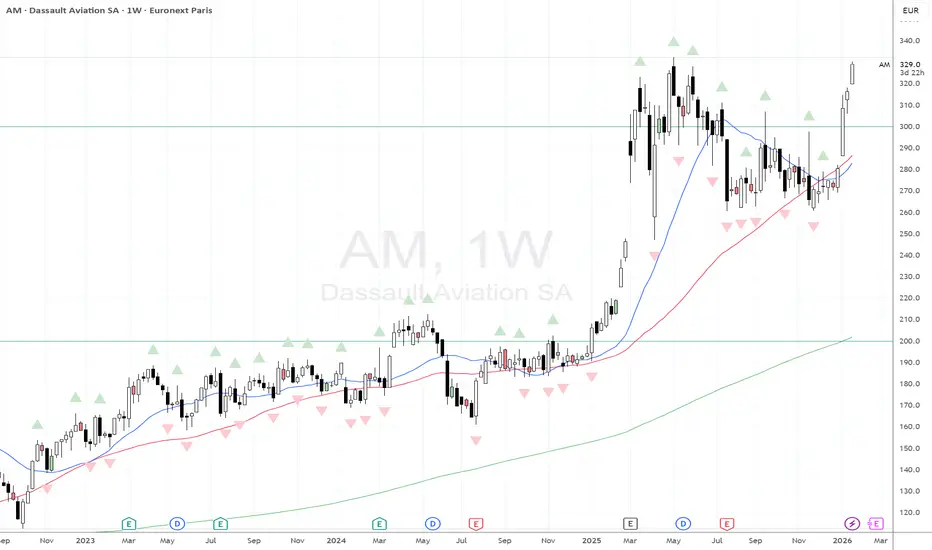
Dassault Aviation Société AnonymeFor my last idea of the year I have chosen to write one about Dassault Aviation. I really find aerospace and defense companies to be the most interesting to me in all of the stock market. As a matter of fact the majority of my holdings are invested into aerospace and defense companies. Aeronautics has always been an extremely competitive industry, ever since the first airplanes, engineers constantly strive to make the technology better, faster, safer and more cost effective.
I chose Dassault because I think the Rafale fighter program has a competitive advantage over the rest of the competition for the moment. There was also some issues, I remember around March of 2025 I saw on the news about how some nations were concerned with the credibility of the US and some nations even cancelled or suspended contracts with Lockheed Martin to delay F-35 purchases. I don't want to talk about that too much because I don't really know what is going on with that topic of discussion to tell you the truth. I do know nations take their national security very seriously though and aerospace and defense is no exception.
Like most aerospace and defense companies right now it is difficult to see very much upside intrinsically speaking. The sector has had some really nice attention and momentum this year, I don't see why it wouldn't continue into 2026 and beyond. I think its important to realize I am not really speculating about the topic though. I am not trying to say "buy it because I think it will go up". I think good ideas are just as important in the stock market as risk management itself and if you ask me I don't think its worth risking very much on Dassault right now.
Primary capital allocation is designated to research and development, industrial infrastructure and supply chain management. These are important elements when we look at the price of Dassault on a chart because the capital expenditures are primarily why certain price actions occur in real time. For example, if the company needs money to finance something new, the price of the shares might drop temporarily as money is being spent, alternatively if they get a new contract and its a big deal, they expect to make a lot of money from it the share price might go up. This is why I love these industrial companies, because we all know the products the company is providing is going to need a lot of maintenance over the years.
The company actively partakes in employee share programs, Dassault has allocated hundreds of millions of Euros toward employee incentives and profit-sharing in the current fiscal cycle. The company also likes to reward shareholders by engaging in share buy back programs from time to time. There is also a slight dividend that the company pays out as well if that is something you receive then you will know it helps out the portfolio a little bit.
The company has a pretty large cash position valued at about €10 billion at the end of 2025. This is primarily from advanced payments received by nations for major Rafale export contracts. Currently there is a record breaking order backlog on aircraft orders going into 2026, there is about €48 billion in backlog value. Don't quote me on this though because that was the value about 6 months ago so today it could be a little more or less, the value doesn't really matter to us as retail investors but I am just saying it for context. The company plans to take care of this backlog in a timely manner though, they plan to invest in more industrial capacity.
Recently the company celebrated production of its 300th Rafale fighter jet, and announced plans to increase production rates to four aircraft per month in the coming years to ensure deliveries stretch reliably into the 2030s. I think the stock would make a fine addition to any properly diversified portfolio as long as you understand the potential risks associated. Its a pretty interesting company I think there's definitely some great information on the internet and I am happy that I got to write this idea and share some information today.
Merry Christmas and thanks for putting up with me. Hope you enjoyed the idea.  Long
Long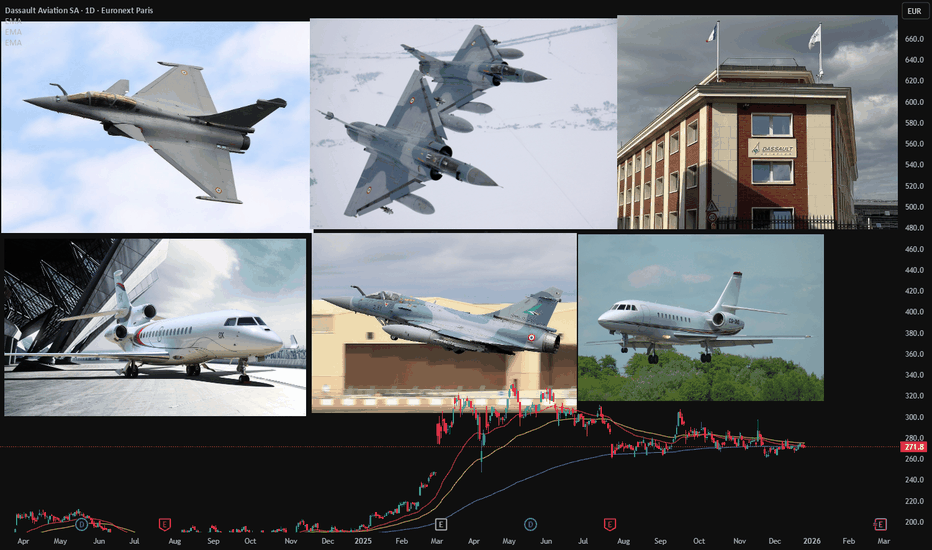
Long 
FDJ: A Technically Strong and Fundamentally Solid SupportFDJ (Française des Jeux) shares are currently approaching a historical zone of major technical support, located between €18 and €22. The stock has not yet entered this strong support zone, but it deserves close monitoring, as there are solid fundamental arguments that give this level credibility and make it likely that this support zone could generate a bullish reaction in the stock. While technical analysis highlights a price area that has historically been defended, the key question for investors remains the following: is this level purely technical, or is it also fundamentally justified? The answer requires nuance, but several elements clearly argue in favor of an economically “defendable” support for FDJ shares.
The first pillar of the FDJ investment thesis remains its legal monopoly in France. The company benefits from an exclusive concession covering lotteries, scratch cards, and sports betting in physical points of sale, secured until 2044. This situation provides rare visibility on future revenue streams and creates nearly insurmountable barriers to entry. Very few listed companies enjoy such a high degree of regulatory protection, which historically explains the valuation premium granted to the stock.
In addition to this visibility, FDJ demonstrates a particularly robust cash generation capacity. The company posts high margins, limited capital expenditure requirements, and structurally positive free cash flow. Even in a more challenging macroeconomic environment, the business model has proven resilient. This cash-flow quality is a key argument for long-term investors when the stock revisits historically low price levels.
Dividend policy also plays a stabilizing role. Distributions are regular, sustainable, and supported by a low-cyclicality business model. Following the share price correction, the dividend yield becomes attractive again, which tends to reinforce interest from income-oriented funds and to create a psychological floor around the current support area. This does not guarantee an immediate rebound, but it limits the risk of prolonged investor disengagement at these levels.
Furthermore, the gradual digitalization of the business provides a measured but profitable growth driver. FDJ has so far managed to develop its digital channels without destabilizing its physical network, while improving margin mix and customer insight. This evolution helps modernize the business model without significantly increasing its risk profile.
However, caution remains warranted. Regulatory pressure, sector-specific taxation, and structurally moderate growth justify the fact that the stock may not automatically return to its previous highs. Nonetheless, a reaction around this strong technical support zone between €18 and €22 appears plausible. The current support is therefore not a certainty of trend reversal, but rather a zone where the risk-reward profile becomes attractive again from both a technical and fundamental standpoint.
DISCLAIMER:
This content is intended for individuals who are familiar with financial markets and instruments and is for information purposes only. The presented idea (including market commentary, market data and observations) is not a work product of any research department of Swissquote or its affiliates. This material is intended to highlight market action and does not constitute investment, legal or tax advice. If you are a retail investor or lack experience in trading complex financial products, it is advisable to seek professional advice from licensed advisor before making any financial decisions.
This content is not intended to manipulate the market or encourage any specific financial behavior.
Swissquote makes no representation or warranty as to the quality, completeness, accuracy, comprehensiveness or non-infringement of such content. The views expressed are those of the consultant and are provided for educational purposes only. Any information provided relating to a product or market should not be construed as recommending an investment strategy or transaction. Past performance is not a guarantee of future results.
Swissquote and its employees and representatives shall in no event be held liable for any damages or losses arising directly or indirectly from decisions made on the basis of this content.
The use of any third-party brands or trademarks is for information only and does not imply endorsement by Swissquote, or that the trademark owner has authorised Swissquote to promote its products or services.
Swissquote is the marketing brand for the activities of Swissquote Bank Ltd (Switzerland) regulated by FINMA, Swissquote Capital Markets Limited regulated by CySEC (Cyprus), Swissquote Bank Europe SA (Luxembourg) regulated by the CSSF, Swissquote Ltd (UK) regulated by the FCA, Swissquote Financial Services (Malta) Ltd regulated by the Malta Financial Services Authority, Swissquote MEA Ltd. (UAE) regulated by the Dubai Financial Services Authority, Swissquote Pte Ltd (Singapore) regulated by the Monetary Authority of Singapore, Swissquote Asia Limited (Hong Kong) licensed by the Hong Kong Securities and Futures Commission (SFC) and Swissquote South Africa (Pty) Ltd supervised by the FSCA.
Products and services of Swissquote are only intended for those permitted to receive them under local law.
All investments carry a degree of risk. The risk of loss in trading or holding financial instruments can be substantial. The value of financial instruments, including but not limited to stocks, bonds, cryptocurrencies, and other assets, can fluctuate both upwards and downwards. There is a significant risk of financial loss when buying, selling, holding, staking, or investing in these instruments. SQBE makes no recommendations regarding any specific investment, transaction, or the use of any particular investment strategy.
CFDs are complex instruments and come with a high risk of losing money rapidly due to leverage. The vast majority of retail client accounts suffer capital losses when trading in CFDs. You should consider whether you understand how CFDs work and whether you can afford to take the high risk of losing your money.
Digital Assets are unregulated in most countries and consumer protection rules may not apply. As highly volatile speculative investments, Digital Assets are not suitable for investors without a high-risk tolerance. Make sure you understand each Digital Asset before you trade.
Cryptocurrencies are not considered legal tender in some jurisdictions and are subject to regulatory uncertainties.
The use of Internet-based systems can involve high risks, including, but not limited to, fraud, cyber-attacks, network and communication failures, as well as identity theft and phishing attacks related to crypto-assets.