Dogecoin (DOGE/USD) — A Long-Term Elliott Wave Perspective
On the weekly chart, Dogecoin continues to present a potential large-degree five-wave impulse structure.
As with the long-term structures I have previously shared for Bitcoin and Ethereum, DOGE may currently be developing within Wave IV of this larger impulse.
At the aggressive count, Wave IV can be interpreted as a large sideways correction composed of two larger zigzags connected by an intervening wave. This connecting wave itself may take the form of a Triple Zigzag and, from a geometric perspective, shows similarities to an Expanded Diagonal structure.
Within this interpretation, Wave Y is currently developing as a classic Simple Zigzag, and price has already reached the initial targets identified on the chart.
The reaction at the next target zones will now become increasingly important.
A sustained move higher and a confirmed breakout from the corrective channels shown on the chart could provide the first significant evidence that the correction is complete and that the next bullish phase is beginning.
Each channel breakout may provide additional confirmation step by step. However, the reaction following the breakout, the ability of price to hold above the broken structure, and the subsequent development of the bullish pattern will remain important.
A More Conservative Alternative Count
At the same time, a more conservative interpretation must also remain on the table.
In this scenario, the same Expanded Diagonal that is interpreted as Wave X within the aggressive count could instead represent Wave 1 of a higher-degree Wave 5.
If this interpretation is correct, the recent decline could be developing as a Simple Zigzag, forming Wave 2 of a higher-degree Wave 5.
The key condition for this scenario is that the current correction must not move beyond the origin of Wave 1.
As long as that critical low remains intact, the possibility remains that the market is still completing Wave 2 before beginning the next larger advance.
A break above the corrective structure, followed by the development of a sustained bullish move, could then provide confirmation that Wave 2 has completed and that the market is entering Wave 3 of the larger Wave 5.
Two Counts — One Potentially Bullish Path
The interesting aspect of these two interpretations is that both can ultimately lead to a bullish outcome. The primary difference is the degree of the wave count and the position of the current structure within the larger Elliott Wave sequence.
Under the aggressive interpretation, the larger correction may already be approaching completion, allowing the market to transition directly into the next bullish phase.
Under the conservative interpretation, the market may first need to complete Wave 2 of a higher-degree Wave 5. As long as the key Wave 1 low holds, the next advance could then develop as Wave 3.
For now, the key factors to monitor are:
Price reaction at the next target zones;
Confirmed breakouts from the corrective channels;
The preservation of the key Wave 1 origin in the conservative count;
And the development of a valid bullish structure following the breakout.
Until these confirmations appear, patience remains essential.
The market will ultimately reveal which wave count is correct through its structure.
— Mr. Nobody | Elliott Wave Principle
DOGE
Dec 15, 2023
Doge In Strong Bullish Market, Five Wave Up
 Long
Long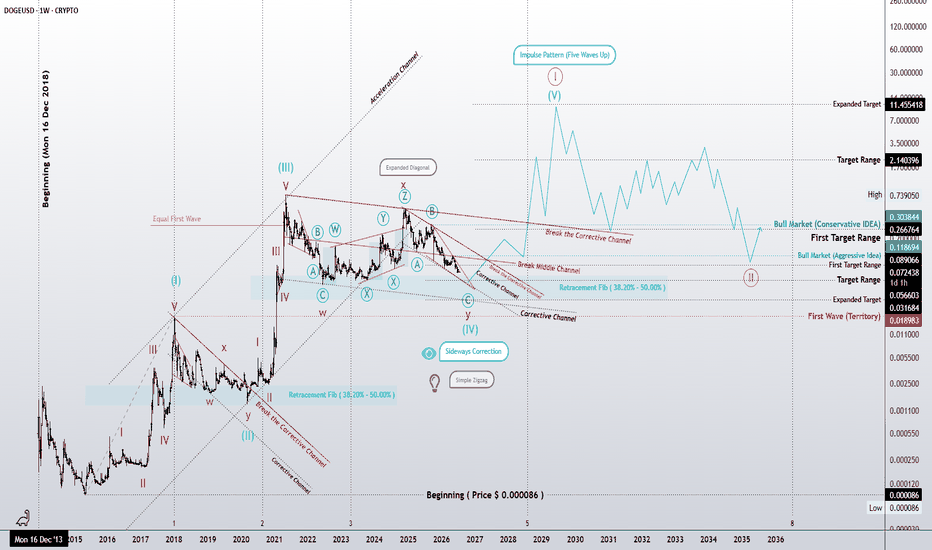
 Long
Long
 Short
Short
 Short
Short
Long 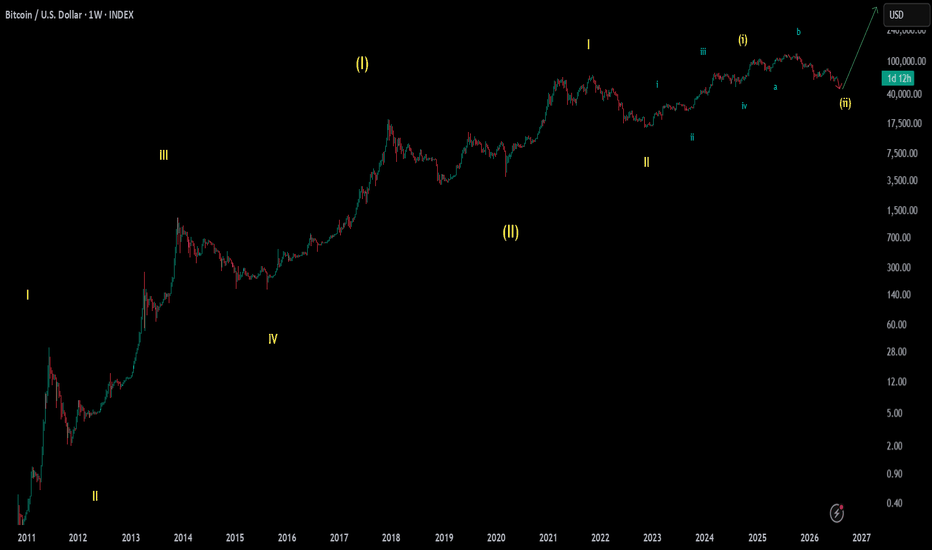
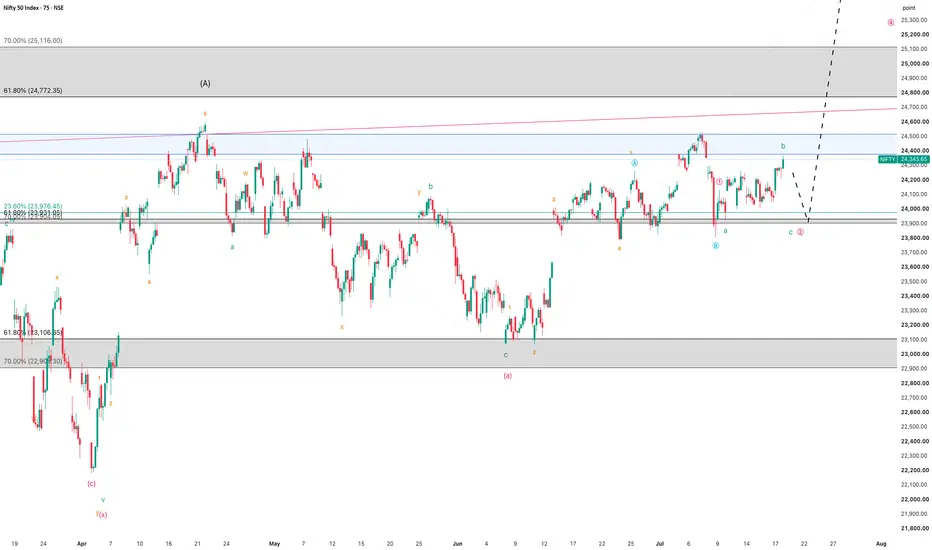
Nifty Weekly Elliott Wave Analysis | 20–24 July, 2026Wrap-up:-
As discussed in my previous Mid-Term NIFTY Analysis (Weekly Chart published on 1 1 July 2026 ), the market continues to trade within Wave Y of Wave X of the larger Major Wave 4 corrective structure.
Within Wave Y, Wave A concluded at 24,601, and Wave B is currently unfolding.
Based on the latest price structure, Wave B appears to be developing as an ABC Irregular Correction.
The internal structure is currently interpreted as follows:
Internal Wave A of Wave B completed at 23,070.
Internal Wave B is currently unfolding.
Within this Internal Wave B:
Internal Wave A completed at 24,261.
Internal Wave B concluded at 23,805, by forming an Irregular Correction , as NIFTY moved below the 38.2% Fibonacci retracement level (23,972) .
Consequently, Internal Wave C is now expected to be in progress.
What I'm Watching | 20 July – 24 July 2026
With the apparent completion of Internal Wave B within the ongoing corrective structure, the market may now be transitioning into Internal Wave C .
Within this wave:
Wave 1 appears to have completed at 24,134.
Wave 2 is currently in progress.
If this wave count remains valid, the completion of Wave 2 could pave the way for Wave 3 , which is typically the strongest and most impulsive leg in an Elliott Wave sequence.
A sustained move above key resistance levels would strengthen the bullish case.
Key Levels to Watch
Immediate Resistance: 24,530
Major Resistance: 24,601
Bullish Projection: 25,000–26,200 (subject to wave confirmation)
Trend Bias: Bullish , unless the current Elliott Wave structure is invalidated.
Professional View:
The broader structure continues to favour a bullish outlook, provided the current Elliott Wave count remains intact. While short-term volatility may persist during the completion of Wave 2, price action above key support levels would increase the probability of an impulsive advance toward higher resistance zones.
As always, confirmation through price action is more important than anticipation. Traders should monitor the validity of the wave structure and manage risk accordingly.
Disclaimer: This analysis reflects my personal interpretation of the market using Elliott Wave Theory and is shared strictly for educational purposes only. It should not be considered financial or investment advice.
"Don't predict the market. Decode it."  Long
Long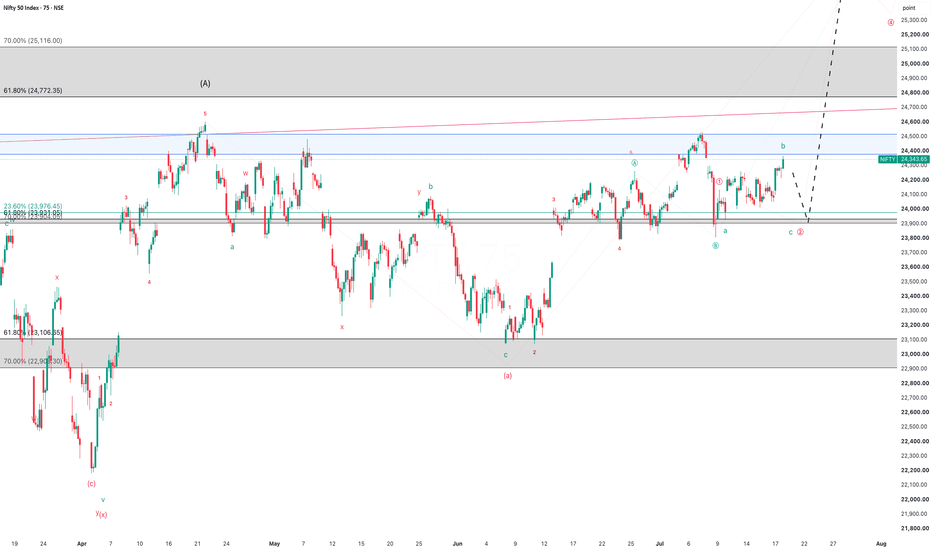
 Short
Short
 Long
Long
 Short
Short
 Long
Long
 Long
Long
Long 
Market Summer Volatility Leads to OpportunityThe market recently pushed to new highs in June and is now undergoing what I would describe as a correction in time, with price consolidating in a choppy, sideways range rather than experiencing a meaningful decline. This type of price action often serves to reset sentiment and momentum while allowing moving averages and other technical indicators to catch up with price.
I've seen many traders calling this a local top, while others believe the current structure resembles a diamond or triangle pattern that is setting up for a significant breakout—or breakdown. While those scenarios are certainly possible, I believe it's important to consider the broader market context rather than focusing solely on the pattern itself.
From a seasonal perspective, July has historically been one of the stronger months for equities. Looking at long-term market statistics, the Nasdaq has typically delivered positive returns during July, with an average gain of approximately 2%. Although seasonality should never be used in isolation, it can provide a valuable tailwind when combined with a favorable technical setup.
The scenario I currently favour is a brief fake-out that traps both buyers and sellers on the wrong side of the market before the primary trend resumes. A pullback toward the Anchored VWAP from the March low would represent a healthy retracement within the broader uptrend while providing an area where institutional buying interest could emerge. This level also aligns closely with the Nasdaq's most recent swing low established in early June, creating a compelling area of technical confluence.
From an Elliott Wave perspective, the current consolidation also has the characteristics of a combination correction. Rather than correcting primarily through price, the market appears to be correcting through both time and structure, frustrating participants with prolonged sideways movement before potentially continuing the larger impulsive trend. This type of correction often creates uncertainty, which is precisely why false breakouts and breakdowns become increasingly common as the pattern matures.
Overall, I believe this pullback could present an attractive opportunity to establish a long position in the Nasdaq if the scenario unfolds as expected. For traders using TQQQ, a stop-loss of approximately 10%—roughly equivalent to a 3% move in the Nasdaq offers a reasonable level of risk. If the correction completes and the market rotates back toward its all-time highs during the summer months, the setup could offer a favorable risk-to-reward profile, with upside potential in the range of 20–30% on TQQQ.
 Long
Long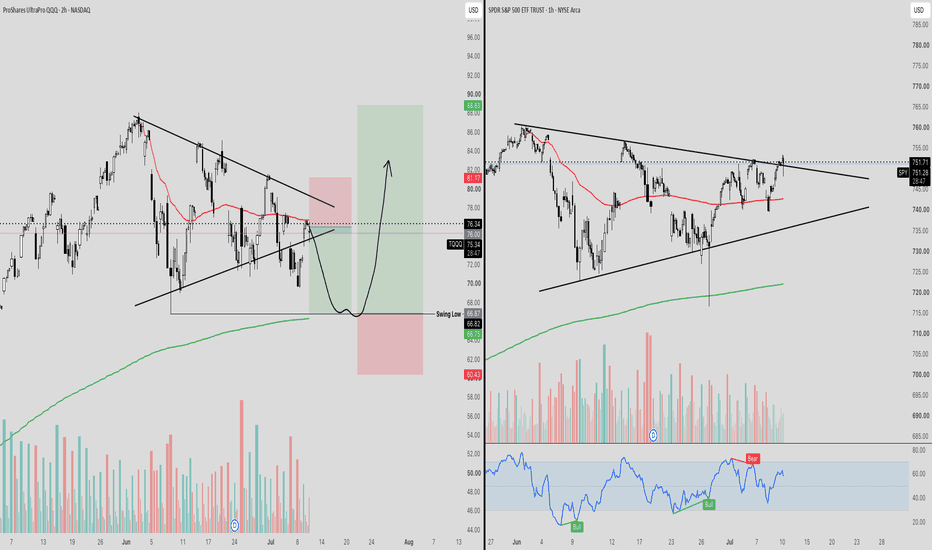
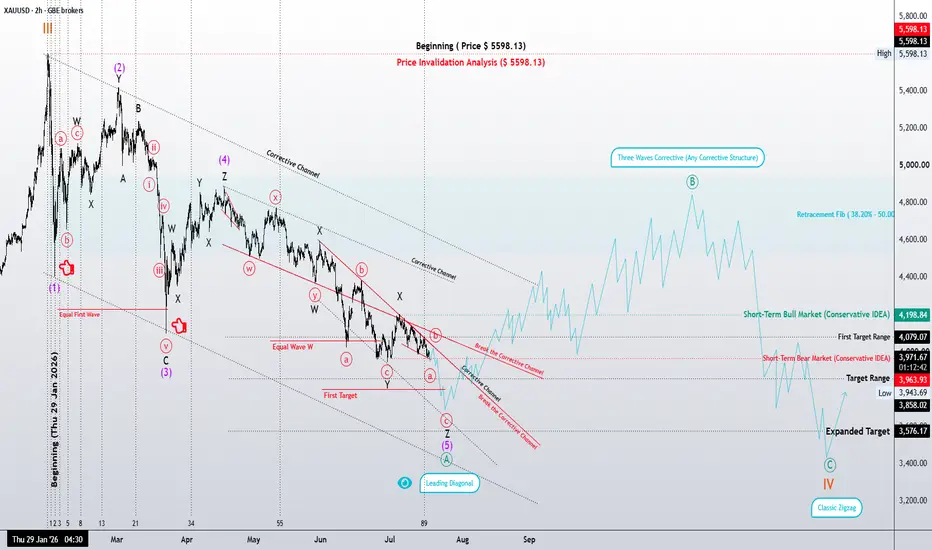
Gold | One More Wave… or Has Wave B Already Begun?XAUUSD | 2H Elliott Wave Update
According to the higher-degree Weekly and Daily wave counts, Gold continues to develop Wave IV. This analysis is based on the Elliott Wave Principle, following both its core rules and structural guidelines while focusing on market structure rather than price prediction.
The primary focus of this update is a Leading Diagonal, currently identified as part of Wave A. Price has now reached a region where this structure may be complete. However, until the market provides structural confirmation, the Leading Diagonal cannot be considered finished with certainty.
According to the Elliott Wave Principle, Waves 2 and 4 within a Leading Diagonal must unfold as Zigzag corrections, whether single, double, or triple. Likewise, Waves 1, 3, and 5 may develop either as Impulses or as Zigzags, with those Zigzags also appearing in single or multiple forms.
At the current stage, Wave 5 of the Leading Diagonal is displaying signs of structural complexity. Therefore, two scenarios remain equally valid. The first suggests that the Leading Diagonal has already been completed and the market is ready to begin Wave B. The second assumes that one final minor decline—or a brief capitulation move—is still required before the diagonal can be considered complete.
From a structural perspective, a confirmed breakout above the descending corrective channel would provide the first meaningful evidence that Wave B has begun. Until then, additional downside movement within the current structure remains a valid possibility.
Once the Leading Diagonal is confirmed complete, the preferred scenario is for Wave B to unfold, followed by Wave C, ultimately completing Wave IV as a classic A–B–C Zigzag. Fibonacci retracement levels may help identify potential reversal zones, but in this analysis, market structure always takes precedence over price ratios.
Research Notes
One observation that has repeatedly caught my attention is the visual similarity between some Leading Diagonals and Triple Zigzags. In several markets, I have seen price confined within converging trendlines, initially appearing to be a textbook Leading Diagonal. However, as the structure matured, it became evident that the market was actually developing a Triple Zigzag.
This occurs because multiple Zigzags can sometimes produce a wedge-like appearance. For that reason, visual pattern recognition alone is never sufficient. The internal wave relationships and the structural rules of the Elliott Wave Principle remain the decisive factors.
Another key element is the relationship between Gold and the U.S. Dollar Index (DXY). Although these markets generally maintain an inverse correlation, historical observations suggest that this relationship is not always constant. There have been periods in which Gold continued building a bullish structure despite a rising Dollar Index. In such situations, one market appears to be correcting through time, while the other progresses toward a price objective.
For this reason, I place greater emphasis on wave structure and price behavior than on traditional intermarket correlations alone.
Unless the market proves otherwise, my preferred expectation remains unchanged: once the Leading Diagonal is complete, Wave B should develop first, followed by Wave C, ultimately completing Wave IV as a classic Zigzag correction.
Price is the outcome; Structure is the cause.
Patterns whisper. I listen.
— Mr.Nobody
Gold Spot / U.S. Dollar
7 days ago
Gold | One More Wave… or Has Wave B Already Begun?
Gold Spot / U.S. Dollar
May 17
Gold 4H: Leading Diagonal or Just the Beginning?
Long 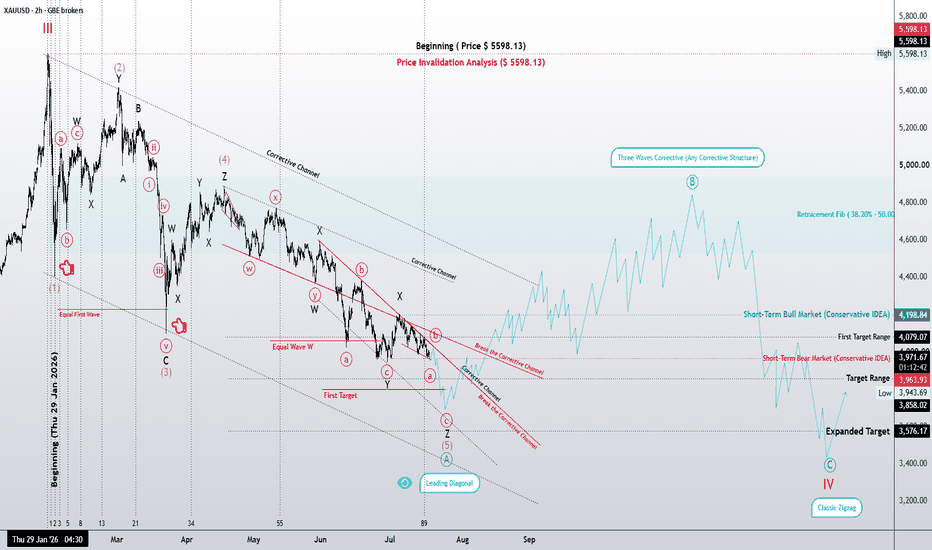
S&P 500 at All-Time High — Is a Major Correction Next?The S&P 500 ( CAPITALCOM:SPX500 ) is currently trading near its All-Time High(ATH=$7,625) and continues to move within a resistance zone($7,625-$7,524).
From a classical technical analysis perspective, the S&P 500 appears to be forming a Rising Wedge pattern, which is generally considered a potential reversal pattern.
From an Elliott Wave perspective, it also appears that the S&P 500 has completed Wave C, resulting in a Zigzag corrective(ABC/5-3-5).
Also, we can see negative Regular Divergence(RD-) between consecutive peaks.
Additionally, on the 4-hour timeframe, with about one hour remaining before the candle closes, a Shooting Star pattern appears to be forming, which could be another signal of a potential reversal in the S&P 500 Index.
I expect the S&P 500 to decline, with an initial target of around $7,515. If this key support level is broken, we could see a much deeper correction in the index.
First Target: $7,515
Second Target: $7,476
Stop Loss(SL): $7,626
Note: If the S&P 500 begins to decline with strong bearish momentum, it could have a rapid and direct impact on the cryptocurrency market, especially Bitcoin ( BINANCE:BTCUSDT ).
What do you think? Is the S&P 500 likely to make new all-time highs, or should we expect a broader correction in the U.S. stock market, particularly in the S&P 500?
💡 Please respect each other's opinions and express agreement or disagreement politely.
📌 S&P 500 Index Analyze (SPX500USD), 4-hour time frame.
🛑 Always set a Stop Loss(SL) for every position you open.
✅ This is just my idea; I’d love to see your thoughts too!
🔥 If you find it helpful, please BOOST this post and share it with your friends.
Short 
EURGBP Update: Remains Under Bearish Pressure Within An ImpulseEURGBP is moving nicely lower as anticipated back in May and June, continuing the expected decline after completing the previous corrective structure. The pair is now developing the final wave E, which can take some time to complete, as wave E is expected to unfold in a three-wave (A)(B)(C) structure.
Following the completion of the wave (B) bearish triangle pattern, EURGBP has started a strong decline within the projected wave (C) of E. The current downside structure suggests there is still room for further weakness, with the 0.8400–0.8300 area becoming an important potential target zone. This move could unfold through a lower-degree five-wave bearish impulse, completing the final stages of the larger corrective pattern.
On the 4H chart, EURGBP continues to extend lower as expected on July 1st, but currently it can be making a higher degree abc correction in wave 4, which could retrace the price back toward the ideal 38,2% Fibonacci retracement and 0.8545 resistance area before the next leg lower begins within wave 5.
As long as the broader bearish structure remains intact, any recovery should be viewed as corrective rather than a trend reversal.
XAUUSD: Wave 5 Downside Still Has Room to ExtendGold is still trading under bearish pressure after breaking below the short-term structure. From Kelly’s view, the current recovery looks more like a corrective bounce inside a bearish Elliott sequence, not a confirmed reversal yet.
The key idea is simple: gold may retest resistance first, but as long as price stays below the sell zone, the wave 5 downside scenario remains active.
⟡ Market structure
The chart shows gold broke down from the previous support area and pushed into the lower Fibonacci extension zone. Price has reacted from the 3,975 buy scalping area, but the rebound remains limited while gold trades below the 4,027 sell zone.
The current price is around 3,997, showing a small recovery after the breakdown. However, this recovery is still under resistance. If sellers defend the 4,020–4,027 area, gold may continue lower towards the 3,943 support zone, where the chart marks the possible end of wave 5.
The higher OB sell zone around 4,062 remains the key area where the bearish structure would be seriously tested.
➤ Key levels
◌ 3,975: buy scalping reaction zone
◌ 3,997: current price reaction area
◌ 4,020–4,027: sell zone and wave 4 resistance
◌ 4,062: OB sell zone and major resistance
◌ 3,943: support / Fibonacci 1.618 / possible wave 5 end
◌ Above 4,062: area where the bearish setup weakens
⌁ Elliott Wave view
From an Elliott Wave perspective, gold appears to be forming a bearish 5-wave structure after the breakdown.
Wave 1 started the first bearish move from the upper area.
Wave 2 corrected back into resistance but failed to continue higher.
Wave 3 pushed price sharply lower through support.
Wave 4 may now be forming as a short corrective rebound.
If the 4,020–4,027 sell zone holds, wave 5 may continue towards 3,943.
This is why Kelly would not chase buy too early. The current bounce is still below resistance, and the larger short-term structure remains bearish.
▸ Trading scenario
Preferred scenario: wait for price to retest the 4,020–4,027 sell zone and show bearish confirmation.
Sell zone: 4,020–4,027 if rejection appears
Stop loss: above the confirmed rejection high or above 4,062
Take profit 1: 3,975
Take profit 2: 3,960
Take profit 3: 3,943
Alternative scenario: if gold breaks above 4,027 and continues above 4,062 with strong acceptance, the bearish wave 5 setup weakens. In that case, the market may move into a larger corrective recovery before the next structure becomes clear.
⌁ Kelly’s view
For Kelly, this is still a bearish intraday setup. Gold has reacted from the lower zone, but price has not reclaimed the sell zone yet.
The cleaner plan is to wait for the retest. If sellers defend resistance, wave 5 may continue towards the Fibonacci support below.
Gold is trying to bounce.
But below 4,020–4,027, the downside structure still has priority.
Share your view below. Short 
Don't Short Crude Oil Yet. One More Rally Could Come First. The next move in crude oil could catch many traders on the wrong side of the market. Instead of breaking down immediately, the chart suggests there may be one last bullish push before sellers regain control.
Previous Outlook Played Out as Expected
Before discussing the current setup, let's briefly revisit the previous outlook.
On the 4-hour timeframe, crude oil was expected to complete a larger corrective structure that would eventually drive price toward the $68–70 support region. The analysis was based on an Elliott Wave count that anticipated the completion of Wave (C), with additional confluence coming from an unfilled gap located within the same area.
As price continued to decline throughout June, the market respected the projected wave structure and eventually reached the highlighted support zone. The gap was successfully filled, and buying pressure quickly emerged, marking what appears to be the completion of the corrective cycle.
With that larger bearish objective now achieved, the market structure has shifted from looking for downside continuation to identifying the next impulsive advance.
--
With the previous bearish target completed, the focus now shifts to the current price structure on the 1-hour timeframe, where crude oil appears to be developing another Elliott Wave sequence.
--
Current Outlook: One More Rally Before a Larger Correction?
Following the strong rebound from the early July lows, crude oil appears to have completed Wave (3) and is currently consolidating in what may be a Wave (4) triangle. Rather than signaling immediate weakness, this consolidation could simply represent a pause before one final push higher.
If the current wave count remains valid, price may rally toward the $84–85 zone, where Fibonacci projections and an unfilled gap converge. This area could become an attractive region for Wave (5) to terminate before a larger corrective decline unfolds.
Alternative Scenario
While the primary outlook continues to favor the completion of a Wave (4) consolidation before one final rally, traders should also remain aware of an alternative scenario. If crude oil fails to hold the current support region and breaks below the Wave (4) invalidation level, the market could instead complete a deeper ABC correction first. Such a pullback would likely target the 38.2%–50.0% Fibonacci retracement zone before buyers attempt another impulsive advance toward the projected Wave (5) objective.
 Long
Long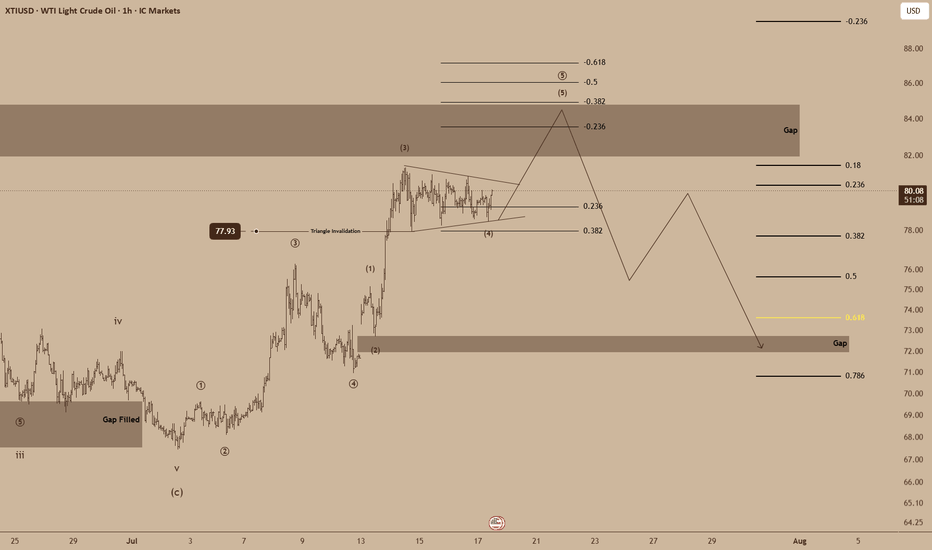
 Long
Long