TradingView screeners walkthrough
Screeners are financial analysis tools that help you identify opportunities across multiple assets within a single domain. Each screener is tailored to a specific asset type, as different markets require distinct analytical approaches. Since all screeners share similar core functionality, we will review them together using the Stock Screener as an example.
CONTENTS:
- What are TradingView screeners?
- How to access screeners
- How to configure screeners
- Screeners and other TradingView tools
What are TradingView screeners?
Screeners serve various purposes—from a broad market overview to a highly focused analysis. Simply put, they are filters designed to help you discover assets that match your exact criteria. The results of your screens can be displayed as data-rich tables or visual charts. You can always add extra filters, create new columns, and reconfigure the tool to match your analytical approach.
All TradingView tools integrate seamlessly, meaning that mastering screeners will significantly enhance your overall financial analysis capabilities. They function as both fundamental and technical analysis tools, helping you find undervalued stocks, reliable ETFs, solid bonds, and promising cryptocurrencies.
Unlike our standard tools, the Pine Screener allows you to scan assets using custom indicators built with our proprietary Pine Script® programming language, in addition to widely used traditional indicators.
Whether you are experienced or just getting started, screeners are straightforward tools built to help you make sense of current market conditions. All screeners function similarly, with only minor variations in available filters based on the specific asset type.
Note: All the following Stock Screener settings apply to the other screeners, with the exception of the Pine Screener.
How to access screeners
A single workflow takes you to any of the following screeners on TradingView: Stock, ETF, Bond, Crypto Coins, CEX, or DEX Screener.
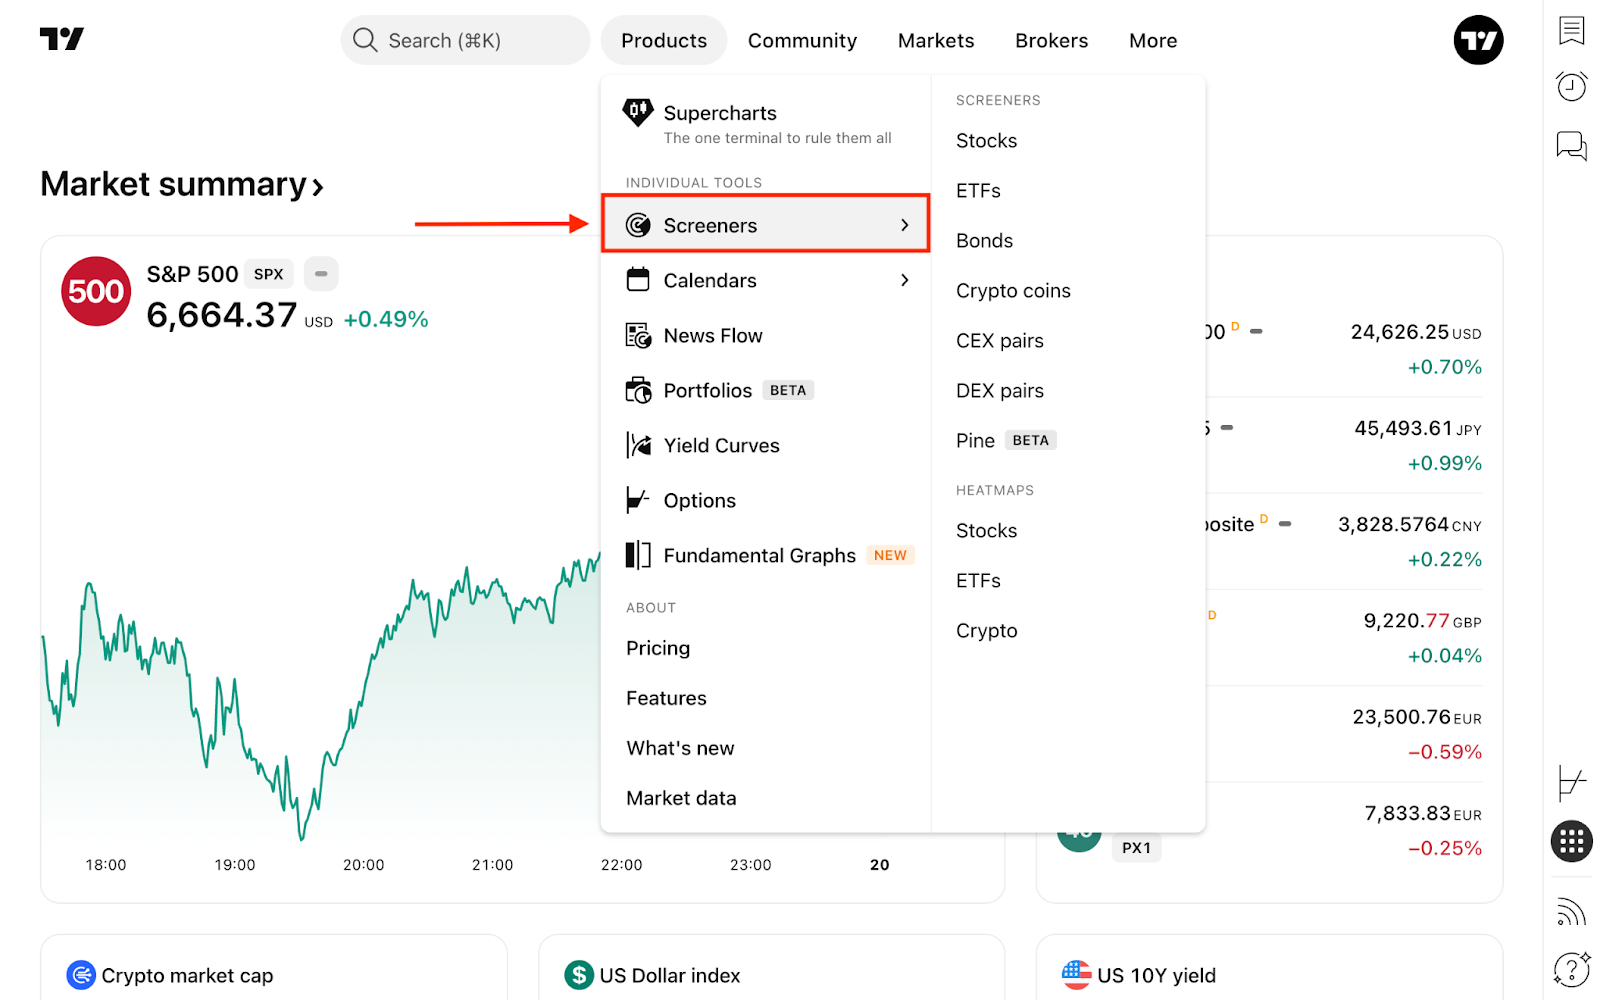
From any page, open the Products dropdown in the top navigation menu, select Screeners, and choose the specific one you need.
Alternatively, you can open screeners directly from the right-hand toolbar. They are easily accessible from any page, whether you are analyzing Supercharts or exploring community trade ideas.
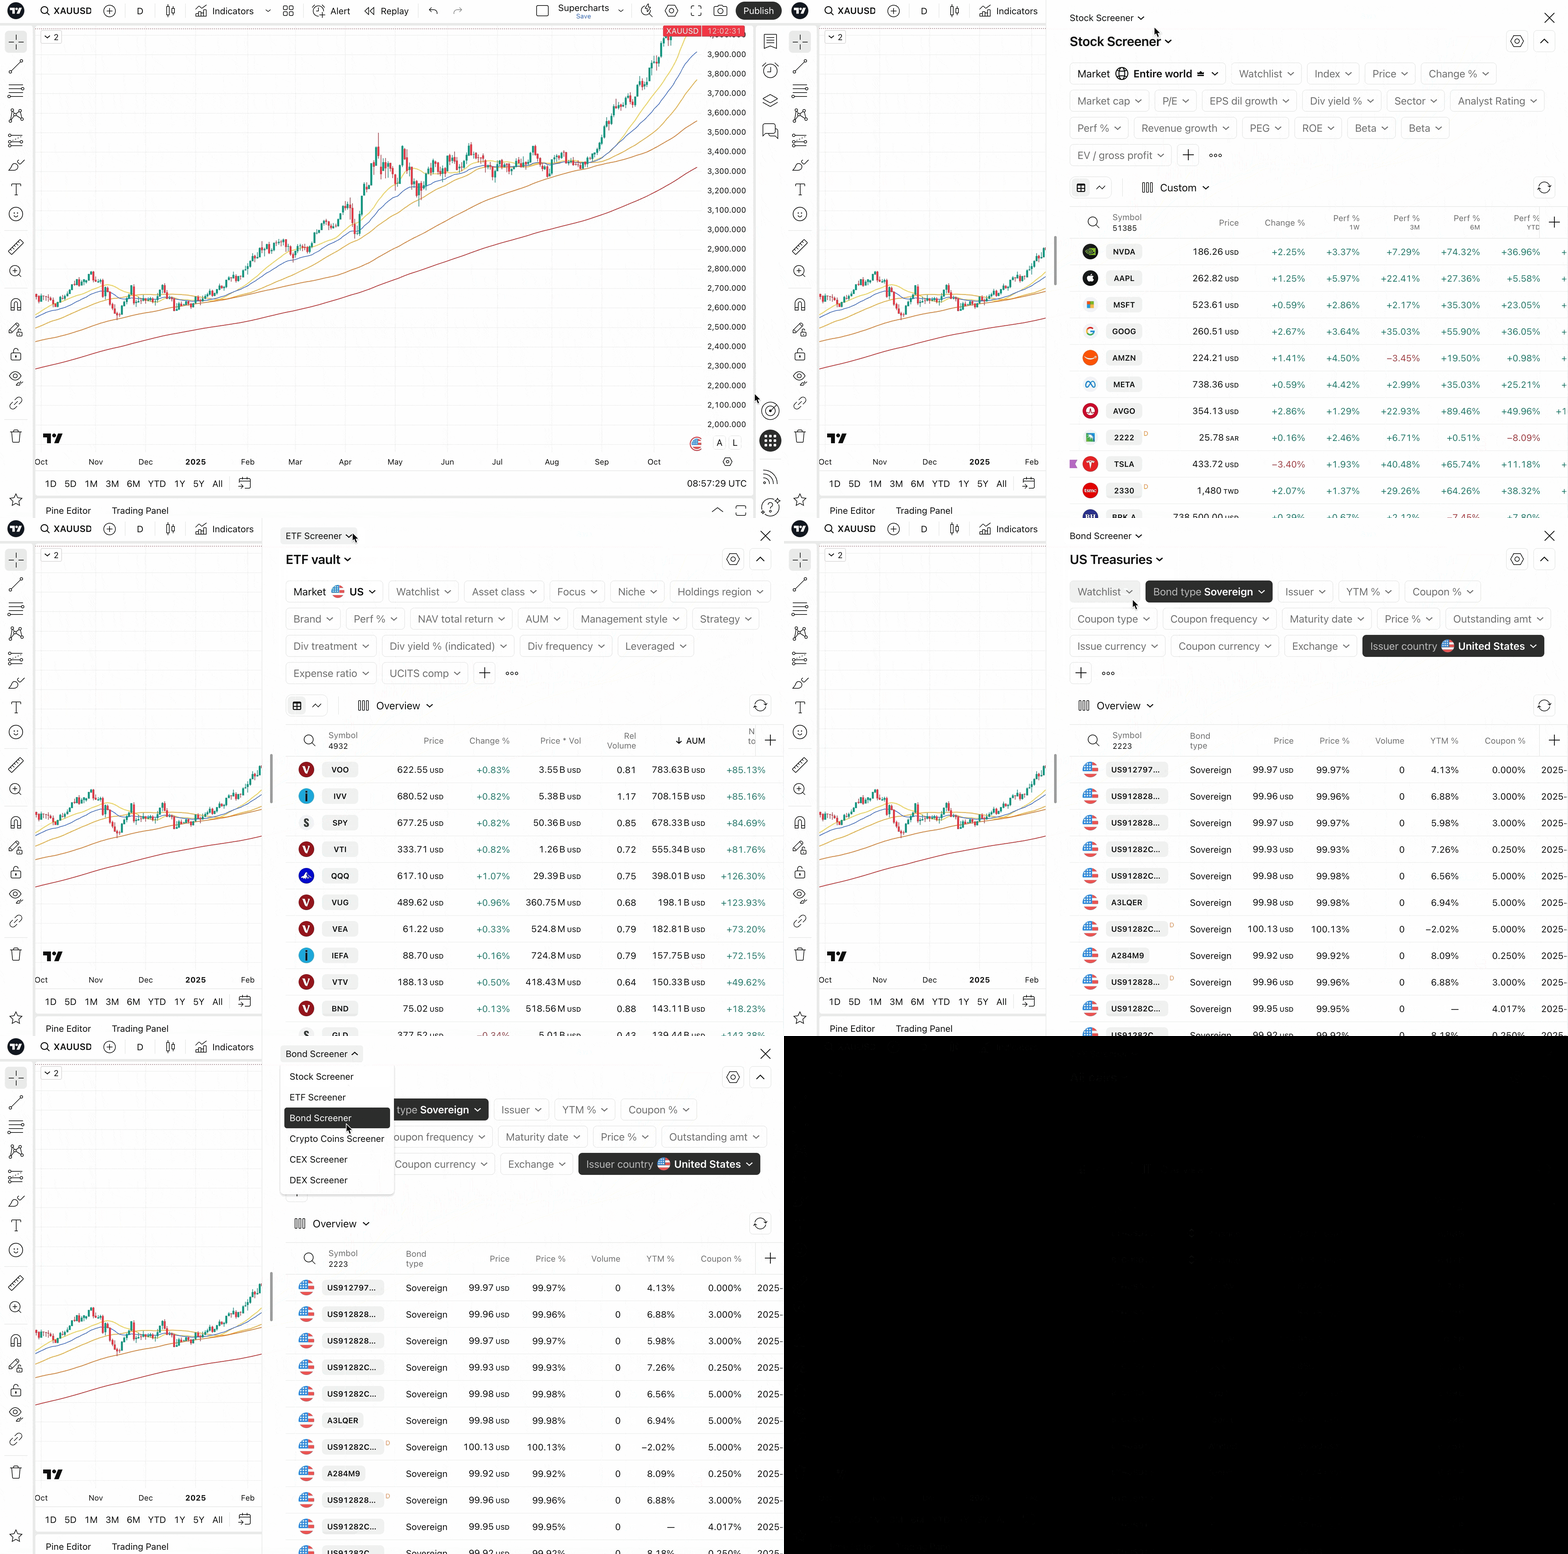
Both options take you to a fully functional screener — simply choose your preferred asset class, apply your filters, and select the assets that interest you the most.
How to configure screeners
Every screener consists of five main components that you can use to customize your analysis:
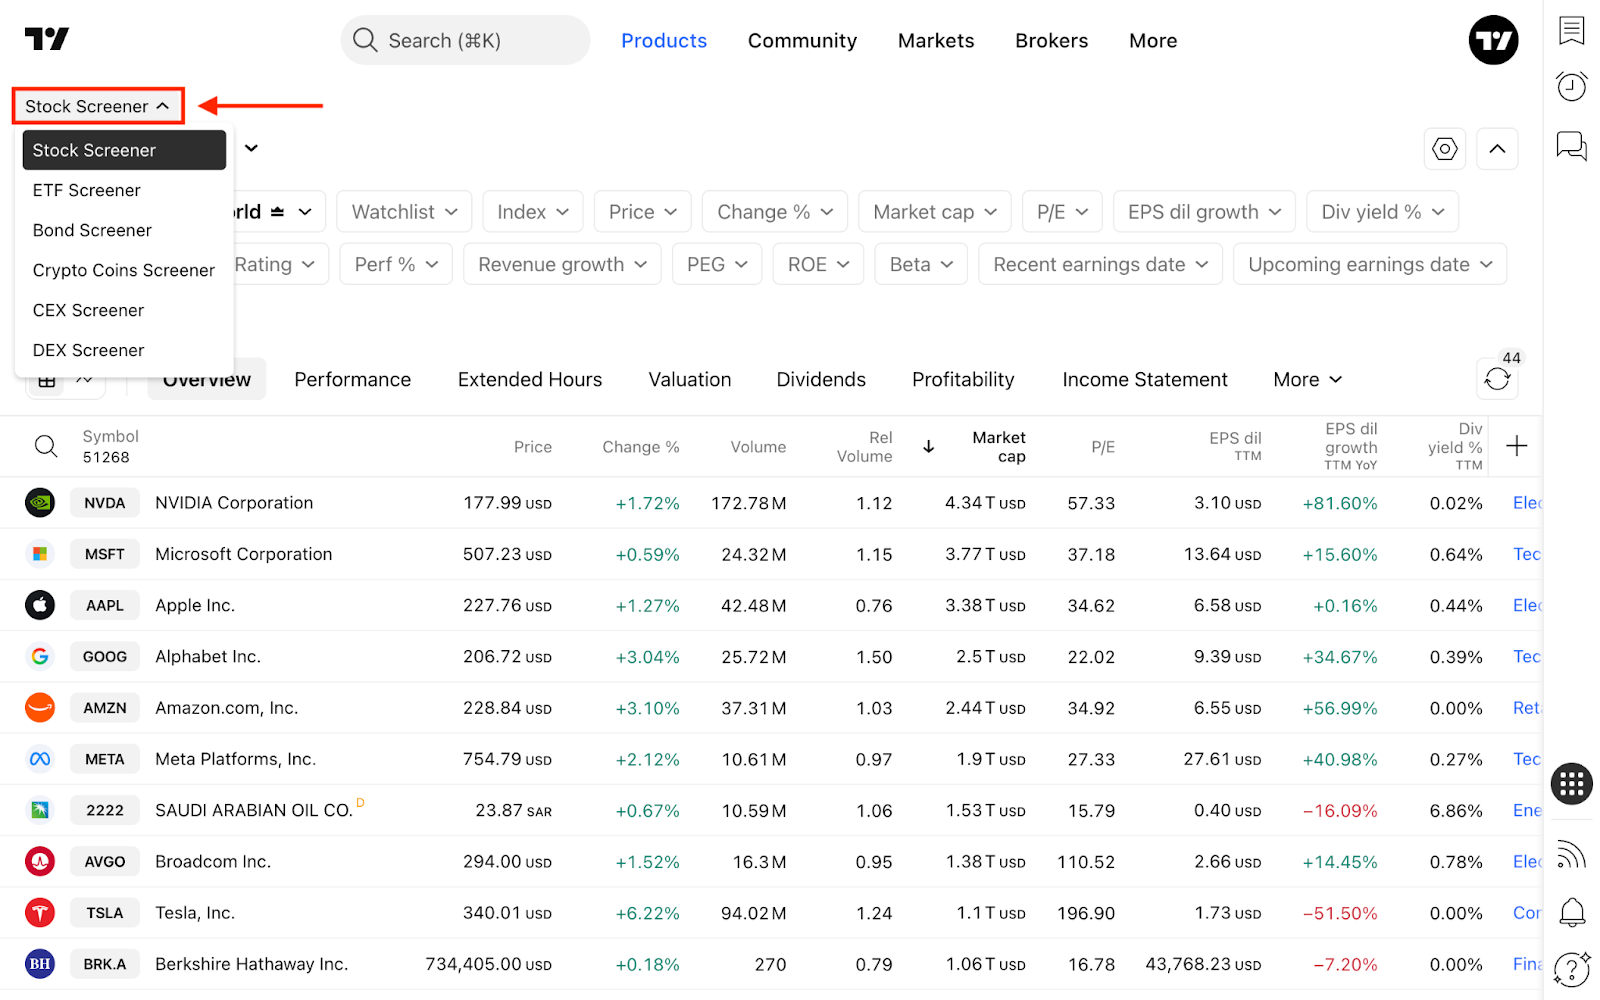
1. Screener switch menu
Located in the top-left corner, this menu allows you to instantly switch to a different asset screener for your analysis.
2. Screens menu
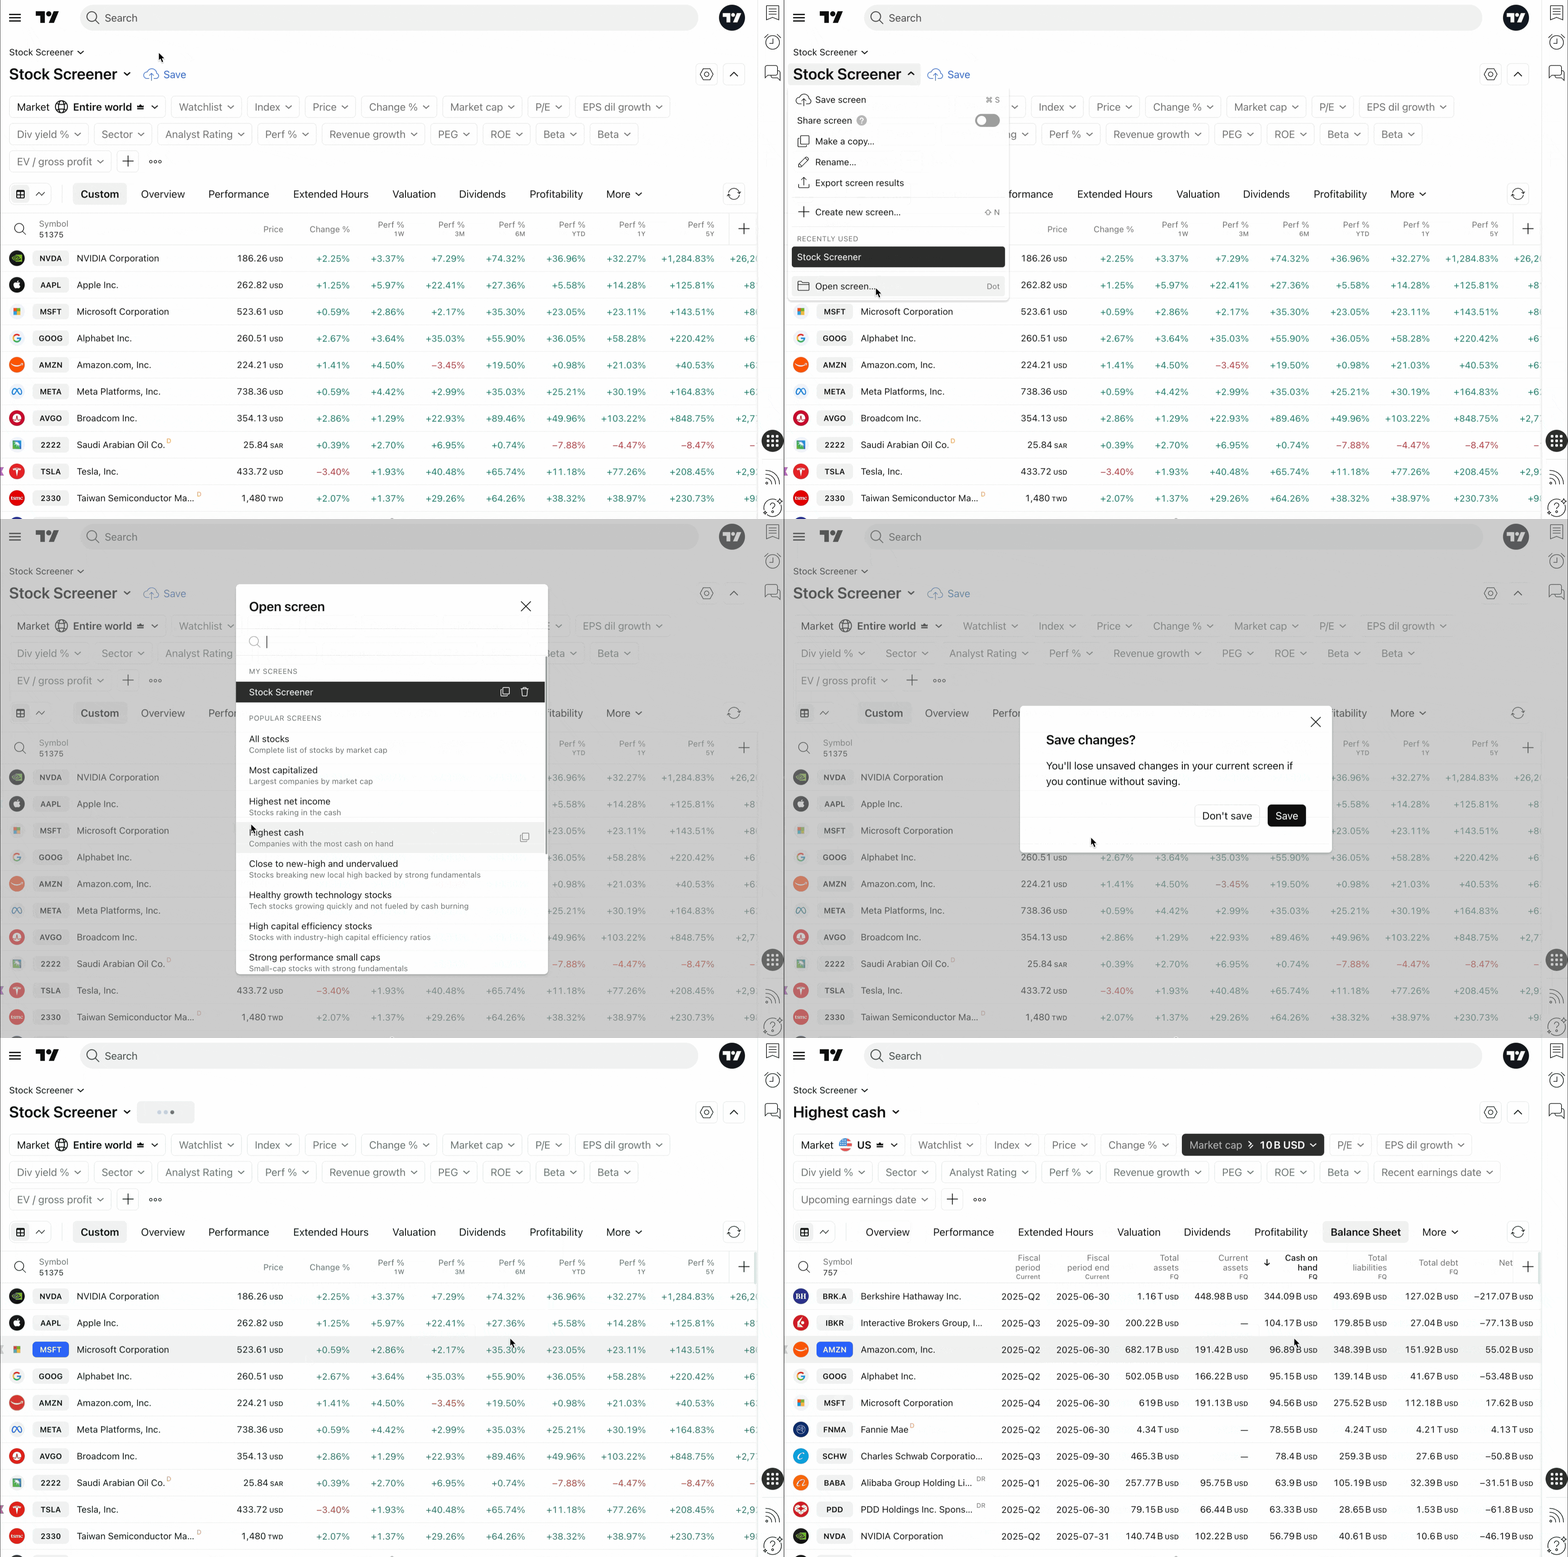
Clicking on a screener or template name opens a dropdown menu with the following options:
- Save screen: Save and manage your custom templates.
- Make a copy: Create a duplicate of your current screen.
- Rename: Change the name of your active screen.
- Export screen results: Download your filtered data as a CSV file.
- Create new screen: Open a fresh template to start a new analysis.
- Recently used: View your five most recently accessed screens.
- Open screen: Load your saved templates or explore popular preset screens tailored to related asset groups.
3. Top filter panel
From this panel, you can refine your search criteria:
- Apply a popular screen: Get a quick market overview based on predefined statistics.
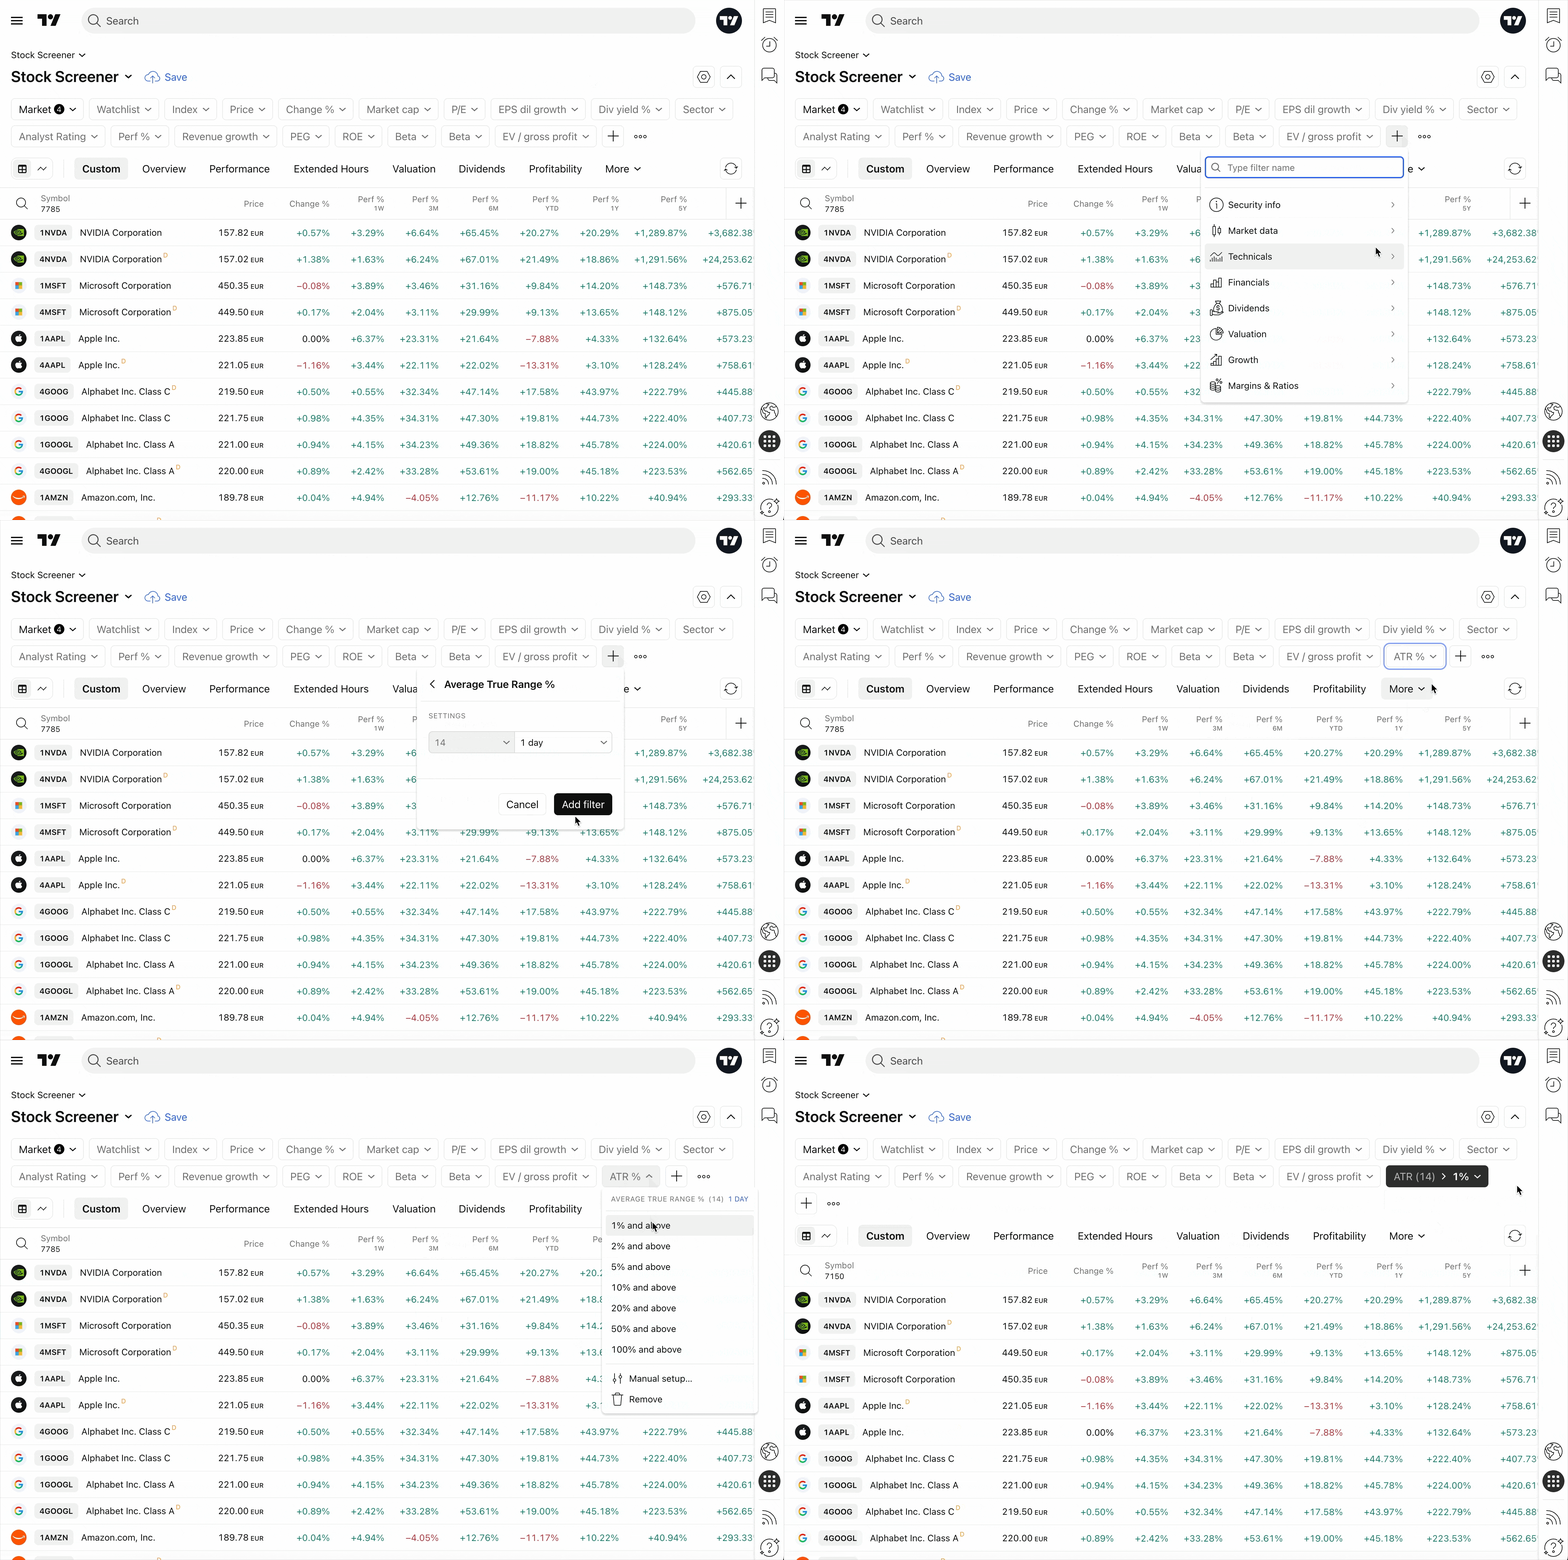
- Add a filter: Choose from various categories, including security info, market data, and technicals.
- Add a filtering condition: Define exact parameters to start scanning symbols.
- Edit filter: Adjust values for classic trading signals, or click "Manual setup" to create custom thresholds.
- Reset / Remove filter: Clear active parameters or simplify your criteria when you need less strict filtering.
Note: You can hide the filter panel by clicking the arrow in the upper-right corner to maximize your workspace. The left side of the panel displays the current market region (this specific regional feature is available for the Stock and ETF Screeners only).
On the left side, you can see the current market showing assets for this region. This feature is available for the Stock Screener and the ETF Screener only.
4. Table
Below the filter panel, the screener compiles matching assets and presents their key statistics. You can customize this table to show only the data you need.
You can apply a ready-made column set to view assets from a specific perspective (such as performance, risk, or coupon), or you can build your own. Add columns by clicking the plus sign, sort the data by clicking a column header, or open the context menu with a right-click to:
- Customize a column.
- Choose the sorting type.
- Move a column left or right.
- Remove a column.
The table's upper-left corner features a chart view toggle. This format displays the data as a grid of charts instead of rows, helping you visually interpret price action. It includes settings to change the chart type, set the timeframe interval, and adjust the grid layout.
5. Settings
The screener settings menu includes several features to help manage your scanned results:
- Table / Chart view settings: Toggle the visibility of symbol descriptions, symbol types, and currencies.
- Auto refresh: Set how frequently the table updates (every 10 seconds, every 1 minute, or never).
- Financials currency: Select your preferred base currency for displaying financial data (available for Stock and ETF Screeners only).
Screeners and other TradingView tools
Screeners act as your entry point to the market, allowing you to filter thousands of assets according to your specific trading strategy. After configuring your filters and generating a curated list of symbols, you can transfer these results directly to your watchlist for deeper analysis using TradingView's full suite of tools.
This includes examining price charts across different timeframes, applying advanced technical indicators, and setting precise price alerts. Additionally, you can access asset-specific news feeds, dive into fundamental financial data, and execute trades directly through integrated brokers when opportunities arise.
The bottom line
TradingView screeners provide powerful filtering and analysis capabilities across multiple asset classes. By blending intuitive basic functions with advanced features like custom filters, column management, and dynamic data presentation, the platform serves both beginners and seasoned professionals.
Offering template saving, data export, and versatile chart/table views, screeners integrate seamlessly with the rest of the platform. They serve as foundational tools for data-driven decision-making and deep financial analysis.
Also read: