Every candlestick pattern, now in the Screener
- Piercing
- Dark cloud cover
- Harami cross
- Tasuki gaps
and more.
Pattern names now match the chart exactly. If the chart calls it Harami – bearish, the Screener calls it Harami – bearish. The same terminology across both tools means a signal you spot in the Screener is the same signal you confirm on the chart.
Strongest signals come first
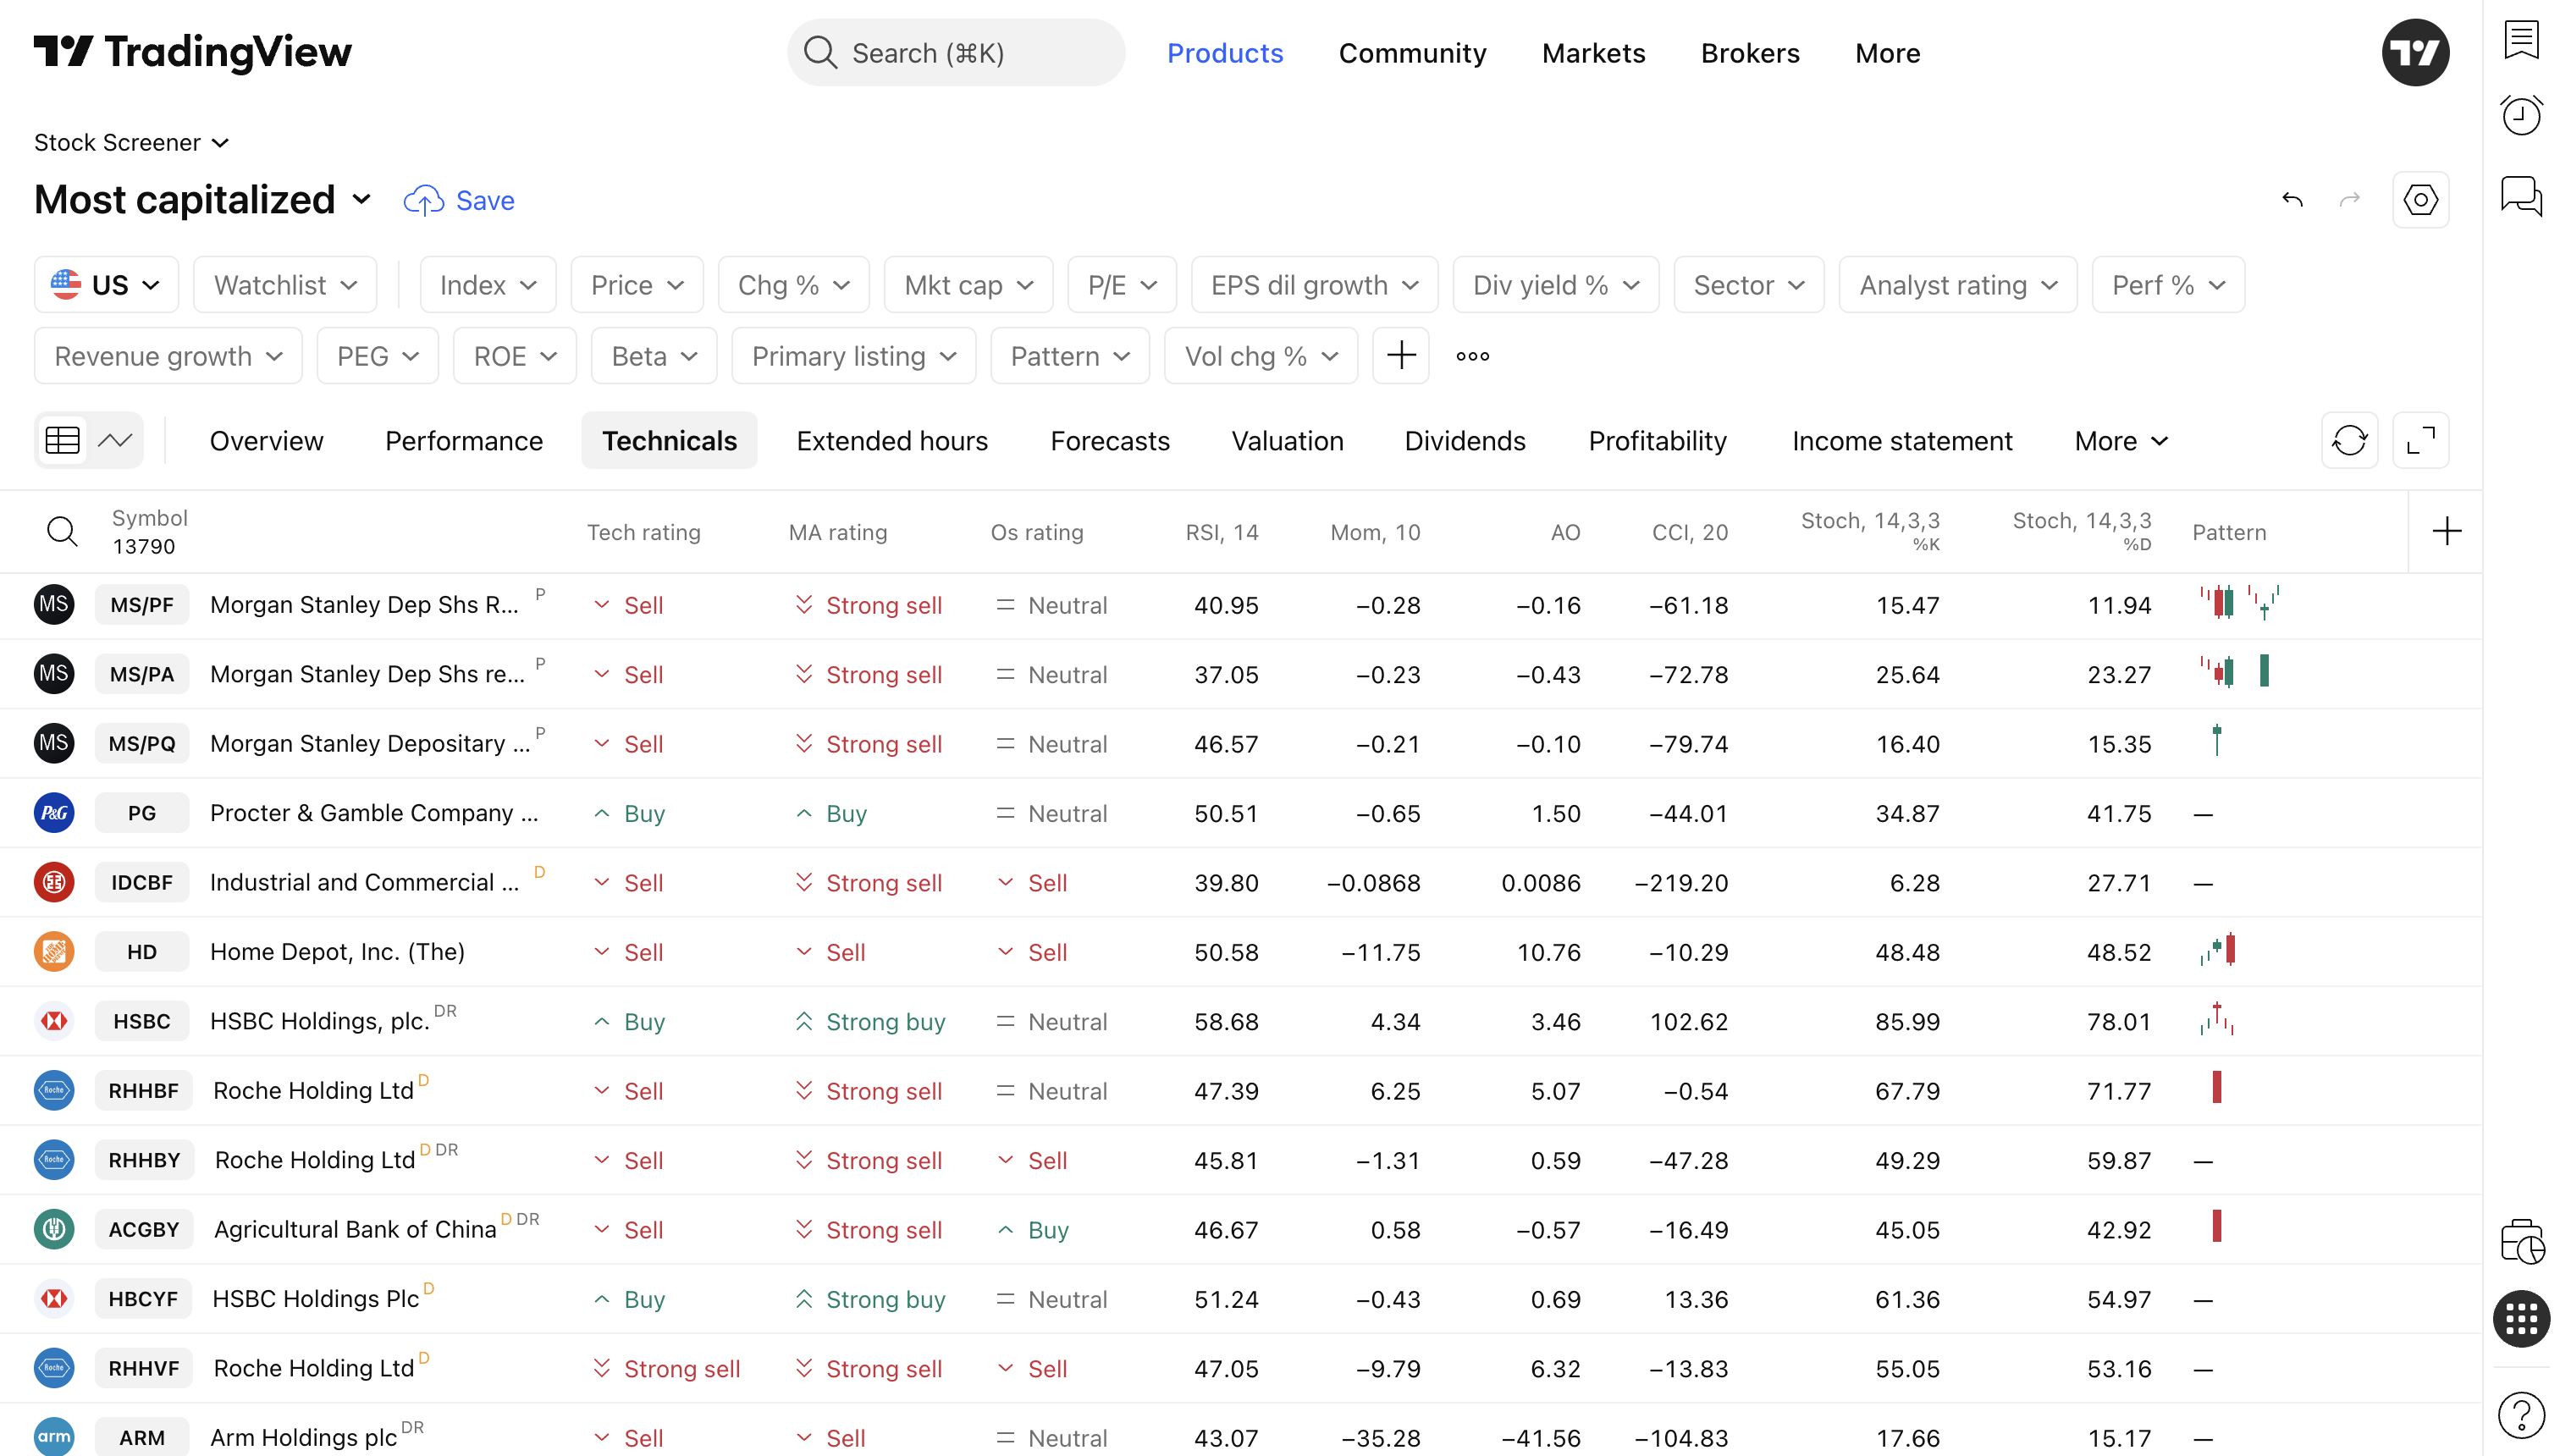
When several patterns fire on the same symbol, the column prioritizes them for you. Icons are ordered by signal strength: strong patterns like engulfing or three white soldiers appear first, while weaker single-candle signals like spinning tops come last. Move your cursor over any icon and a tooltip names the pattern.
The column displays up to four miniatures, with a counter such as “+3” collapsing the rest. Hover over it to see the full list, each with its own miniature
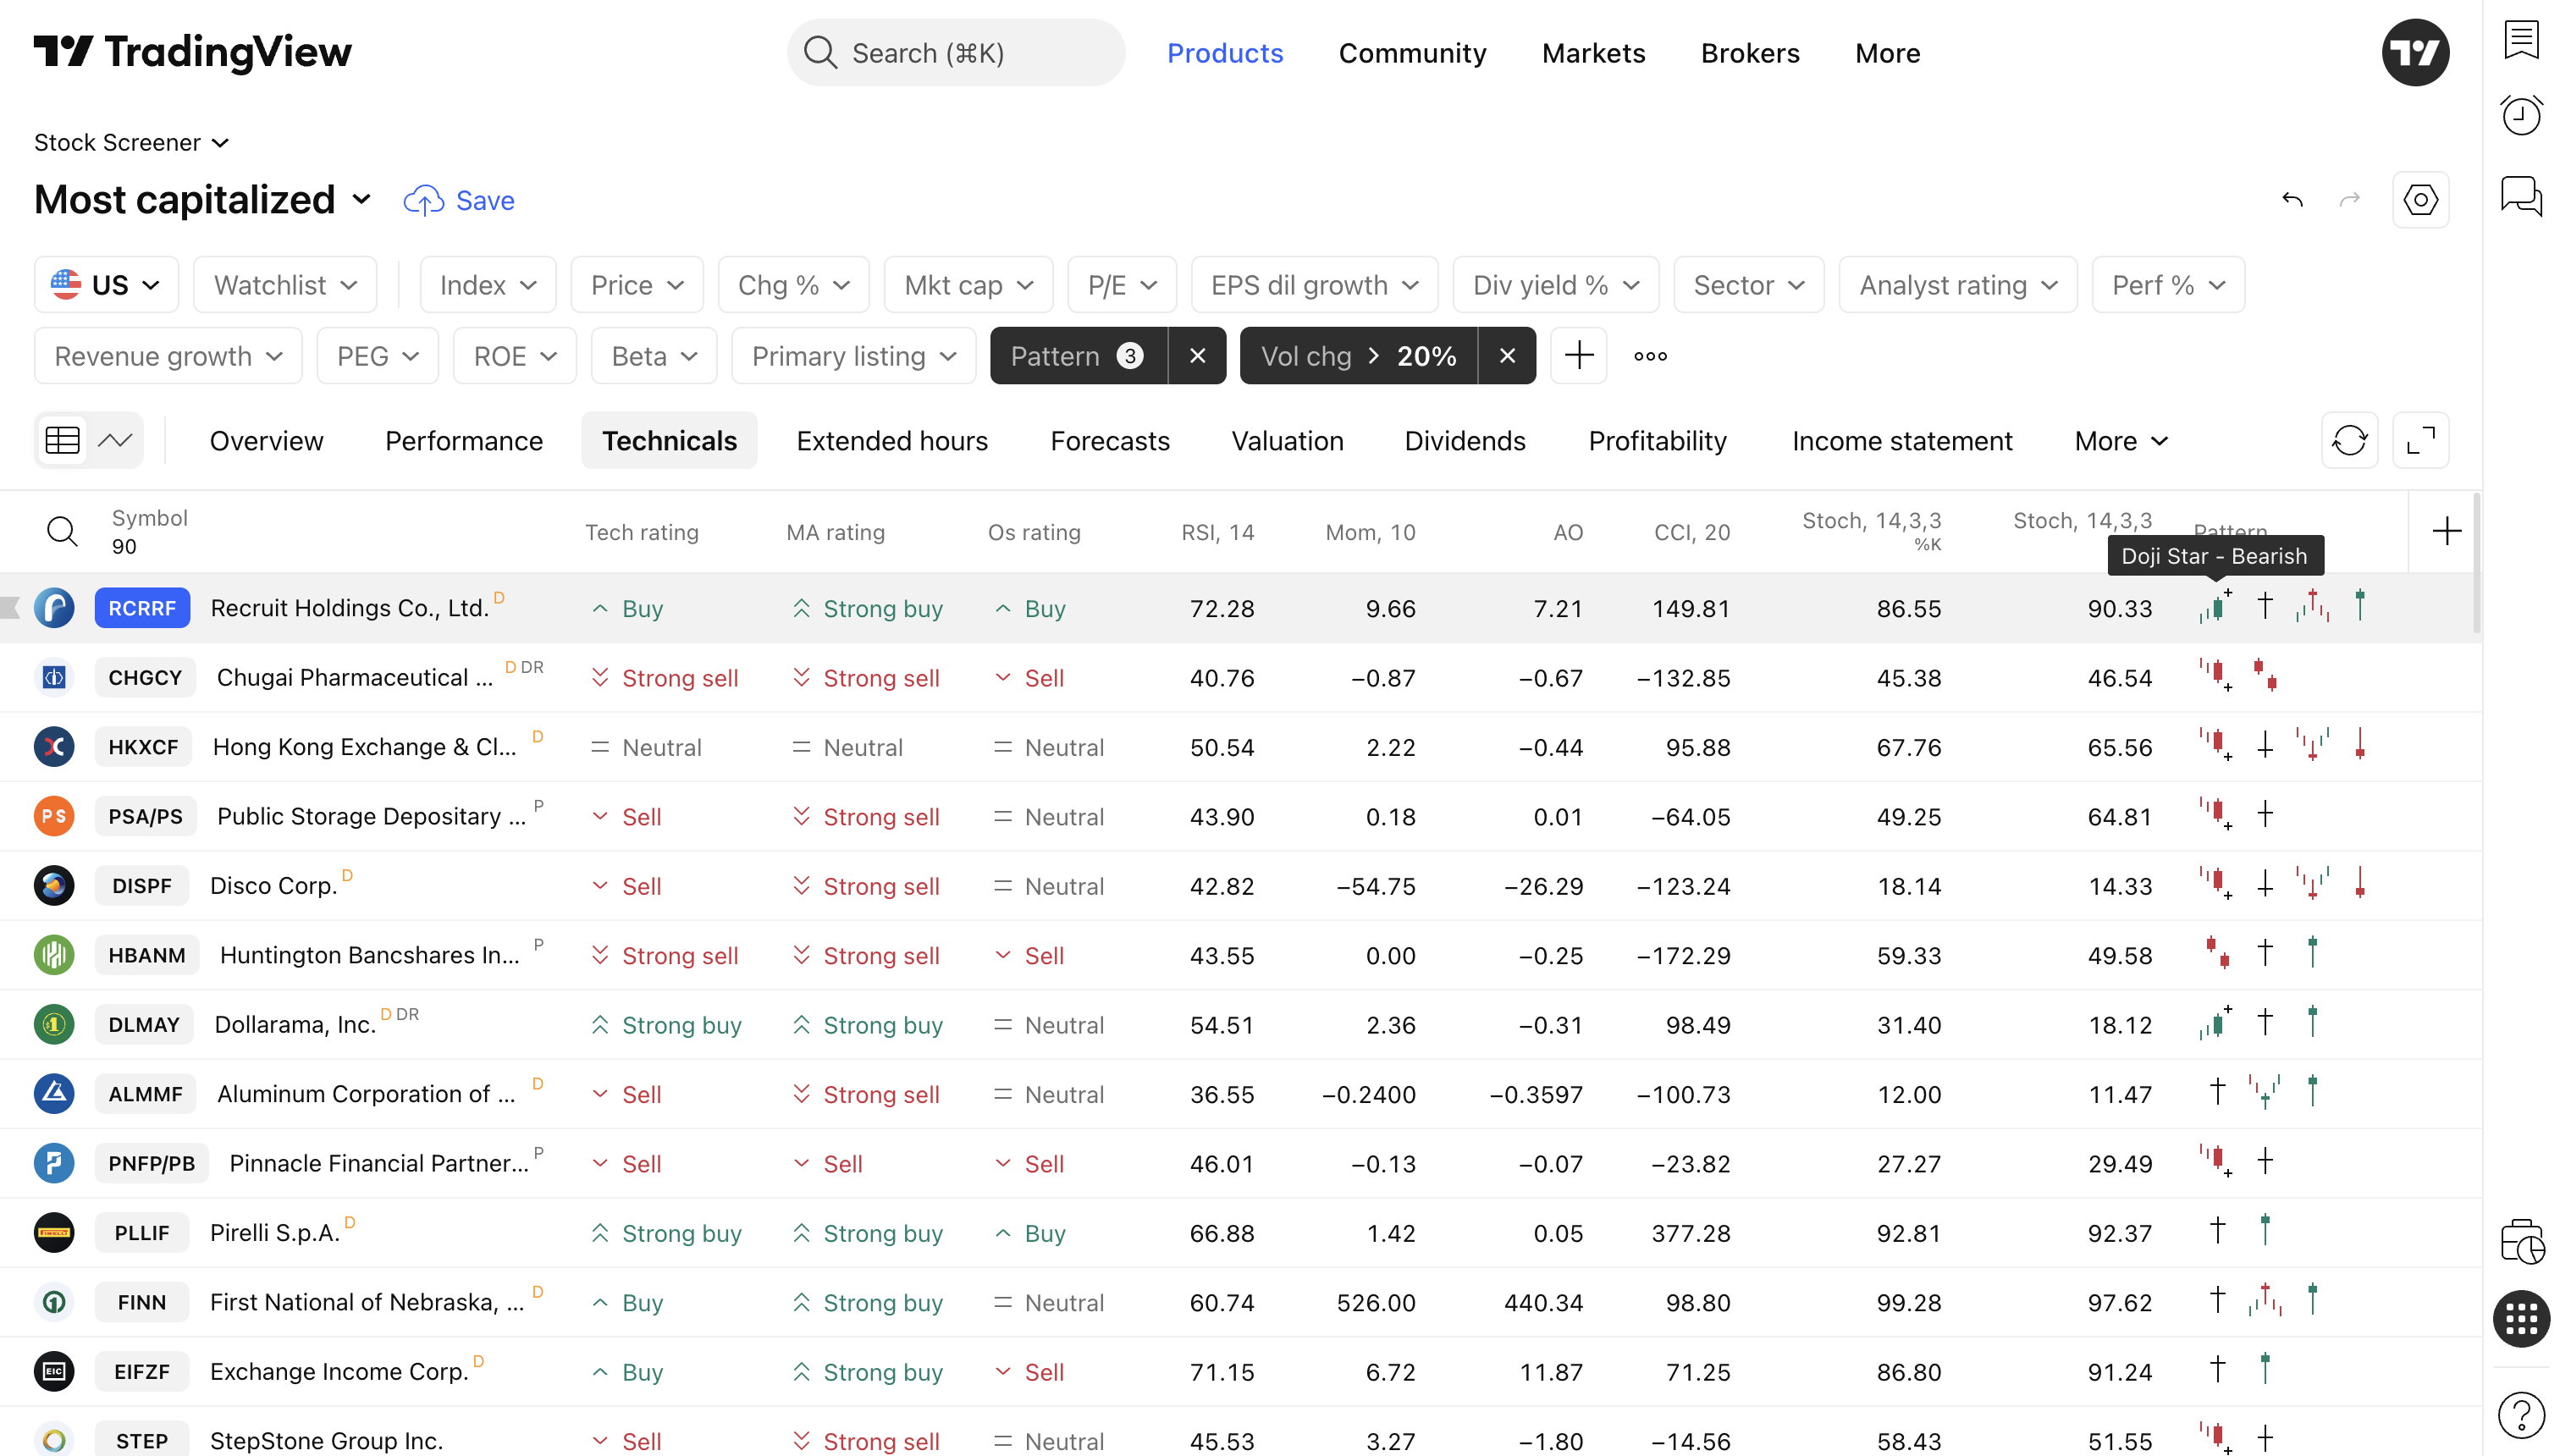
Signal strength reflects TradingView’s internal classification and is meant for comparing patterns within the Screener. Learn more about pattern strength, type, and direction in our Candlestick pattern in Screener article.
Filter by the setups you trade
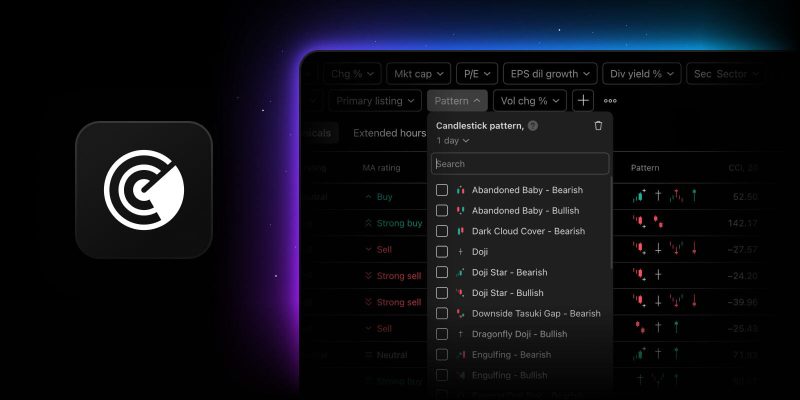
The pattern filter got the same visual treatment. The dropdown lists all 44 patterns alphabetically, each with its miniature. Select one pattern and the filter displays its name and icon; pick several and it switches to a counter, with a hover tooltip listing everything you selected.
You can also set the timeframe for pattern identification in both the filter and the results column, choosing from 1 minute to 1 month. Please note that intraday options require a paid plan. To adjust the interval, click the filter or column header, then select your required timeframe from the dropdown.
Combine the pattern filter with any other Screener field. Bullish reversal patterns on stocks above their 200-day moving average with rising volume – all in a screen you can build in seconds.
Who is this for?
For candlestick traders, this turns the Screener into a primary scanning tool: filter the whole market by the patterns in your playbook instead of flipping through charts one by one.
For those learning technical analysis, the miniatures make the Screener a working reference. You see the shape and the name side by side, on live market data.
If patterns are one input among many for you, the strength-ordered column gives you a fast read on which symbols in your results deserve a closer look on the chart.
Keep in mind
Pattern names are shown in English in all interface languages, so they stay consistent with established terminology and with the chart. Some patterns have been renamed to match the chart terminology. If a saved screen of yours references a pattern by its old name, check that it points where you expect.
Remember that candlestick patterns are not trade signals on their own, they work best combined with other analysis and sensible risk management.
Open the Screener, go to the pattern column, and see what the market printed today. As always, your feedback shapes what we build next.
Team TradingView