A company’s future is rarely captured by a single number. EPS and revenue estimates are useful, but they don’t always show how a business is expected to grow, spend, generate cash, manage debt, or be valued in the future.
That’s why we’ve expanded estimates data on TradingView with a broader set of analyst forecast metrics and made them easier to use across the platform, so that you can analyze companies more efficiently and make better-informed decisions.
A fuller view on symbol pages
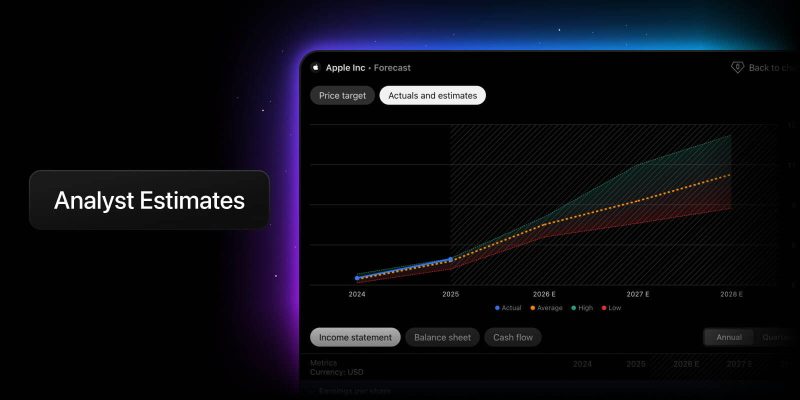
Stock symbol pages now provide a broader set of analyst estimates across the company’s financial model. To view them, navigate to the Forecast section and select the Actuals and estimates tab.
These estimates span key areas of a company’s financials, including profitability, expenses, cash flow, balance sheet items, and per-share metrics. They include:
- EBITDA
- EBIT
- Net income
- Free cash flow
- Operating cash flow
- Capital expenditures
- Total debt
- Total assets
- Cash and short-term investments
- Cash from financing activities
- Cash flow from investing
- Book value per share
- Cost of sales
- SG&A
- R&D expenses
- Gross income
- Dividends per share
Each metric is presented not just as a single value, but as a distribution of analyst estimates. You can see the minimum, maximum, and average values, along with a table showing exact figures and the number of analysts contributing to the estimate. This helps you understand both the consensus and the range of expectations.
We’ve also added forward valuation metrics based on these estimates, including forward price to earnings (P/E), forward price to sales (P/S), forward price to book (P/B), forward enterprise value to EBITDA (EV/EBITDA), forward enterprise value to EBIT (EV/EBIT), and forward enterprise value to sales (EV/Sales). These metrics are available alongside other valuation data in the Statistics section of the Financials tab.
This data will help you put current valuations into context by comparing them with expected future financial performance.
Forecast indicators on Supercharts
Forecast data is now easier to analyze directly on Supercharts. In the indicators dialog, we’ve added a dedicated Forecasts tab to the Fundamentals section, where selected estimate metrics and forward multiples are grouped together.
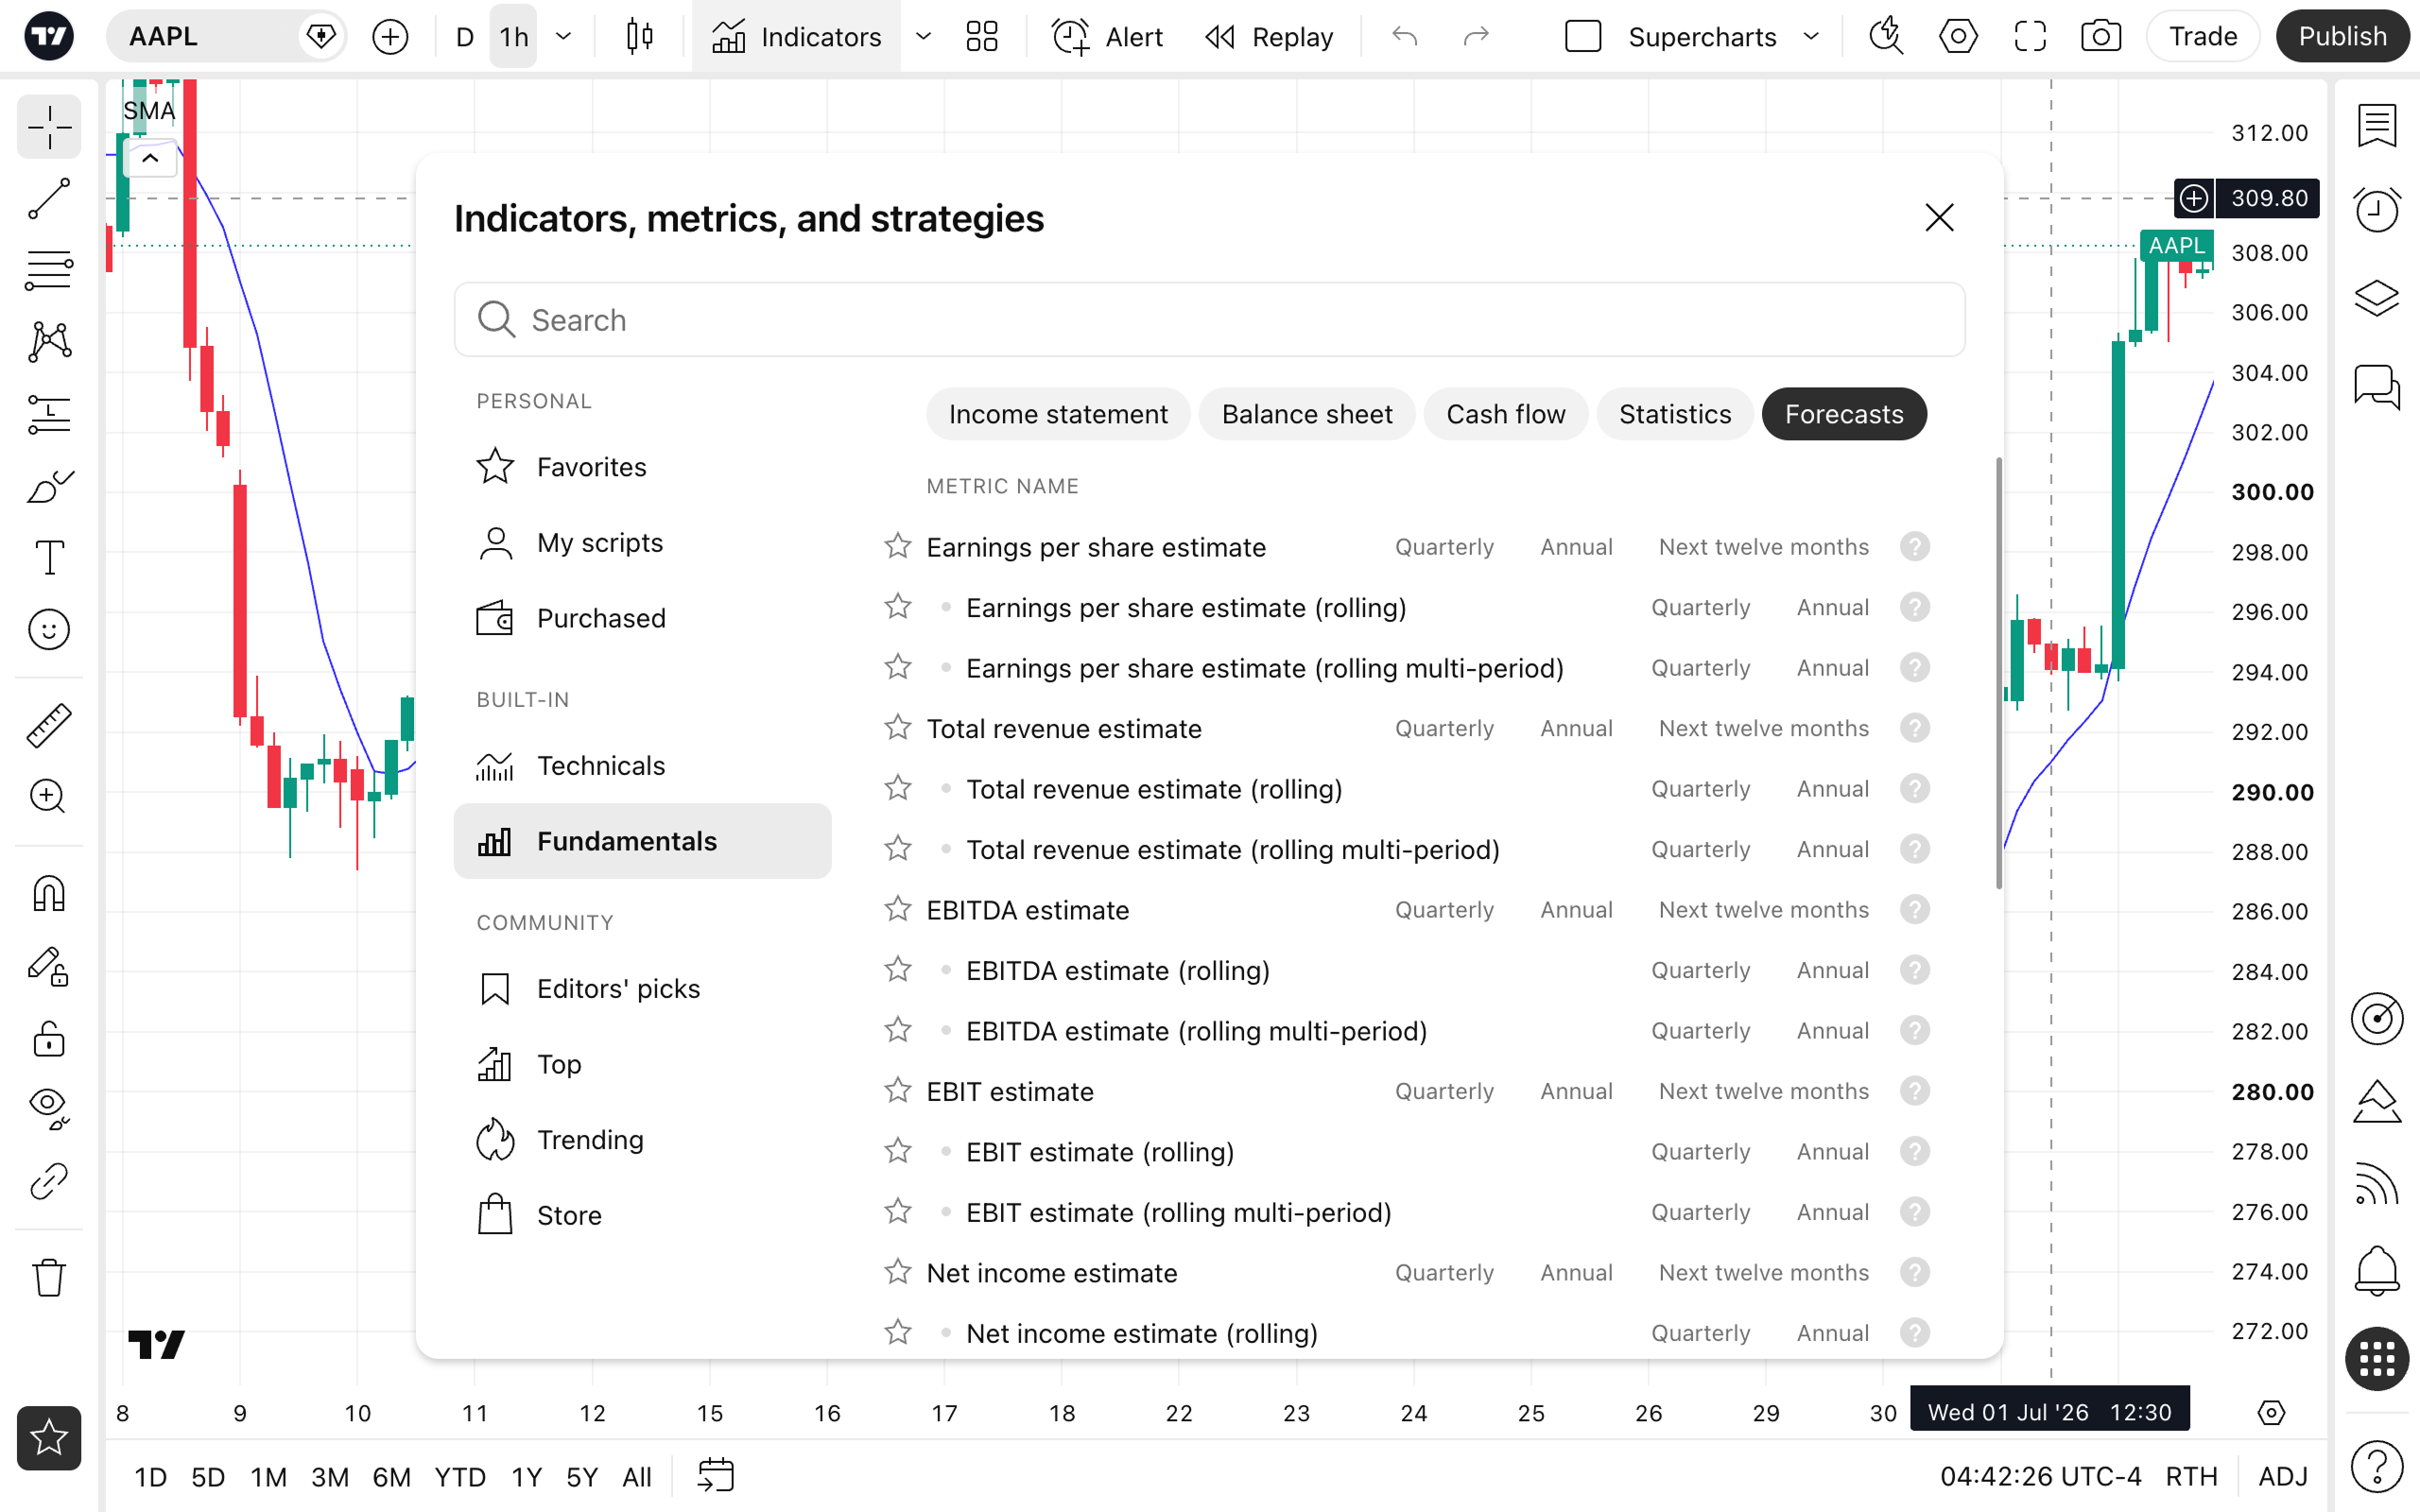
Alongside historical estimates indicators, we’ve added two additional ways to work with forecast data:
- Rolling estimates: They show how the current forecast for a specific future period evolves over time. For example, you can track how analysts revise expected next-year EBITDA in response to new developments
- Rolling multi-period estimates: These let you compare expectations across several future periods at once — such as the next four quarters or fiscal years. This helps you see whether expectations are improving only in the near term or across a longer horizon
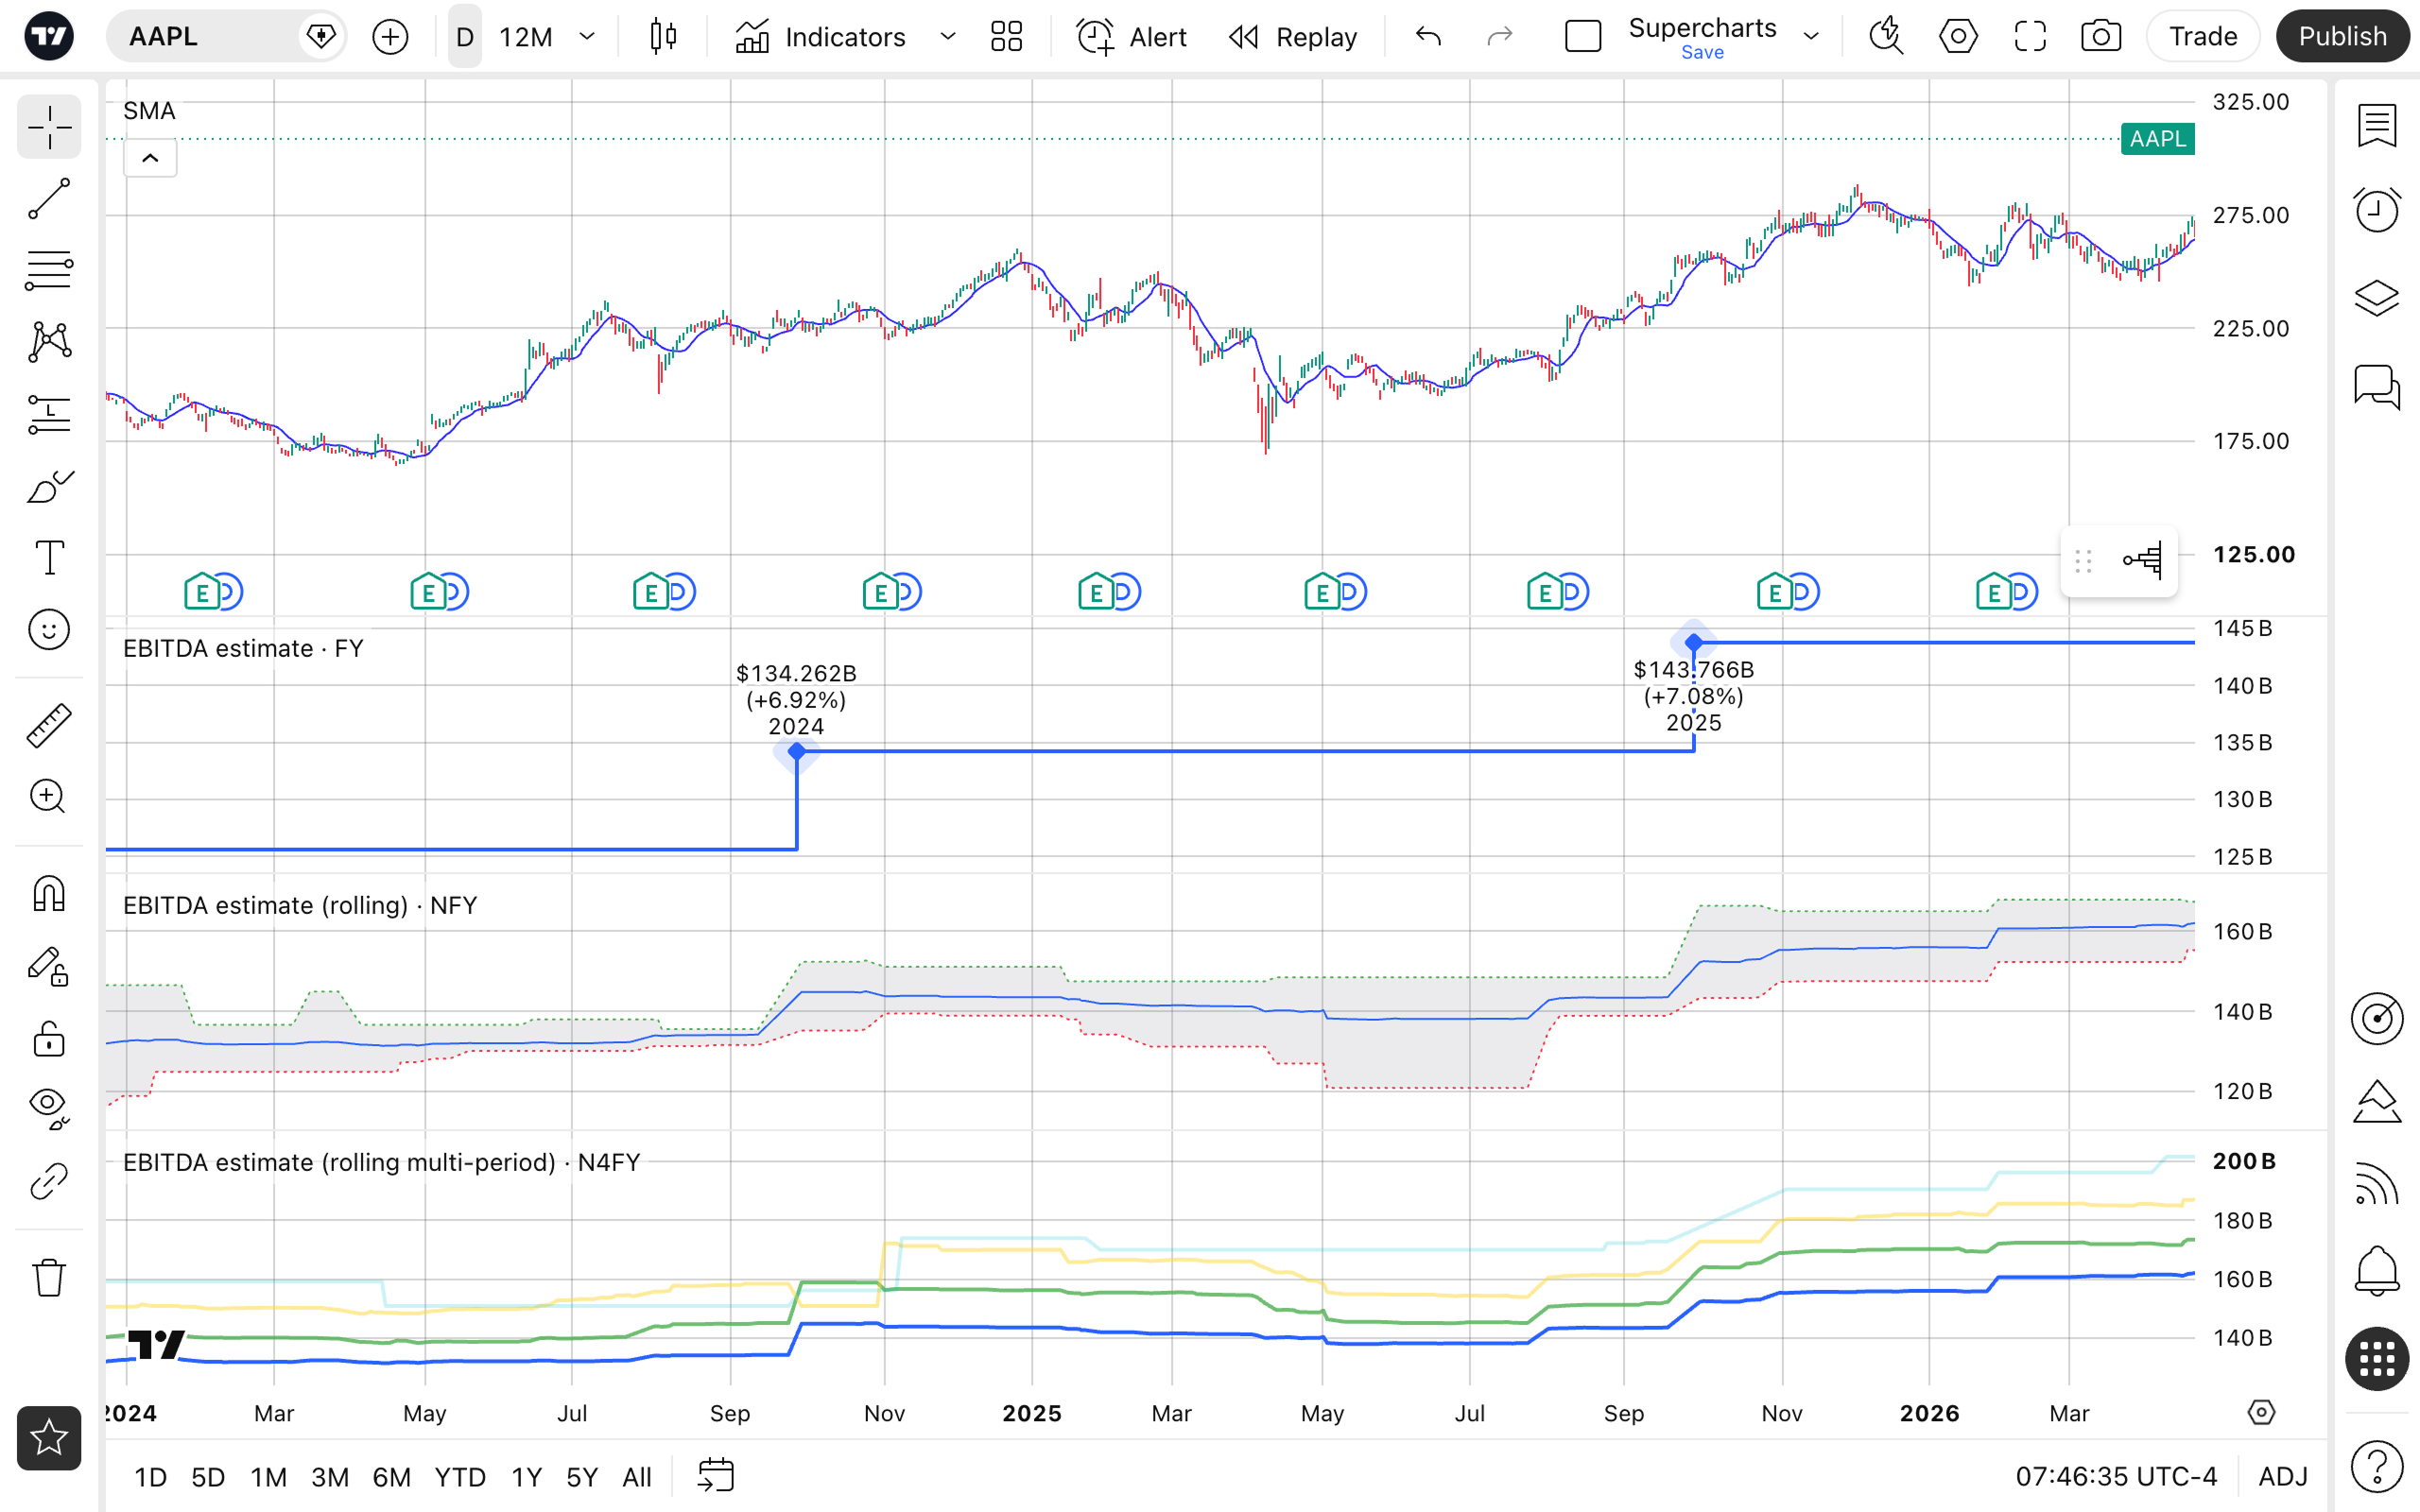
Together, these indicators make it easier to analyze not only the forecast itself, but also how expectations develop over time.
A new Forecasts tab in the Stock Screener
Estimates become especially useful when you can compare them across companies. That’s why we’ve added a dedicated Forecasts tab to the Stock Screener, bringing key forecast metrics together in one place.
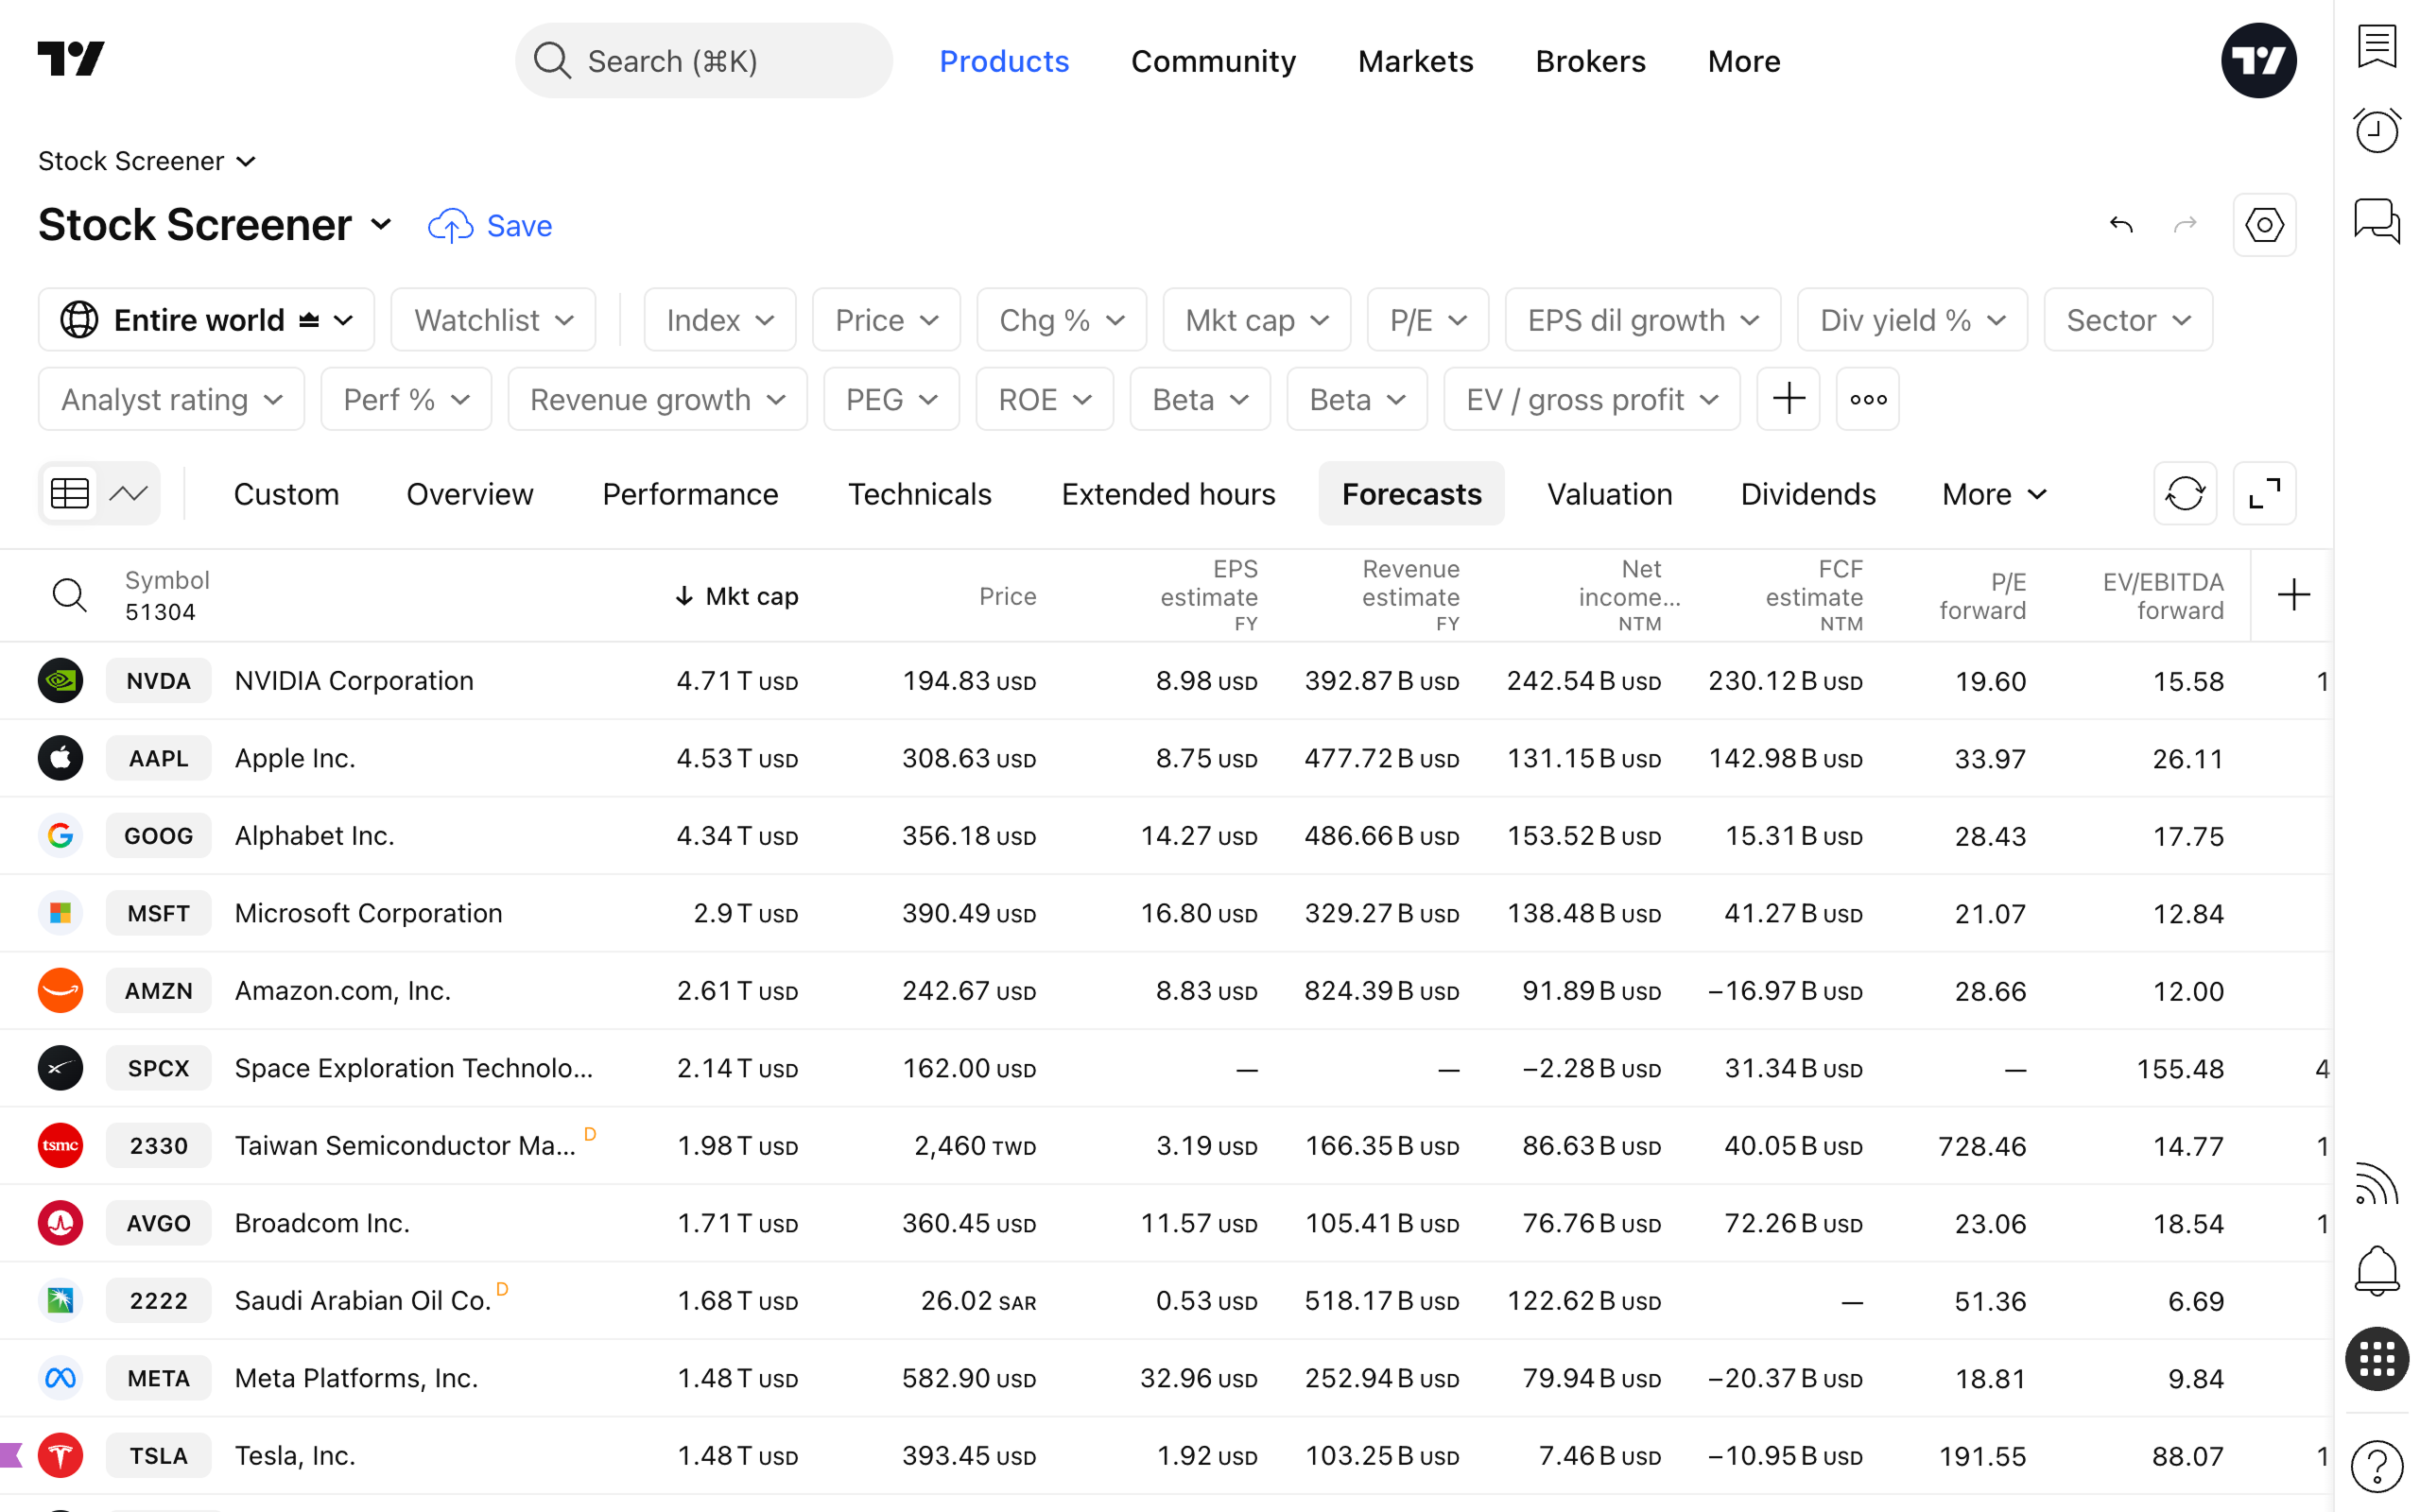
You can use these metrics as columns, filters, and sorting criteria to compare companies by expected profitability, cash flow, debt, expenses, and forward valuation.
For example, you can identify companies with improving EBITDA expectations, compare forward EV/EBITDA across peers, filter by expected free cash flow, or find businesses where analyst expectations are shifting.
Where else to find them
Key estimates data is also available in quick-access views such as Details, so you can check forecasts without leaving your main workflow.
The same metrics are available in the TradingView mobile app, meaning you can monitor expectations, compare companies, and stay on top of changes in analyst forecasts even when you’re away from your desktop.
Why it matters
Markets don’t move on past results alone. They move on expectations — and on how those expectations change.
With expanded estimate metrics, you can go beyond headline forecasts and ask better questions: Is expected revenue growth supported by margin expansion? Is free cash flow improving? Is debt expected to rise? Does a company still look attractive on a forward valuation basis?
This update brings more forward-looking data into your TradingView workflow, helping you connect price action, fundamentals, forecasts, screening, and chart analysis in one place.
As always, we’ll keep expanding fundamental data on TradingView so you can analyze markets with more context and fewer extra tools. Share what you think — your feedback helps us improve.
Team TradingView