Salesforce Raises Guidance and Launches $25 Billion Buyback Salesforce Raises Guidance and Launches $25 Billion Buyback to Calm the Market
By Ion Jauregui – ActivTrades Analyst
Salesforce (NYSE:CRM) decided to use its Investor Day, held this Wednesday as part of Dreamforce in San Francisco, to send a clear signal of confidence to a market that had been questioning the company's growth pace for months. The firm raised its revenue guidance for fiscal year 2027 to a range of $46.1 billion to $46.4 billion, a year-over-year increase of between 11% and 12%, and reaffirmed its target of $63 billion for 2030, above the average of $61.4 billion projected by the analyst consensus compiled by Bloomberg.
I believe this move is no coincidence. The company needed a catalyst that would turn the narrative back in its favor, and it found it on two fronts: the upward guidance and an accelerated share buyback of $25 billion, whose final settlement will be completed in October. Robin Washington, Chief Financial and Operating Officer, emphasized at the conference that the company has already repurchased a cumulative $60 billion in its own shares, although it's worth noting that this program was financed with debt: $25 billion in senior notes issued in March, which left the company with $33.3 billion in unsecured liabilities as of the close of July.
The real backbone of the story remains Agentforce. Its annual recurring revenue already exceeded $1.5 billion, with growth of more than 240% year-over-year, and when combined with Data 360, the figure is around $3.9 billion.
On the technical side, the stock closed yesterday at $243.18. The point of control (POC) is located around $185.49, within the prior price zone, which leaves the stock trading well above that historical volume reference. Moving average crossovers point to an uptrend and a trend change, with the increase in value sustained since the bullish gap opened on Thursday, August 27, which for now appears to be holding without being filled. The RSI stands at 56.87%, after having gone through a period of elevated overbought conditions, indicating that momentum has cooled into a more neutral-to-bullish zone. However, the RSI is trading above the histogram in an incremental downward trend, a divergence worth watching: the price is rising, but the underlying momentum is progressively losing strength.
Currently, the price is moving within the range prior to the yearly lows of $147.55, hit in June, placing the stock in a technical rebuilding zone following that bottom. In my view, as long as the August gap support holds, the short-term bias remains constructive, although the bearish momentum divergence calls for caution before chasing the move without additional confirmation.
*******************************************************************************************
The information provided does not constitute investment research. The material has not been prepared in accordance with the legal requirements designed to promote the independence of investment research and such should be considered a marketing communication.
All information has been prepared by ActivTrades ("AT"). The information does not contain a record of AT's prices, or an offer of or solicitation for a transaction in any financial instrument. No representation or warranty is given as to the accuracy or completeness of this information.
Any material provided does not have regard to the specific investment objective and financial situation of any person who may receive it. Past performance and forecasting are not a synonym of a reliable indicator of future performance. AT provides an execution-only service. Consequently, any person acting on the information provided does so at their own risk. Political risk is unpredictable. Central bank actions can vary. Platform tools do not guarantee success.
Fed raises rates as SK Hynix negotiates with IntelIon Jauregui – Analyst at ActivTrades
Intel (NASDAQ: INTC) shares were up 3.2% in pre-market trading on Thursday, while SK Hynix rose 2.6%, after Reuters reported that both companies are negotiating the possibility of manufacturing memory chips in the United States for the first time. Options would include leasing part of Intel’s future Ohio plant or creating a joint venture with major cloud computing companies. Neither party has confirmed a finalized agreement.
The market was also reacting to the Federal Reserve’s decision to raise interest rates by 25 basis points, to 3.75%-4%, in its first rate hike in three years. The Nasdaq was virtually flat, in a session in which the impact of higher interest rates on technology valuations contrasted with the boost from investment related to artificial intelligence.
For Intel, an agreement with SK Hynix could help improve the utilization of its manufacturing capacity and strengthen its foundry business. The unit generated just $293 million from external customers in the latest quarter, compared with $5.77 billion in total revenue. The Ohio plant, whose investment could reach $100 billion, has remained slowed since 2025 amid lower-than-expected demand.
For SK Hynix, manufacturing in the United States would allow it to bring part of its production closer to the U.S. market at a time of political pressure to relocate advanced semiconductor manufacturing. It could also facilitate access to additional capacity for HBM memory, used in data centers that are driving demand associated with artificial intelligence. Any agreement involving advanced technology could also require authorization from South Korean authorities.
On the daily chart, Intel is trading around $100-$103, above its 20-, 50- and 200-day moving averages, located at approximately $94, $98-$99 and $75, respectively. The RSI remains between 54 and 61 points, while the MACD remains positive. Support is located at $94-$99, while resistance is at $113-$115. Confirmation of the agreement could put that resistance to the test, while a deterioration in the negotiations would shift the focus back towards the lower support level.
*******************************************************************************************
The information provided does not constitute investment research. The material has not been prepared in accordance with the legal requirements designed to promote the independence of investment research and such should be considered a marketing communication.
All information has been prepared by ActivTrades ("AT"). The information does not contain a record of AT's prices, or an offer of or solicitation for a transaction in any financial instrument. No representation or warranty is given as to the accuracy or completeness of this information.
Any material provided does not have regard to the specific investment objective and financial situation of any person who may receive it. Past performance and forecasting are not a synonym of a reliable indicator of future performance. AT provides an execution-only service. Consequently, any person acting on the information provided does so at their own risk. Political risk is unpredictable. Central bank actions can vary. Platform tools do not guarantee success.
Oil consolidates above $100 as supply pressures remain
Ion Jauregui – Analyst at ActivTrades
Oil maintains a bullish structure at the European mid-session, although with some profit-taking after the strong advance of recent sessions. At 15:20 CET, LCrude is trading around $99.60 per barrel, consolidating around a zone that is once again gaining technical relevance after recovering the highs recorded in March, April and May.
The move remains supported by supply concerns. Attacks on Saudi energy infrastructure forced the interruption of the East-West Pipeline, a route capable of transporting around 4 million barrels per day to the port of Yanbu, while flows through the Strait of Hormuz remain constrained. The disruption also came after Saudi Arabia reduced some shipments to Europe.
The market has, however, started to partially price in an improvement in availability. Saudi Arabia is offering additional cargoes through Oman, while U.S. inventories increased by 7.1 million barrels last week according to API data. This explains part of today's correction, although it does not eliminate the supply risk while disruptions in the Middle East persist.
From a technical perspective, the current level is particularly relevant because the point of control is around $100, practically in the area where the contract is trading now. The recovery of the March, April and May highs has changed the structure of the daily chart and makes this area a reference for determining whether the move can extend towards new highs.
The indicators maintain a constructive reading, although the RSI stands at 67.60, close to the overbought zone, increasing the risk of short-term corrections. The MACD continues to show the average and signal line separating to the upside, with a positive and rising histogram, indicating that buying momentum continues to expand.
The behaviour of the moving averages also stands out. The 50-day moving average is approaching a recovery of its position relative to price versus the 100-day moving average, a configuration that would reinforce the bullish structure if it is ultimately confirmed. As long as the price manages to remain around $100 and the indicators maintain their momentum, the technical scenario continues to point towards a possible continuation towards previous highs.
The key for crude oil now will be its ability to turn $100 into support. Consolidation above this level would keep open the possibility of a further move higher, while a clear loss of the point of control would increase the risk of a correction before another recovery attempt.
*******************************************************************************************
The information provided does not constitute investment research. The material has not been prepared in accordance with the legal requirements designed to promote the independence of investment research and such should be considered a marketing communication.
All information has been prepared by ActivTrades ("AT"). The information does not contain a record of AT's prices, or an offer of or solicitation for a transaction in any financial instrument. No representation or warranty is given as to the accuracy or completeness of this information.
Any material provided does not have regard to the specific investment objective and financial situation of any person who may receive it. Past performance and forecasting are not a synonym of a reliable indicator of future performance. AT provides an execution-only service. Consequently, any person acting on the information provided does so at their own risk. Political risk is unpredictable. Central bank actions can vary. Platform tools do not guarantee success.
 Long
Long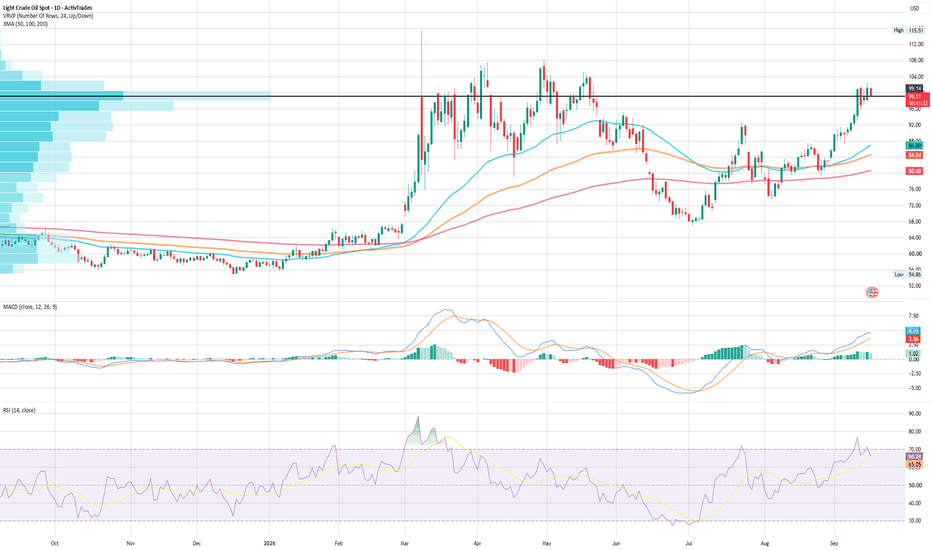
SpaceX Gains Weight in the Nasdaq 100
Ion Jauregui – Analyst at ActivTrades
SpaceX faces a significant increase in its weighting in the Nasdaq 100, which could rise approximately from 1.28% to 2.82% in the September rebalancing.
The adjustment is mainly due to the increase in free float following the release of more than 1 billion shares that remained subject to restrictions after the IPO.
The higher weighting will force funds and ETFs that replicate the Nasdaq 100 to increase their exposure to SpaceX. JPMorgan had previously estimated that a weighting close to 2.25% could generate around $15.5 billion in net purchases.
However, the increase in passive demand will coincide with new share unlocks over the coming months, which will also increase the supply available in the market.
Fundamental Analysis
SpaceX maintains a strong growth rate, supported mainly by Starlink, while continuing to increase investment in Starship and technological infrastructure.
The company reported revenue of approximately $7.8 billion in the second quarter of 2026, with year-on-year growth of close to 92%, while adjusted EBITDA exceeded $3.5 billion.
The main challenge remains the high capital intensity. The company’s valuation, above $2 trillion, incorporates very high growth expectations, meaning that the performance of Starlink, Starship, and the ability to turn investment into profitability will be key over the coming quarters.
Technical Analysis of SpaceX, SPCX
The SPCX price has maintained a sideways structure since August 11 and closed at around $151.21, while in premarket it is trading near $147.26.
The price is approaching the 25% Fibonacci retracement, calculated from the move that began on July 14, with a technical reference around $148.
The MACD maintains a slightly positive trend, although with a low-amplitude histogram, while the RSI is close to 59%, showing a progressive recovery in momentum since mid-August.
The $148 area remains the immediate support, while a recovery above $155 would reinforce the bullish continuation scenario.
Technical Analysis of the Nasdaq 100
The Nasdaq 100 maintains a positive medium-term structure, although with lower momentum in recent sessions.
The 29,100 to 29,200-point area represents the immediate technical support, while the 29,550 to 29,650-point area represents the main short-term resistance.
The increase in SpaceX’s weighting will have a direct effect on vehicles that replicate the index, although its aggregate impact on the Nasdaq 100 will remain limited compared with the performance of the major technology companies.
Outlook
The rebalancing represents a favorable technical catalyst for SpaceX in the short term, by generating additional demand from passive funds. However, the progressive increase in free float and upcoming share unlocks could offset part of this effect.
The $148 area will be the main technical reference in the short term.
*******************************************************************************************
The information provided does not constitute investment research. The material has not been prepared in accordance with the legal requirements designed to promote the independence of investment research and such should be considered a marketing communication.
All information has been prepared by ActivTrades ("AT"). The information does not contain a record of AT's prices, or an offer of or solicitation for a transaction in any financial instrument. No representation or warranty is given as to the accuracy or completeness of this information.
Any material provided does not have regard to the specific investment objective and financial situation of any person who may receive it. Past performance and forecasting are not a synonym of a reliable indicator of future performance. AT provides an execution-only service. Consequently, any person acting on the information provided does so at their own risk. Political risk is unpredictable. Central bank actions can vary. Platform tools do not guarantee success.
Inditex strengthens inventories while price supports 200day EMAInditex strengthens inventories while the stock price seeks support at the 200-day moving average
Ion Jauregui – Analyst at ActivTrades
Inditex faces a more demanding operating environment with a still-solid financial position, but also with a supply chain facing increasing pressure from the conflict in the Middle East. The group closed the first half of its fiscal year with €3.789 billion in inventories, 16.6% more than at the end of the previous financial year and 9.3% above the same period in 2025.
The increase in inventories comes at a particularly sensitive time for international transportation. Tensions in the Middle East, risks to maritime routes and higher insurance and transportation costs have increased uncertainty over supply times and costs. Inditex does not directly attribute the increase in inventory to the conflict, but rather to its strong operating performance, although it acknowledges that the geopolitical situation may affect energy prices, supply chains and financial and foreign exchange markets.
The strategy has a defensive reading. Maintaining more products available makes it possible to reduce the risk of disruptions and preserve the ability to supply stores and the online channel even amid changes in logistics routes. Geographic diversification and the flexibility of the supply chain are, in this context, one of the group's main operating assets.
However, this protection comes at a cost. Gross margin stood at 58.7% in the first half, four tenths of a percentage point above the previous year, but slightly below market expectations. At the same time, net profit reached a record €2.980 billion, up 6.8% year-on-year, while net financial position rose to €10.398 billion.
The stock loses momentum
The market reaction reflects precisely this tension between growth and profitability. The stock suffered a sharp adjustment following the publication of the results and, since then, its short-term technical structure has weakened.
At the opening of this September 11 session, Inditex continues to trade below the 50-day moving average, following the bearish gap recorded at Wednesday's opening. The moving averages are currently expanding, confirming an increase in the distance between them and a structure showing greater pressure on the price.
The most relevant technical reference at this point is the 200-day moving average, which is acting as support for the current price. The stock's ability to remain above this moving average will be particularly important in determining whether the current move represents a correction within a still-defensible long-term structure or, on the contrary, opens the door to a deeper bearish phase.
Momentum is also not currently favoring an immediate recovery. The RSI stands at around 37%, approaching oversold territory, while the MACD remains in negative territory, with the histogram continuing to expand further into negative territory. Both indicators show that selling pressure remains present, although the RSI is beginning to approach a zone where a technical reaction may emerge.
Two volume areas
The volume profile adds two particularly relevant references. The current volume distribution shows its Point of Control (POC) around €47.37, the level concentrating the highest traded volume within the structure currently being analyzed.
Above it, the previous formation maintains another POC around €55.99, making this an important reference zone for any potential recovery. The shift between both levels reflects the change in equilibrium experienced by the stock following the decline.
Therefore, while €47.37 represents the volume reference for the current structure, €55.99 constitutes a much more demanding recovery zone. The price would need to progressively recover the intermediate areas and, especially, return above the 50-day moving average to begin rebuilding a more favorable technical structure.
In the short term, the combination of price below the 50-day moving average, expanding moving averages, RSI approaching oversold territory and a negative MACD keeps the technical bias under pressure. However, the fact that the price is finding support at the 200-day moving average, together with the RSI's proximity to oversold levels, leaves the possibility of a technical reaction open if sufficient demand emerges.
The fundamental scenario continues to show two speeds. Inditex maintains growth, record profits and a financial position capable of absorbing part of the increase in logistics costs. But the market now requires the company to demonstrate to what extent it can preserve its margins in an environment of higher transportation costs, geopolitical tensions and greater investment in inventory.
The evolution of the stock price will therefore depend on whether the 200-day moving average manages to hold the price and generate a reaction capable of recovering momentum, or whether selling pressure ultimately prevails and forces the market to seek a new equilibrium below this support.
*******************************************************************************************
The information provided does not constitute investment research. The material has not been prepared in accordance with the legal requirements designed to promote the independence of investment research and such should be considered a marketing communication.
All information has been prepared by ActivTrades ("AT"). The information does not contain a record of AT's prices, or an offer of or solicitation for a transaction in any financial instrument. No representation or warranty is given as to the accuracy or completeness of this information.
Any material provided does not have regard to the specific investment objective and financial situation of any person who may receive it. Past performance and forecasting are not a synonym of a reliable indicator of future performance. AT provides an execution-only service. Consequently, any person acting on the information provided does so at their own risk. Political risk is unpredictable. Central bank actions can vary. Platform tools do not guarantee success.
S&P 500 maintains its structure while losing momentumIon Jauregui – Analyst at ActivTrades
The S&P 500 starts the European session at 7,656 points, maintaining a still solid technical position despite the loss of momentum that the market has been showing in recent weeks. The index continues to hold above the 50-session moving average, while the moving averages remain expanded, a sign that the underlying structure has not yet deteriorated.
The point of control stands at 7,476.16 points, a particularly relevant reference for determining the strength of the current move. The distance between this level and the current price keeps the index above an important equilibrium zone, although a move towards this level would test buyers’ ability to defend the structure.
Momentum indicators, however, show a less favourable situation. The RSI stands at 49%, in neutral territory, after losing the strength that accompanied the previous advance. The indicator is not currently showing an extreme situation, but neither does it confirm sufficient buying pressure to anticipate an immediate acceleration of the move.
The MACD continues to decline, with the histogram in negative territory since August 20. The persistence of this signal reflects a loss of momentum that contrasts with the still positive price structure. For now, this divergence between price and momentum points more towards a consolidation phase than towards a confirmed change in trend.
The key technical reference will remain at 7,476.16 points. As long as the S&P 500 remains above this level and the 50-session moving average, the structure will remain constructive. A break of both references would change the scenario and increase the risk of a deeper correction.
For now, the index maintains a positive bias, but with less strength than observed during the previous leg. Price behaviour around the point of control and the evolution of the MACD will be key in determining whether the market is simply taking a breather or entering a corrective phase.
*******************************************************************************************
The information provided does not constitute investment research. The material has not been prepared in accordance with the legal requirements designed to promote the independence of investment research and such should be considered a marketing communication.
All information has been prepared by ActivTrades ("AT"). The information does not contain a record of AT's prices, or an offer of or solicitation for a transaction in any financial instrument. No representation or warranty is given as to the accuracy or completeness of this information.
Any material provided does not have regard to the specific investment objective and financial situation of any person who may receive it. Past performance and forecasting are not a synonym of a reliable indicator of future performance. AT provides an execution-only service. Consequently, any person acting on the information provided does so at their own risk. Political risk is unpredictable. Central bank actions can vary. Platform tools do not guarantee success.
Qualcomm looks for the boost to enter the new league of AIQualcomm looks to Amazon for the boost to enter the new league of artificial intelligence
Ion Jauregui | Analyst at ActivTrades
Qualcomm (NASDAQ:QCOM) wants to leave behind its label as a smartphone chip manufacturer. The partnership announced with Amazon (NASDAQ:AMZN) could become one of the main catalysts to achieve this: both companies will develop customized chips for AWS data centers, in an agreement that could reach up to $60 billion in chip and related product purchases. Amazon will also receive warrants to acquire up to 25 million Qualcomm shares at $161.26 per share.
The move comes at a particularly relevant moment for Qualcomm. The company is seeking to diversify its business ahead of the future loss of Apple’s modem business and is accelerating its entry into the artificial intelligence infrastructure market. The goal is to reach $5 billion in data center revenue in 2027 and $15 billion in 2029.
Amazon therefore represents more than just a new customer. It is a validation of Qualcomm’s strategy to compete in a part of the market dominated so far by Nvidia and where major cloud providers are also increasing their presence through customized chips.
From August lows to a technical recovery
On the stock market, Qualcomm is still far from its recent highs. The stock closed yesterday at $174.07, after touching a low of $142.82 on August 3. From that level, QCOM has recovered around 22%, forming a recovery structure that now finds a new fundamental catalyst in the Amazon agreement.
The stock appears to be moving toward the last relevant ceiling at $195.98. This level represents the first major test to determine whether the current recovery can develop into a new bullish phase.
A clear break above $195.98, particularly if accompanied by volume, would significantly change the technical structure. Above that level, a much more demanding area emerges: the range between $233.21 and $259.70, where Qualcomm established important price references during the previous quarter and reached all-time highs in May.
Specifically, the levels of $233.21, $247.58 and $259.70 form a resistance band that coincides with the structure that can currently be interpreted as a head-and-shoulders formation. Breaking above $195.98 would therefore be the first step; subsequently recovering this broad supply zone would be a more significant test for the long-term trend.
The POC as a reference for the recovery
Meanwhile, the Point of Control (POC) is currently located at $159.265, a particularly relevant reference because it concentrates the highest traded volume within the analyzed range.
The price remains above this level, favoring a constructive reading as long as QCOM manages to consolidate above the $159 area. A loss of the POC would bring renewed selling pressure to the stock and could open the way toward lower support levels.
Moving-average crosses currently show price compression, reflecting the transition process between the corrective phase of recent months and the current recovery attempt. There is not yet enough separation to speak of a fully consolidated bullish trend, but there is a structure that could gain momentum if the price breaks above $195.98.
Momentum indicators partially support this view. The RSI stands at 58.92%, still far from overbought territory, while the MACD continues to recover and its histogram is green. Overall, the indicators point to improving buying momentum, although a confirmation through resistance breaks will still be necessary to speak of a structural change.
Amazon changes the narrative
The importance of the agreement lies not only in the potential $60 billion. Qualcomm and Amazon will also work on optical connectivity technologies for data centers, with solutions capable of reaching speeds of up to 1.6 terabits per second. The bet therefore covers both processing and the interconnection required to power AI infrastructure.
For Qualcomm, the question now is to demonstrate that the data center business can become a recurring source of growth and offset the progressive maturity of its mobile business.
For the market, the equation is more immediate. $174.07 is the starting point of a recovery that needs to break above $195.98 to confirm a new bullish phase. Above that level, attention would shift toward the $233-$260 area, where a much more significant resistance zone is concentrated.
Qualcomm has managed to enter the artificial intelligence conversation. Now it has to prove that it can stay there.
*******************************************************************************************
The information provided does not constitute investment research. The material has not been prepared in accordance with the legal requirements designed to promote the independence of investment research and such should be considered a marketing communication.
All information has been prepared by ActivTrades ("AT"). The information does not contain a record of AT's prices, or an offer of or solicitation for a transaction in any financial instrument. No representation or warranty is given as to the accuracy or completeness of this information.
Any material provided does not have regard to the specific investment objective and financial situation of any person who may receive it. Past performance and forecasting are not a synonym of a reliable indicator of future performance. AT provides an execution-only service. Consequently, any person acting on the information provided does so at their own risk. Political risk is unpredictable. Central bank actions can vary. Platform tools do not guarantee success.
ISP: OPA, +44% and a new attack on the highs?Ion Jauregui – Analyst at ActivTrades
Intesa Sanpaolo faces a decisive week. The €30.6 billion offer for Monte dei Paschi di Siena could accelerate Italian banking consolidation, while ISP enters the event after rising more than 44% since March. The price has been moving sideways since the August highs, while indicators are beginning to show a loss of momentum.
An OPA that could change the Italian banking landscape
Intesa Sanpaolo is once again at the center of European banking consolidation with its offer of around €30.6 billion for Monte dei Paschi di Siena (MPS). The transaction aims to create a group with more than 27 million customers and close to €2 trillion in customer financial assets by 2029.
Intesa expects to obtain around €2.9 billion in additional financial benefits, combining cost savings and higher revenues. The bank expects to achieve approximately 60% of these synergies in 2028 and complete its target in 2029. Intesa shareholders will vote on the transaction on September 10.
The proposal comes at a time of strong reorganization in the Italian financial system. MPS has proposed defensive transactions involving Banco BPM and Banca Generali to preserve its independence, increasing the strategic importance of Intesa's offer.
For Intesa, the acquisition could strengthen its position in the domestic market and generate new economies of scale. However, the market will also have to assess the risks associated with integration, capital consumption and the ability to translate the expected synergies into higher earnings and profitability.
ISP: sideways movement after a rally of more than 44%
The share price of Intesa Sanpaolo (ISP) maintains a bullish medium-term structure. From the lows of March 26, at €4.81, the stock advanced to reach €6.933 in mid-August, accumulating an approximate 44% gain.
Since those highs, the price has entered a phase of sideways movement, currently trading around €6.68. Rather than a significant correction, the behavior reflects a pause following the strong move accumulated since March, with the price moving within a relatively narrow range.
Technical indicators show precisely this loss of momentum. The RSI has declined from its highs toward the middle range, while the MACD is close to entering negative territory. The histogram has remained red since August 18, signaling a progressive reduction in buying momentum.
This situation does not necessarily imply a change in trend. The price continues to move sideways while the indicators unwind part of the excess accumulated during the latest bullish leg. The key will be to determine in which direction this range is eventually resolved.
The first reference on the downside is located in the €6.60-€6.65 area. As long as ISP remains above this level, the sideways movement can continue to be interpreted as a pause within the main bullish trend.
In the event of a clear break below €6.60, the risk of a deeper correction would increase. In that scenario, the price-volume profile shows a second Point of Control (POC) area around €5.76, which would act as a relevant reference.
On the upside, the €6.90-€6.93 area represents the immediate resistance and coincides with the August highs. A clear breakout above this level could restart the bullish momentum and open the door to new highs.
The OPA meets a market waiting for confirmation
The fundamental and technical contexts are now converging. The MPS transaction represents a relevant catalyst for Intesa precisely as the stock enters a sideways phase after a rally of more than 44%.
The September 10 shareholder vote could become the next factor capable of increasing volatility. A positive reception of the transaction could provide the momentum needed to retest the August highs. Conversely, any doubts about execution, synergies or capital consumption could keep the price within the current range or increase selling pressure.
For now, the medium-term outlook remains favorable. The bullish structure remains intact, but momentum has weakened and the price needs to regain strength to challenge €6.93 again.
The equation is straightforward: €6.60 on the downside and €6.93 on the upside. A breakout of either extreme will likely determine ISP's next significant move.
After moving from €4.81 to €6.933 in less than five months, Intesa Sanpaolo is now entering a waiting phase. The OPA could provide the catalyst, but it will be the price that determines whether this sideways movement ultimately resolves into another bullish breakout or a deeper correction.
*******************************************************************************************
The information provided does not constitute investment research. The material has not been prepared in accordance with the legal requirements designed to promote the independence of investment research and such should be considered a marketing communication.
All information has been prepared by ActivTrades ("AT"). The information does not contain a record of AT's prices, or an offer of or solicitation for a transaction in any financial instrument. No representation or warranty is given as to the accuracy or completeness of this information.
Any material provided does not have regard to the specific investment objective and financial situation of any person who may receive it. Past performance and forecasting are not a synonym of a reliable indicator of future performance. AT provides an execution-only service. Consequently, any person acting on the information provided does so at their own risk. Political risk is unpredictable. Central bank actions can vary. Platform tools do not guarantee success.
 Long
Long
Gold and Bonds: Norway’s SignalIon Jauregui – ActivTrades Analyst
Gold is once again looking towards US bonds, but this time the question is not only how much yields are rising, but why they are rising.
Norway’s sovereign wealth fund, the largest in the world, with around $2.3 trillion, has proposed reducing the weight of government debt within its fixed-income index from 70% to 50%. The change could mean a reduction of close to $80 billion in US Treasury bonds, from around $215 billion currently. The strategy envisages increasing exposure to mortgage debt and other higher-risk, higher-yield assets, and would be implemented gradually from 2027, subject to the relevant approval.
The amount is significant, but the signal is even more important. If large institutional investors reduce their demand for Treasuries, the United States could have to offer higher yields to place its debt, particularly at the longer end of the curve.
And this is where gold comes in.
Traditionally, higher yields are negative for the metal because they increase the opportunity cost of holding an asset that does not pay interest. However, it is not the same if yields rise because of economic strength and a restrictive Fed, or because of a higher risk premium on US debt.
In the first scenario, gold suffers. In the second, rising yields can become an argument in favour of the metal.
Gold also has other structural supports: central-bank purchases, diversification of international reserves, geopolitical uncertainty and concerns about the fiscal sustainability of major economies. Unlike a Treasury, gold does not depend on the solvency of an issuer.
This does not mean that investors are replacing US bonds with gold. The process is more gradual: diversifying risk and reducing concentration in a single sovereign asset.
Technical analysis
At the opening, gold is trading around $4,412 per ounce. The point of control of the price profile remains at $4,036, clearly below the current price. The new control area has shifted towards current levels, with the price located approximately in the middle of the range between the lows of $4,290.97 and $4,529.27. Current highs stand at $4,696.88.
The RSI, at 46.35%, remains in a middle zone, not yet showing an overbought condition. The MACD has a declining histogram, while its moving average and signal line remain below it, following the recovery recorded during the first week of September.
The technical reading is therefore one of consolidation within an overall still favourable structure, but without confirmation of a new bullish impulse.
The key will continue to lie outside gold itself: the Fed, the dollar, Treasuries and, increasingly, who is willing to continue financing US debt and at what price.
*******************************************************************************************
The information provided does not constitute investment research. The material has not been prepared in accordance with the legal requirements designed to promote the independence of investment research and such should be considered a marketing communication.
All information has been prepared by ActivTrades ("AT"). The information does not contain a record of AT's prices, or an offer of or solicitation for a transaction in any financial instrument. No representation or warranty is given as to the accuracy or completeness of this information.
Any material provided does not have regard to the specific investment objective and financial situation of any person who may receive it. Past performance and forecasting are not a synonym of a reliable indicator of future performance. AT provides an execution-only service. Consequently, any person acting on the information provided does so at their own risk. Political risk is unpredictable. Central bank actions can vary. Platform tools do not guarantee success.
Wall Street faces a capital reform that divides its major banksIon Jauregui – Analyst at ActivTrades
Wall Street’s financial giants are facing a reform of capital rules that will not distribute its benefits evenly. Goldman Sachs and Morgan Stanley could emerge as beneficiaries, while JPMorgan would face a less comfortable position.
The proposal by U.S. regulators would reduce capital requirements for major banks by around 4.8% and could free up as much as $320 billion across the financial system. That capital could be used for new operations, lending, dividends or share buybacks.
The problem is that the impact will depend on each bank’s business model. Goldman Sachs and Morgan Stanley, with greater exposure to market activities and wholesale funding, could benefit from changes in the way their capital surcharges are calculated. Estimates suggest that each could obtain between $1 billion and $2 billion in additional capital relief.
JPMorgan, by contrast, could find itself in a less favorable position. Its structure, which relies more heavily on deposits and traditional banking, means that some of the proposed changes would have a different impact. Estimates point to around $13 billion less in capital relief than it initially expected.
The difference is important for shareholders: the less capital a bank needs to keep tied up to comply with regulation, the greater its potential flexibility to use it for growth or return it through dividends and share buybacks.
And this is where the reform becomes relevant for the Dow Jones, because Goldman Sachs, Morgan Stanley and JPMorgan are all components of the index.
In European trading hours, the Dow Jones is trading around 43,678 points, maintaining a long-term upward trend, although it is currently in a consolidation phase. The price is finding support around the 50- and 100-session moving averages, while the 200-session moving average remains a key reference for the broader trend.
The Point of Control (POC) stands at 52,254.30 points, within the volume area associated with the move that subsequently took the index to 54,795.85 points. The distance between these levels shows the depth of the correction from the highs.
The indicators are currently pointing toward stabilization. The RSI stands at 55.90%, having moved sideways over recent sessions, while the MACD shows a fading of the bearish trend, with the MACD line and signal line virtually flat.
The technical key now lies in the Dow’s ability to hold the 50- and 100-session moving averages. As long as it does so, the long-term bullish structure remains intact. A recovery in momentum would bring the POC at 52,254.30 back into focus, followed by the 54,795.85 high.
After so many years following the markets, I increasingly believe that a regulatory reform can change a company’s fundamentals, but it is the price that ultimately tells us whether the market considers that change positive or negative.
In this case, Goldman Sachs and Morgan Stanley could turn lower capital requirements into greater returns for their shareholders, while JPMorgan faces the opposite challenge. And that divergence will be another variable the Dow Jones will have to absorb as it attempts to define its next move.
*******************************************************************************************
The information provided does not constitute investment research. The material has not been prepared in accordance with the legal requirements designed to promote the independence of investment research and such should be considered a marketing communication.
All information has been prepared by ActivTrades ("AT"). The information does not contain a record of AT's prices, or an offer of or solicitation for a transaction in any financial instrument. No representation or warranty is given as to the accuracy or completeness of this information.
Any material provided does not have regard to the specific investment objective and financial situation of any person who may receive it. Past performance and forecasting are not a synonym of a reliable indicator of future performance. AT provides an execution-only service. Consequently, any person acting on the information provided does so at their own risk. Political risk is unpredictable. Central bank actions can vary. Platform tools do not guarantee success.
USDCAD: Canada Hits Back and Wall Street Watches CloselyIon Jauregui – Analyst at ActivTrades
There are times when you look at a currency pair and discover that behind a price there is much more than two currencies facing each other. That is what is happening now with USDCAD. Canada has hit back at “Uncle Trump” and the trade war is once again raising a question that goes far beyond the Canadian dollar: to what extent could a new escalation in trade tensions end up affecting Wall Street as well?
Canada has responded to Washington’s tariffs with duties on around $20 billion of U.S. goods, along with support measures for companies and workers. The problem is not only the amount involved. The United States and Canada maintain deeply integrated supply chains, and any new trade barrier can be passed on to costs, corporate margins and growth expectations.
This is where USDCAD becomes interesting.
Since 2024, the pair has been moving within a broad range between 1.34185 and 1.42476 Canadian dollars per U.S. dollar. With the current price close to 1.38830, it remains in the middle of the range and, for now, without a structural breakout.
In the short term, however, the price has started to recover. The RSI is coming out of oversold territory and the MACD is showing a timid improvement in momentum. But the moving averages maintain a clearly bearish trend, so there is still no confirmation of a trend change.
Technically, therefore, I would describe this as a recovery within an still-bearish structure. The 1.40 area will be a first reference, while 1.42476 represents the upper part of the range. On the downside, 1.34185 remains the structural support.
But USDCAD does not move in isolation. There is another fundamental protagonist: oil.
WTI has been heavily influenced by the war between the United States and Iran. The geopolitical premium pushed prices higher, but expectations of de-escalation subsequently triggered a strong correction. Crude is now around $81.29 and, although it maintains a corrective trend, the latest sessions have been building a sideways movement.
This matters for the CAD. Canada is one of the main oil suppliers to the United States, and the evolution of crude has a significant influence on its currency. Strong oil prices can support the CAD and limit the advance of USDCAD; another correction in crude could remove part of that support.
But there is now a second force: the trade war.
If tariffs deteriorate expectations for the Canadian economy at the same time that oil loses strength, both factors could put pressure on the CAD. In that scenario, USDCAD would have arguments to continue recovering.
The connection with the S&P 500 is not mechanical either. A rising USDCAD does not necessarily mean that Wall Street will fall. Both markets may be reacting to the same factor: an increase in perceived risk.
Tariffs can raise costs, reduce margins and affect corporate earnings. They can also fuel inflation and limit the Federal Reserve’s room for manoeuvre. And if uncertainty increases, appetite for risk assets may deteriorate.
The problem is that the S&P 500 enters this scenario close to record highs and with little room for disappointment. The latest Reuters poll puts the index at around 7,900 points by the end of 2026, approximately 3% above current levels, supported by earnings growth and optimism surrounding artificial intelligence.
That is why, personally, I think it is worth watching the three markets together.
Oil tells us about inflation, energy and growth. USDCAD reflects the combination of the dollar, CAD, trade and commodities. And the S&P 500 shows how much risk Wall Street is willing to take.
For now, the USDCAD chart calls for caution. RSI is recovering, MACD is beginning to improve and the price is rebounding, but the moving averages remain bearish. There is still no confirmation of a trend change.
The signal would be much more relevant if the pair breaks above 1.40, approaches 1.42476 and the moving averages begin to turn higher. Until that happens, we are looking at a recovery within a range.
And here, in my opinion, is the really interesting question: what is USDCAD pricing in that Wall Street has not yet priced in?
Because if the Canadian dollar continues to weaken while trade tensions increase and oil loses strength, USDCAD could be anticipating a deterioration in economic expectations that is not yet fully reflected in the S&P 500.
With the index close to record highs and strategists expecting only another 3% gain by year-end, perhaps it is worth looking at the currency market as well to understand how much room for error Wall Street still has.
*******************************************************************************************
The information provided does not constitute investment research. The material has not been prepared in accordance with the legal requirements designed to promote the independence of investment research and such should be considered a marketing communication.
All information has been prepared by ActivTrades ("AT"). The information does not contain a record of AT's prices, or an offer of or solicitation for a transaction in any financial instrument. No representation or warranty is given as to the accuracy or completeness of this information.
Any material provided does not have regard to the specific investment objective and financial situation of any person who may receive it. Past performance and forecasting are not a synonym of a reliable indicator of future performance. AT provides an execution-only service. Consequently, any person acting on the information provided does so at their own risk. Political risk is unpredictable. Central bank actions can vary. Platform tools do not guarantee success.
AI Enters Banking and Alibaba Doubles Down on the SectorIon Jauregui – Analyst at ActivTrades
Artificial intelligence is entering a new phase of monetisation. After conquering data centres and enterprise software, major technology companies are now looking to bring it to sectors with huge technology budgets. Banking and insurance are now among the main targets.
Alphabet has launched Gemini Enterprise for Financial Services through Google Cloud, a solution specifically designed for banks, insurers and other financial institutions. The company is looking to integrate AI agents into financial processes, data analysis and document management, directly competing with Microsoft Azure and Amazon Web Services for a market of enormous scale.
The move comes at a time of strong growth for Google Cloud. Alphabet closed the second quarter with revenue of $119.8 billion, up 24% year-on-year, while Google Cloud grew 82% to $24.8 billion. The main challenge is the huge level of investment required to maintain this expansion: Alphabet expects capex of between $195 billion and $205 billion in 2026.
Microsoft presents an equally solid situation. In its latest fiscal quarter, revenue increased 18% to $90 billion, while Azure grew 43%. Amazon is also accelerating: AWS revenue increased 37% to $42.2 billion, and the company expects to invest around $220 billion during 2026.
For the market, the question is no longer simply who will lead AI, but whether revenue growth will be enough to offset the enormous increase in spending on data centres, chips and energy.
Alphabet: Gemini seeks to turn AI into a financial business
Alphabet closed yesterday at $347.29, compared with a point of control (POC) of $347.01. The moving averages remain in a recovery trend, while the share price remains slightly above this control zone.
Microsoft: Azure maintains its leadership
Microsoft ended the session at $491.50, compared with a POC of $400.65. The moving averages remain in an uptrend, reinforcing the stock's positive technical structure while the price remains above its point of control.
Amazon: AWS supports the AI thesis
Amazon closed at $261.73, compared with a POC of $209.43. The moving averages remain in a recovery process, while the share price continues to trade slightly above its point of control.
Fundamentally, the strong growth of AWS and the expansion of its artificial intelligence-related services remain the company's main catalysts.
Alibaba: Jack Ma reinforces his bet on AI
Alibaba offers a different picture. Jack Ma has bought more than HK$600 million worth of Alibaba shares, around $77 million, after the company announced a record HK$80 billion placement, equivalent to around $10.2 billion, to finance its expansion in artificial intelligence. Chairman Joe Tsai and CEO Eddie Wu have also bought shares, reinforcing the signal of insider confidence.
The move comes with costs for shareholders. The placement involves the issuance of 710 million new shares, approximately 3.7% of existing shares, at a price of HK$112.70. Alibaba has said it will use the proceeds entirely to develop its AI infrastructure and capabilities.
The latest results show this tension. Alibaba is sharply increasing its investment in artificial intelligence, while cloud and AI revenue grew 45%. However, net profit fell 75%, reflecting the high cost of this expansion.
Alibaba closed yesterday in New York at $119.48, compared with a POC of $123.39. The moving averages remain compressed and in the process of expanding, a configuration pointing to a gradual increase in the movement following the period of consolidation.
A common pattern can be seen across the four companies: Alphabet, Microsoft, Amazon and Alibaba are trading slightly above their respective points of control. At the same time, the moving averages show recovery or expansion across all four stocks, although with different degrees of intensity.
The next phase of the technology race will not depend solely on who develops the best models, but on who can turn them into recurring revenue, growth and profitability. Banking could become one of the main battlegrounds.
*******************************************************************************************
The information provided does not constitute investment research. The material has not been prepared in accordance with the legal requirements designed to promote the independence of investment research and such should be considered a marketing communication.
All information has been prepared by ActivTrades ("AT"). The information does not contain a record of AT's prices, or an offer of or solicitation for a transaction in any financial instrument. No representation or warranty is given as to the accuracy or completeness of this information.
Any material provided does not have regard to the specific investment objective and financial situation of any person who may receive it. Past performance and forecasting are not a synonym of a reliable indicator of future performance. AT provides an execution-only service. Consequently, any person acting on the information provided does so at their own risk. Political risk is unpredictable. Central bank actions can vary. Platform tools do not guarantee success.
BWXT: U.S. Nuclear Maritime Strategy Opens a New OpportunityBy Ion Jauregui – Analyst at ActivTrades
U.S. Seeks to Regain Ground in Shipbuilding
The United States is moving forward with British company Core Power on a regulatory framework to develop a future fleet of nuclear-powered merchant vessels, as part of its strategy to strengthen the U.S. shipbuilding industry against China’s dominance.
The initiative has a direct connection to BWX Technologies (NYSE: BWXT). Core Power is studying the integration of BWXT’s mPower modular reactor into future floating nuclear power plants. Although there is still no contract for a commercial fleet, the project opens a potential additional market for the company.
BWXT, Between Defense and Next-Generation Nuclear Technology
BWXT starts from a strategic position thanks to its experience in U.S. naval nuclear propulsion and the development of small modular reactors. The potential use of mPower in maritime applications would expand the scope of a company already involved in some of the United States’ main nuclear programs.
The impact on earnings, however, would not be immediate. The maritime nuclear industry still has to overcome significant regulatory, technological and financial obstacles before reaching commercial scale.
Bearish Pressure Dominates the Chart
The stock closed the latest session at $149.27, following a prolonged correction that has brought the share price back to levels last seen in July 2025.
A Head-and-Shoulders pattern has formed during the year, with the loss of support reinforcing the bearish trend. The share price has also closed the existing price gap.
The RSI stands at 29.30, in oversold territory, while the MACD remains clearly negative, with no confirmation yet of a recovery in momentum.
$175.26, the Key Level
The Point of Control (POC) of the volume distribution is currently around $175.26. This reference will be particularly important in determining whether BWXT can recover part of its lost ground.
From the current $149.27 level, reaching the POC would represent an approximate 17.4% recovery. As long as the price remains below this level, it will act as significant resistance.
Favorable Fundamentals, Technical Confirmation Still Needed
BWXT combines increasing exposure to strategic sectors of the U.S. nuclear industry with a still clearly bearish technical structure.
The expansion of maritime nuclear power represents a long-term opportunity, but the chart calls for caution. A sustained recovery above $175.26 would significantly improve the technical structure; meanwhile, oversold conditions could favor a rebound, but do not by themselves confirm a trend reversal.
*******************************************************************************************
The information provided does not constitute investment research. The material has not been prepared in accordance with the legal requirements designed to promote the independence of investment research and such should be considered a marketing communication.
All information has been prepared by ActivTrades ("AT"). The information does not contain a record of AT's prices, or an offer of or solicitation for a transaction in any financial instrument. No representation or warranty is given as to the accuracy or completeness of this information.
Any material provided does not have regard to the specific investment objective and financial situation of any person who may receive it. Past performance and forecasting are not a synonym of a reliable indicator of future performance. AT provides an execution-only service. Consequently, any person acting on the information provided does so at their own risk. Political risk is unpredictable. Central bank actions can vary. Platform tools do not guarantee success.
NVIDIA: Earnings and Jackson Hole Put the AI Rally to the Test
By Ion Jauregui – Analyst at ActivTrades
NVIDIA is facing a decisive week for the technology market. The company will report its second-quarter fiscal results on August 26, while the Jackson Hole symposium will take place from August 27 to 29. Both events come at a particularly sensitive time for markets, following the recent pressure exerted by rising U.S. Treasury yields on technology companies and the high valuations associated with artificial intelligence. NVIDIA’s results will be particularly relevant because they will help determine whether the strong growth in AI-related demand continues to support market expectations.
The market continues to have very high expectations for the company. NVIDIA’s growth remains closely linked to investment by major technology companies in artificial intelligence infrastructure, but precisely this strength means that any deviation from forecasts could generate a significant reaction in the stock price. At the same time, the evolution of interest rates will remain decisive. A more favourable rate environment could once again support growth companies, while elevated yields could favour a rotation of capital towards other segments of the market. In my view, this is not necessarily an outflow of money from technology, but rather a movement of capital from areas with more demanding valuations towards other opportunities within the market.
From a technical perspective, NVIDIA closed on Friday at $214.59, after correcting throughout the week from $227.90. The pullback has once again taken the price towards the support observed on July 22, while the stock continues to develop a range-bound process in an area close to its highs. The moving averages remain upwardly directional, meaning that the main structure remains positive. However, the indicators are beginning to show a loss of momentum. The RSI is around 50%, reflecting a balance between buyers and sellers, while the MACD has begun to lose strength, with the MACD line and signal line still above zero, although with an incipiently negative histogram. For now, this points to a possible consolidation or correction phase, but it does not confirm a change in trend.
NVIDIA’s reaction will therefore depend on the combination of earnings and monetary policy expectations. If the results confirm the strength of artificial intelligence demand and Jackson Hole delivers a positive message for risk assets, the stock could recover $227.90 and subsequently move towards the highs of $236.51. Conversely, if the results disappoint or the Federal Reserve adopts a less favourable tone for equities, selling pressure could increase and push the price towards the strong support at $190.
As long as the moving averages remain upwardly oriented, I consider the main scenario to remain one of consolidation within a positive trend. The loss of momentum reflected by the MACD nevertheless calls for close attention to support levels. NVIDIA is in a defining area: a breakout of the highs could reactivate the bullish move, while a loss of the current support levels would open the door to a deeper correction towards $190. This week, earnings and Jackson Hole could provide the catalyst needed to determine which end of the range is ultimately broken.
*******************************************************************************************
The information provided does not constitute investment research. The material has not been prepared in accordance with the legal requirements designed to promote the independence of investment research and such should be considered a marketing communication.
All information has been prepared by ActivTrades ("AT"). The information does not contain a record of AT's prices, or an offer of or solicitation for a transaction in any financial instrument. No representation or warranty is given as to the accuracy or completeness of this information.
Any material provided does not have regard to the specific investment objective and financial situation of any person who may receive it. Past performance and forecasting are not a synonym of a reliable indicator of future performance. AT provides an execution-only service. Consequently, any person acting on the information provided does so at their own risk. Political risk is unpredictable. Central bank actions can vary. Platform tools do not guarantee success.
Yen: momentum recovery, but without bullish confirmation
Ion Jauregui – Analyst at ActivTrades
The yen has moved within a wide range defined by the 163.985 highs and the 139.571 support. The short-term bullish trend has held, with a moderately positive session yesterday, although the move remains conditioned by the evolution of the dollar and expectations regarding US fiscal and monetary policy.
On the macroeconomic front, the market is closely watching signals coming from Washington. US Treasury Secretary Scott Bessent has indicated that $4 billion does not necessarily have to be the ceiling for government debt buybacks, after the Treasury doubled the size of some operations planned for the next quarter. The objective is to strengthen market liquidity and reduce yields that, according to Bessent, are detached from economic fundamentals.
At the same time, Bessent and White House Budget Director Russell Vought are preparing a fiscal consolidation strategy that contemplates savings of several hundred billion dollars through spending cuts and measures against waste, fraud and abuse. The message combines greater support for the debt market, fiscal discipline and growth expectations, a combination that could have implications for Treasury yields and, by extension, for the dollar.
From a technical perspective, the RSI has been recovering since August 3, moving towards the neutral zone, although it remains around 43%. This reflects an improvement in momentum, but still without enough strength to confirm a bullish acceleration.
The MACD has also reversed its trend. Both the MACD line and the signal line remain below the centre line, while the histogram remains positive, although weak. The signal points to a gradual recovery in momentum, but still without confirmation of a trend change.
The Point of Control (POC) is currently at 159.312, a key reference within the range. A consolidation above this level could strengthen the recovery and open the way towards higher levels, while a loss of this level would once again increase downside pressure.
The moving averages, however, remain in a bearish configuration, meaning that the underlying structure continues to be vulnerable. In this context, the evolution of the dollar and US Treasury yields will be particularly relevant for the yen: greater dollar strength could limit its recovery, while a depreciation of the greenback would favour further gains.
Overall, the yen is showing an improvement in momentum, but still without bullish confirmation. The POC at 159.312, the evolution of the dollar, Treasury yields and the ability of technical indicators to consolidate their recovery will be key in determining whether the move can extend towards 163.985.
*******************************************************************************************
The information provided does not constitute investment research. The material has not been prepared in accordance with the legal requirements designed to promote the independence of investment research and such should be considered a marketing communication.
All information has been prepared by ActivTrades ("AT"). The information does not contain a record of AT's prices, or an offer of or solicitation for a transaction in any financial instrument. No representation or warranty is given as to the accuracy or completeness of this information.
Any material provided does not have regard to the specific investment objective and financial situation of any person who may receive it. Past performance and forecasting are not a synonym of a reliable indicator of future performance. AT provides an execution-only service. Consequently, any person acting on the information provided does so at their own risk. Political risk is unpredictable. Central bank actions can vary. Platform tools do not guarantee success.
Moderna surges 177% after a historic milestone for mRNA techIon Jauregui – Analyst at ActivTrades
Moderna shares (NASDAQ: MRNA) posted their biggest gain in history, surging 177% in Wednesday’s session and closing at $174.38, after announcing positive Phase 3 results for its personalized cancer vaccine. The move represents a turning point both for the company and for messenger RNA (mRNA) technology, which is taking a decisive step beyond vaccines against infectious diseases.
From the $85.50 highs recorded in July, Moderna had entered a strong correction that took the stock to below $65, with a Point of Control (POC) around $46.35, where a large part of the trading volume during the decline was concentrated.
Yesterday’s session completely changed the technical picture. The stock opened with a huge bullish gap at $114.43, driven by the clinical announcement, and buying continued throughout the session until reaching an intraday high of $176.61, before closing slightly below at $174.38. The opening gap resulted in a virtually vertical breakout of all relevant resistance levels, accompanied by extraordinary volume and unprecedented volatility in the company.
The catalyst was the success of intismeran autogene, the personalized vaccine developed together with Merck. The treatment, designed based on the specific mutations of each patient’s tumor, demonstrated in Phase 3 a statistically significant reduction in the risk of melanoma recurrence and spread when administered alongside Keytruda.
Beyond the immediate impact on the share price, the market interprets these results as the first major commercial validation of the mRNA platform in oncology. If regulatory approval confirms these results, Moderna would move beyond relying primarily on its COVID-19 vaccine business and enter one of the biotechnology sector’s highest-growth-potential markets: personalized cancer treatments.
From a technical perspective, the huge bullish gap makes the area between $114 and $120 the first short-term support zone, while the continuation of the move will depend on the stock’s ability to consolidate this new range following a historic one-session rally.
*******************************************************************************************
The information provided does not constitute investment research. The material has not been prepared in accordance with the legal requirements designed to promote the independence of investment research and such should be considered a marketing communication.
All information has been prepared by ActivTrades ("AT"). The information does not contain a record of AT's prices, or an offer of or solicitation for a transaction in any financial instrument. No representation or warranty is given as to the accuracy or completeness of this information.
Any material provided does not have regard to the specific investment objective and financial situation of any person who may receive it. Past performance and forecasting are not a synonym of a reliable indicator of future performance. AT provides an execution-only service. Consequently, any person acting on the information provided does so at their own risk. Political risk is unpredictable. Central bank actions can vary. Platform tools do not guarantee success.
Gold Gains Momentum as the Dollar WeakensGold Gains Momentum as the Dollar Weakens and the Bond Market Seeks Stability
By Ion Jauregui – Analyst at ActivTrades
Gold advanced strongly in the previous session, reaching $4,521.89 per ounce, before beginning a correction during the early European hours and trading around $4,488. The move comes as the U.S. Treasury market attempts to stabilize following the Treasury intervention, amid pressure on yields and a weakening dollar.
The recovery in U.S. bonds has partially reduced yields, while the dollar has lost ground against other currencies. For gold, this combination is particularly relevant: lower yields reduce the opportunity cost of holding an asset that does not generate interest, while a weaker dollar supports its valuation in international terms.
From a technical perspective, gold appears to be recovering after finding support at the 100-session moving average. The price is now attempting to reclaim the 50-session moving average, following the corrective and sideways phase that developed between June and the first week of August.
The structure maintains the main support at $3,959.80, while the Point of Control (POC) from that phase is located at $4,078.26. Above the market, $4,600 is now the key level to confirm the continuation of the bullish move.
A sustained break above $4,600 could open the way toward $4,891, a resistance area associated with the previous head-and-shoulders structure. A break above this level would allow for a potential price-discovery scenario toward $5,000, with a subsequent target around $5,418.
The risk emerges if momentum loses strength and the price breaks below the moving-average area near $4,295, where the 200-session moving average is located. In that scenario, the probability of a correction toward the $4,078 equilibrium area would increase.
The behavior of the dollar and Treasuries will therefore be decisive. Rather than a formal devaluation of the USD, the market is pricing in a weakening of the currency associated with the evolution of yields, monetary-policy expectations and concerns over the U.S. fiscal position. As long as these variables continue to favor gold, the $4,600 level will be the main reference for determining whether the current rebound can develop into a new bullish phase.
*******************************************************************************************
The information provided does not constitute investment research. The material has not been prepared in accordance with the legal requirements designed to promote the independence of investment research and such should be considered a marketing communication.
All information has been prepared by ActivTrades ("AT"). The information does not contain a record of AT's prices, or an offer of or solicitation for a transaction in any financial instrument. No representation or warranty is given as to the accuracy or completeness of this information.
Any material provided does not have regard to the specific investment objective and financial situation of any person who may receive it. Past performance and forecasting are not a synonym of a reliable indicator of future performance. AT provides an execution-only service. Consequently, any person acting on the information provided does so at their own risk. Political risk is unpredictable. Central bank actions can vary. Platform tools do not guarantee success.
Coinbase&BTC Seek a New Boost as the SEC clarifies regulationCoinbase and Bitcoin Seek a New Boost as the SEC Opens the Door to Clearer Regulation
By Ion Jauregui – Analyst at ActivTrades
The SEC’s proposal to establish a new regulatory framework for crypto assets comes at a particularly relevant moment for Bitcoin and Coinbase, two assets that are going through a consolidation phase following the strong moves recorded since the end of 2025.
Coinbase closed the latest available session at $148.47, while Bitcoin remains around $64,000. The market is therefore receiving the new regulatory proposal from a still defensive technical position, although with signs of stabilization.
From a technical perspective, Coinbase (COIN) reached its highs in October 2025, at $401.89. Subsequently, the stock entered a medium-term sideways phase, approximately bounded between $166.46 on the upside and $139.08 on the downside. Currently, the moving averages have compressed around the support area, and the price is testing this area for the third consecutive time, increasing the technical importance of this level.
The current Point of Control (POC) is located around $166.11, making it the main reference level above the current price. A sustained recovery of this area could considerably improve the technical structure and open the door to an extension of the bullish move.
Bitcoin shows a similar configuration. From the highs of $126,245.01 reached in October 2025, BTCUSD developed two important accumulation zones between approximately $95,000 and $90,000. It subsequently staged a rebound that took the price from the lows of $57,693.79 to $82,816.04.
Bitcoin is currently trading close to its POC, located around $63,555.89, a particularly relevant area in determining whether the current consolidation can turn into a new recovery phase. The moving averages have also entered a compression process, with the upper part of the structure located around $66,897.09. A break above this reference would provide an initial technical signal of strength.
In this context, the SEC’s decision could act as a fundamental catalyst. The proposal includes exemption pathways for certain token offerings and a potential safe harbor for some crypto assets, reducing the regulatory uncertainty that has weighed on the sector.
For Coinbase, clearer regulation could be particularly relevant by reducing the legal risk associated with certain assets and facilitating the development of new products. For Bitcoin, the effect is more indirect, but a more predictable regulatory environment could encourage institutional participation and improve sentiment toward the crypto market as a whole.
Technically, however, the market still needs confirmation: $166.11 for Coinbase and $66,897 for Bitcoin are the reference levels that could determine whether we are looking at a simple consolidation or the beginning of a new bullish leg.
*******************************************************************************************
The information provided does not constitute investment research. The material has not been prepared in accordance with the legal requirements designed to promote the independence of investment research and such should be considered a marketing communication.
All information has been prepared by ActivTrades ("AT"). The information does not contain a record of AT's prices, or an offer of or solicitation for a transaction in any financial instrument. No representation or warranty is given as to the accuracy or completeness of this information.
Any material provided does not have regard to the specific investment objective and financial situation of any person who may receive it. Past performance and forecasting are not a synonym of a reliable indicator of future performance. AT provides an execution-only service. Consequently, any person acting on the information provided does so at their own risk. Political risk is unpredictable. Central bank actions can vary. Platform tools do not guarantee success.
Nasdaq: Nvidia and SpaceX Strengthen the Bet on AIBy Ion Jauregui – Analyst at ActivTrades
The Nasdaq is once again looking to artificial intelligence as one of its main drivers, but this time with a particularly interesting connection between Nvidia and SpaceX. Nvidia has revealed a stake of approximately $21 billion in SpaceX, while Elon Musk’s company continues to advance in the development of artificial intelligence infrastructure.
The transaction is relevant for the Nasdaq because SpaceX is already part of the Nasdaq-100, after joining the index in July. Its inclusion added a new component directly related to AI investment and increased the index’s exposure to Elon Musk’s technological strategy.
But the key element remains Nvidia. The company is not only one of the main beneficiaries of data center growth, but now also maintains direct financial exposure to SpaceX. In addition, SpaceX has indicated that it will use Nvidia technology for its AI data centers, creating a relationship that connects chip demand, infrastructure investment and stock market valuation.
Nasdaq Faces a New Test
After the correction that began at the end of July, the Nasdaq-100 has regained its bullish tone and is once again approaching the 30,782.32-point high zone. In the early hours of the European morning, the index was trading around 29,668 points.
Moving averages continue to support the trend that began in April. The MACD is once again showing a recovery in bullish momentum, while the RSI remains in neutral territory after moving out of the oversold conditions seen in previous weeks.
The Volume Profile shows a double-bell structure, with a first Point of Control around 24,841.75 points and a second volume concentration zone close to current prices. The key support level is located at 26,165.50 points.
As long as the Nasdaq manages to hold above this latest trading structure, the scenario remains constructive. A breakout above 30,782.32 points would represent a particularly relevant technical signal.
In this context, Nvidia and SpaceX represent more than just two technology companies within the index. The former provides the computing infrastructure, while the latter aims to expand that infrastructure into new models of data centers and AI. If this narrative continues to attract capital, the Nasdaq could once again test its highs with a new fundamental argument behind the move.
*******************************************************************************************
The information provided does not constitute investment research. The material has not been prepared in accordance with the legal requirements designed to promote the independence of investment research and such should be considered a marketing communication.
All information has been prepared by ActivTrades ("AT"). The information does not contain a record of AT's prices, or an offer of or solicitation for a transaction in any financial instrument. No representation or warranty is given as to the accuracy or completeness of this information.
Any material provided does not have regard to the specific investment objective and financial situation of any person who may receive it. Past performance and forecasting are not a synonym of a reliable indicator of future performance. AT provides an execution-only service. Consequently, any person acting on the information provided does so at their own risk. Political risk is unpredictable. Central bank actions can vary. Platform tools do not guarantee success.
U

Alibaba: Qwen strengthens its bet on artificial intelligenceBy Ion Jauregui, Analyst at ActivTrades
Alibaba is gaining prominence in the global race for artificial intelligence. Its Qwen family of models has surpassed 3 billion global downloads in six months, ahead of Google and Meta’s models. Alibaba also says it has published more than 460 Qwen models, with more than 300,000 derivatives developed by the community.
The open-model strategy allows developers to download, modify and adapt the technology, supporting rapid ecosystem expansion. For Alibaba, the next challenge will be to turn this adoption into revenue, Alibaba Cloud growth and higher margins.
The move also strengthens China’s position in the global AI competition, although the company remains exposed to strong international competition and U.S. restrictions on advanced technology.
Technical Analysis
Alibaba maintains a long-term sideways trend. After reaching $181.10 at the end of January, the stock began a correction that took it to $91.99 at the end of June. Since then, it has recovered part of the lost ground.
The moving averages continue to have a downward slope, while the RSI stands at 55%, after correcting from overbought levels. The MACD is losing momentum, with the histogram entering negative territory.
The Point of Control is at $123.39, while the volume profile shows two major trading zones. The first is between the recent lows and $150; the second, above this level, extends towards the January 2025 highs at $192.67.
A break above $150 would be the main technical signal of strength, with potential towards $181.10 and $192.67. Conversely, a rejection would keep the price within the sideways range and bring $123.39 back into focus.
Conclusion
Qwen provides Alibaba with an important fundamental catalyst, but the market will need to see its ability to turn adoption into profitable growth. The AI narrative is strong; technically, confirmation will come with a break above $150.
*******************************************************************************************
The information provided does not constitute investment research. The material has not been prepared in accordance with the legal requirements designed to promote the independence of investment research and such should be considered a marketing communication.
All information has been prepared by ActivTrades ("AT"). The information does not contain a record of AT's prices, or an offer of or solicitation for a transaction in any financial instrument. No representation or warranty is given as to the accuracy or completeness of this information.
Any material provided does not have regard to the specific investment objective and financial situation of any person who may receive it. Past performance and forecasting are not a synonym of a reliable indicator of future performance. AT provides an execution-only service. Consequently, any person acting on the information provided does so at their own risk. Political risk is unpredictable. Central bank actions can vary. Platform tools do not guarantee success.
Nvidia: AI Growth Remains Strong, but Financing Risk raisesNvidia: AI Growth Remains Strong, but Financing Risk Enters the Equation
By Ion Jauregui, Analyst at ActivTrades
Nvidia remains at the centre of the AI investment cycle, with financial results still showing exceptional growth. In its latest quarter, revenue reached $81.6 billion, up 85% year-on-year, while Data Center revenue rose 92% to $75.2 billion. Net income increased 211% to $58.3 billion, with a 74.9% gross margin. Operating cash flow reached $50.3 billion and free cash flow $48.6 billion. Nvidia also expects $91 billion in revenue for the next quarter.
These numbers continue to support the fundamental case. Nvidia is generating substantial cash while maintaining very high margins. However, the planned mobilisation of more than $500 billion of third-party capital for AI infrastructure introduces a different risk: whether the returns generated by the AI ecosystem will be sufficient to justify the enormous investment being financed.
If hyperscalers reduce capex or GPUs depreciate faster as new generations arrive, pressure could initially emerge in financing vehicles and private credit rather than directly on Nvidia’s balance sheet. Credit-risk pricing therefore becomes an important indicator alongside earnings growth.
Technical analysis
Nvidia closed at $225.12, with a high of $236.51, close to the May 14 high. The moving averages continue expanding upwards, maintaining the bullish structure.
$236.51 is the key resistance. A break above it would strengthen the continuation scenario and potentially open a new price-discovery phase.
The POC at $207.97 is the main intermediate reference. Below it, the $196-$190 zone remains the key support, having been tested three times.
Conclusion
The current fundamentals do not yet suggest that the AI investment cycle is losing momentum. Revenue growth, profitability and cash generation remain exceptionally strong. The bigger question is whether this level of growth can be sustained while the financial system increasingly supports the infrastructure required to maintain it.
For Nvidia, earnings remain the fundamental driver, while credit exposure is becoming the main risk variable. The combination of strong cash generation and a bullish technical structure keeps the medium-term outlook constructive, but the sustainability of AI capital expenditure will be critical for the next phase of the valuation.
*******************************************************************************************
The information provided does not constitute investment research. The material has not been prepared in accordance with the legal requirements designed to promote the independence of investment research and such should be considered a marketing communication.
All information has been prepared by ActivTrades ("AT"). The information does not contain a record of AT's prices, or an offer of or solicitation for a transaction in any financial instrument. No representation or warranty is given as to the accuracy or completeness of this information.
Any material provided does not have regard to the specific investment objective and financial situation of any person who may receive it. Past performance and forecasting are not a synonym of a reliable indicator of future performance. AT provides an execution-only service. Consequently, any person acting on the information provided does so at their own risk. Political risk is unpredictable. Central bank actions can vary. Platform tools do not guarantee success.
Tesla: Robot Fever Puts Expectations for Optimus to the TestBy Ion Jauregui – Analyst at ActivTrades
Strong demand recorded in the initial public offering of Unitree, a Chinese humanoid robot manufacturer, is once again putting the spotlight on Tesla and its bet on robotics. Unitree's IPO received retail demand more than 8,000 times the available supply, a sign of the high level of investor interest currently surrounding so-called physical artificial intelligence.
Unitree went public in Shanghai at 150.80 yuan per share, with a valuation of around 61 billion yuan, approximately $9 billion. The company is valued at around 219 times its 2025 earnings and 36 times its sales, multiples that reflect very high expectations for the future growth of robotics.
The move is also supporting the narrative around Tesla (NASDAQ: TSLA), whose Optimus project aims to turn humanoid robotics into a new business line. The company intends to use its expertise in artificial intelligence, manufacturing and autonomous systems to develop robots capable of performing repetitive tasks and interacting in industrial environments.
From a technical perspective, Tesla is attempting to consolidate a recovery after reaching a low of $297.36. The stock is currently trading around $333.30, still below the point of control (POC) at $401.285.
This level is the main reference for determining whether the recovery can develop into a broader bullish move. Above it, resistance levels are located at $432.665, $445.45 and $453.32, while the December high at $498.78 represents the main longer-term target.
Momentum indicators have improved. The MACD is recovering from its lows, with a positive and rising histogram, while the RSI has moved out of excessively oversold levels and currently stands at 44.77%. The indicator remains below 50, however, meaning that the recovery in buying momentum alone does not yet confirm a change in trend.
Unitree's performance shows that the market is willing to pay very high valuations for exposure to robotics. For Tesla, however, the challenge will be to turn expectations surrounding Optimus into production, revenue and profits.
The $401.285 area will be the first major test. Until then, Tesla's move should be interpreted as a technical recovery within a structure that still needs to overcome several resistance levels to confirm a new bullish leg.
*******************************************************************************************
The information provided does not constitute investment research. The material has not been prepared in accordance with the legal requirements designed to promote the independence of investment research and such should be considered a marketing communication.
All information has been prepared by ActivTrades ("AT"). The information does not contain a record of AT's prices, or an offer of or solicitation for a transaction in any financial instrument. No representation or warranty is given as to the accuracy or completeness of this information.
Any material provided does not have regard to the specific investment objective and financial situation of any person who may receive it. Past performance and forecasting are not a synonym of a reliable indicator of future performance. AT provides an execution-only service. Consequently, any person acting on the information provided does so at their own risk. Political risk is unpredictable. Central bank actions can vary. Platform tools do not guarantee success.
 Long
Long
Barrick: gold recovers, but the miner faces uncertainty Barrick: gold recovers, but the miner faces uncertainty over its North American IPO
By Ion Jauregui – Analyst at ActivTrades
Barrick Mining is back in investors’ focus as it moves forward with its plan to list a minority stake in its North American gold assets. The company plans to place between 10% and 15% of the business, an operation that could be completed before the end of 2026 and would include stakes in Nevada Gold Mines, Pueblo Viejo and Fourmile. The agreement recently reached with Newmont, which includes a payment of $1.95 billion to Barrick, has cleared the way for the operation.
The move comes at a particularly favourable time for gold. The metal is rebounding to $4,408.34 per ounce during the early hours of the European session, keeping the range between $4,600 and $3,882 intact. The Point of Control stands at $4,025.95, a reference that remains relevant as the price consolidates.
Ticker Analysis: GOLD
From a technical perspective, the underlying bearish structure is beginning to lose strength. The 50-session moving average remains below the 200-session moving average, but the 100-session moving average has already moved above the 200-session moving average, while the MACD continues to recover and maintains a positive histogram. The RSI stands at 67.60%, approaching overbought levels.
If gold manages to break strongly above the current zone, the next price targets are $4,773.77 and $4,891.40. Conversely, a loss of momentum could send the metal back towards the POC at $4,025.95.
This environment directly benefits producers. Barrick reported net income of $1.22 billion in the second quarter, compared with $811 million a year earlier, driven by the strong price of gold. However, the stock fell by around 8% after the results were released, due to rising costs: the cost of gold sales increased by 20% to $1,993 per ounce, while total All-In Sustaining Costs (AISC) rose 11% to $1,866.
The reaction is particularly significant. While gold remains near $4,400, Barrick is trading at around $40 per share, compared with a 52-week high of $54.69. The market appears to be signalling that a high gold price does not eliminate the company-specific risks.
The upcoming IPO adds another variable. For Barrick, separating a stake in its North American assets could allow it to unlock value and raise capital, but some investors are questioning the decision to sell part of particularly attractive assets precisely when gold is trading at historically high levels. The transaction will also, albeit partially, reduce current shareholders’ direct exposure to these assets.
The key for Barrick now will be to demonstrate that the restructuring can create value without sacrificing the potential of its best assets. Meanwhile, the evolution of gold will remain the main catalyst: a break above $4,600 would reinforce the bullish scenario for the sector, while a return towards $4,025.95 could once again shift the focus towards costs and the valuation of mining companies.
*******************************************************************************************
The information provided does not constitute investment research. The material has not been prepared in accordance with the legal requirements designed to promote the independence of investment research and such should be considered a marketing communication.
All information has been prepared by ActivTrades ("AT"). The information does not contain a record of AT's prices, or an offer of or solicitation for a transaction in any financial instrument. No representation or warranty is given as to the accuracy or completeness of this information.
Any material provided does not have regard to the specific investment objective and financial situation of any person who may receive it. Past performance and forecasting are not a synonym of a reliable indicator of future performance. AT provides an execution-only service. Consequently, any person acting on the information provided does so at their own risk. Political risk is unpredictable. Central bank actions can vary. Platform tools do not guarantee success.
Indra: the IRIS² contract reinforces its growth at highsBy Ion Jauregui – ActivTrades Analyst
Indra is back in investors’ focus after Hispasat secured the main contract for the ground networks of the European IRIS² programme, valued at more than €1.6 billion. The award strengthens the group’s exposure to the space business and adds visibility to an order book that is already at exceptional levels.
Indra closed the first half of 2026 with €3.179 billion in revenue, up 29.7% year-on-year, while EBITDA reached €456 million, up 72%. Net profit stood at €219 million.
The order book reached €20.533 billion, representing growth of 117% compared with the same period last year. This development provides high visibility for the coming years, although it also shifts the focus towards execution capacity: converting the contracted volume into revenue, profitability and cash generation.
Space gains prominence in the strategy
The IRIS² operation fits with Indra’s growing exposure to defence, space and strategic technology. Increased European defence spending and the pursuit of greater technological autonomy are creating opportunities in sectors where communications, surveillance and space-system capabilities are becoming increasingly important.
For Hispasat and Indra, the contract strengthens their position within this value chain. For investors, the main attraction lies in the possibility that this activity could help diversify and expand the company’s sources of growth over the coming years.
The challenge will be maintaining profitability as the size of projects and the order book increases.
Technical analysis maintains a bullish bias
From a technical perspective, the long-term trend remains bullish. The share price currently stands at €64.90, very close to the March high of €66.16.
The behaviour of the channel is also relevant. At the end of July, the price structure narrowed, but during August the channel has once again expanded, indicating that the trading range is increasing again in the direction of the prevailing trend.
The main resistance is therefore concentrated at €66.16. A breakout and consolidation above this level would allow the stock to surpass its March high and enter a new phase of price discovery.
However, the indicators call for some caution. The RSI stands at 76.30, reflecting a high level of overbought conditions. The MACD maintains a positive configuration, with the moving average and signal line above the histogram and a favourable structure that has remained in place for approximately one and a half months. This confirms the strength of the momentum, although it also indicates that the move has already covered considerable ground.
In the event of a correction, the market could find intermediate reference levels before reaching structurally significant areas. The Point of Control (POC) of the price distribution stands at €48.94, an area that concentrates significant traded volume and represents a much more distant, but meaningful, reference for assessing the medium- and long-term structure.
Conclusion
The combination of operational growth, an order book of more than €20.5 billion and greater exposure to defence and space maintains a positive fundamental outlook for Indra. The IRIS² contract reinforces this trajectory and adds visibility to a business considered strategic for Europe.
In the stock market, the underlying trend remains bullish, but the proximity to the €66.16 high places the share at a decisive level. Breaking above this level would confirm the strength of the move and could open the door to new highs.
The elevated overbought conditions, with an RSI of 76.30, suggest that strength should not be confused with an absence of risk: a consolidation would remain compatible with the prevailing trend as long as the price maintains its bullish structure.
Ultimately, Indra is approaching its highs with solid fundamentals and positive momentum, but it needs to convert the current buying pressure into a breakout above €66.16 to initiate a new bullish phase.
*******************************************************************************************
The information provided does not constitute investment research. The material has not been prepared in accordance with the legal requirements designed to promote the independence of investment research and such should be considered a marketing communication.
All information has been prepared by ActivTrades ("AT"). The information does not contain a record of AT's prices, or an offer of or solicitation for a transaction in any financial instrument. No representation or warranty is given as to the accuracy or completeness of this information.
Any material provided does not have regard to the specific investment objective and financial situation of any person who may receive it. Past performance and forecasting are not a synonym of a reliable indicator of future performance. AT provides an execution-only service. Consequently, any person acting on the information provided does so at their own risk. Political risk is unpredictable. Central bank actions can vary. Platform tools do not guarantee success.