BTC Elliott Wave Points Towards a Potential ABC Correction Bitcoin's recent price action appears to show the completion of a five-wave impulsive Elliott Wave structure, followed by a corrective move towards the Point of Control (POC), where price has recently found some buying interest and attempted to bounce.
This structure raises the possibility that Bitcoin is currently developing an ABC correction within a broader higher-timeframe range, bounded by key resistance and support levels. Under Elliott Wave theory, an impulsive move typically consists of
CoinJar publications
Ethereum Daily Analysis: $1,950 Support in FocusEthereum is currently trading below the EMA ribbon and the value area high of its current trading range, suggesting that price action is showing signs of weakness. The presence of a single print in the current price structure also leaves open the possibility of further downside in the immediate short term as the market potentially moves to address this inefficiency.
An area to monitor is the $1,950 support region, where the 0.618 Fibonacci retracement aligns with the point of control. This conf
Bitcoin Daily Analysis: Key Support Determines the Next MoveBitcoin is currently testing a higher-timeframe support region that aligns with the 0.618 Fibonacci retracement, making this an area to monitor for potential price direction.
If buyers manage to defend this support, a rotational move towards the higher-timeframe resistance marked on the chart could develop. Such a move would suggest that Bitcoin remains within its current trading range rather than establishing a confirmed breakout. A successful bounce would also help preserve the existing bulli
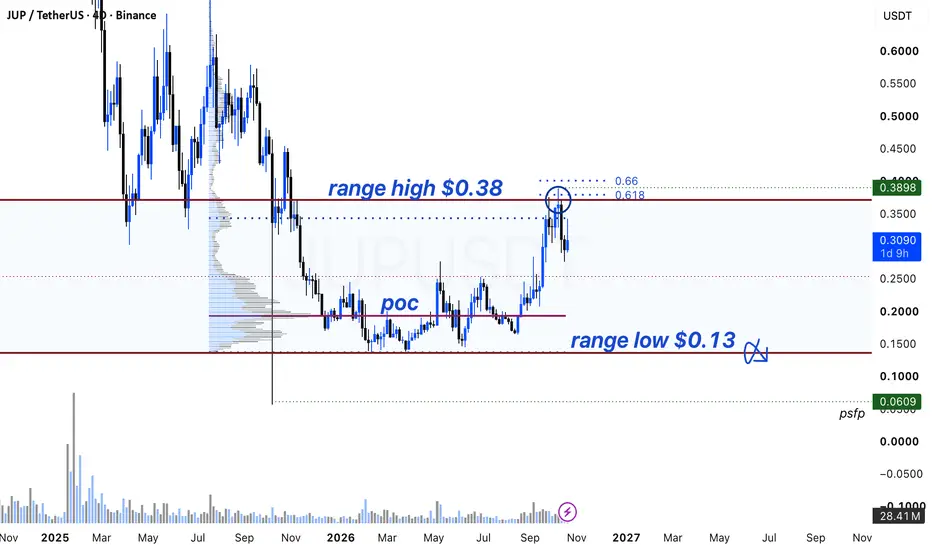
Jupiter(JUP) Range High Rejection and Potential RotationJupiter (JUP) price action has rejected from the range high resistance around $0.38, an area that aligns with the 0.618 Fibonacci retracement and the Value Area High (VAH). This confluence represents a key resistance zone where sellers have stepped in, potentially opening the possibility of a rotation towards the range low near $0.13 if the rejection continues.
If price remains below the range high, JUP could continue trading rotationally between these boundaries, with the range low acting as a
PUMP Token: Value Area High Rejection and Key Support LevelsPUMP price action has recently rejected from the Value Area High (VAH), which aligns with the 0.618 Fibonacci retracement level. This confluence represents an area of technical resistance where selling pressure has emerged, potentially opening the door to a corrective move if sellers maintain control.
If the rejection continues, price could move towards the dynamic support zone below, where multiple technical confluences may provide an area of interest for buyers. This region will be important
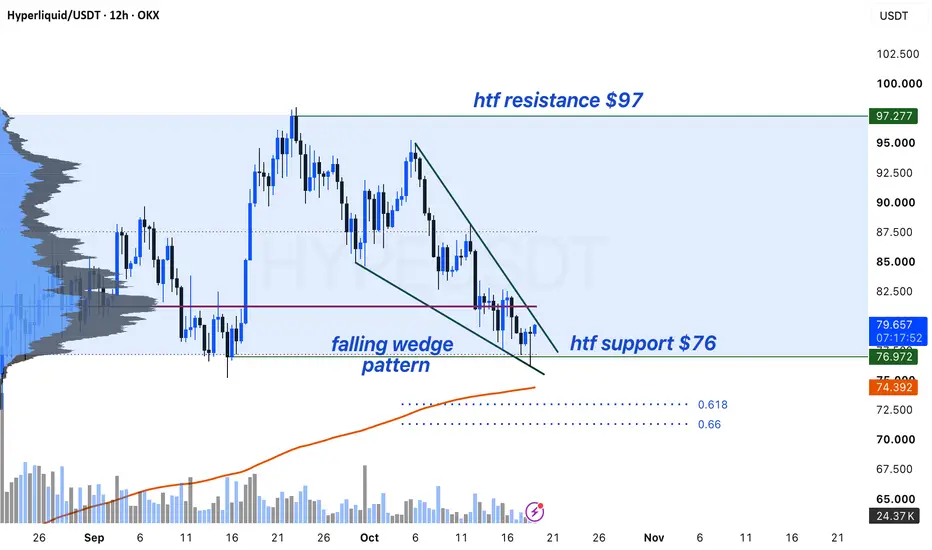
Hyperliquid | $76 Support Confluence and Falling Wedge Pattern Hyperliquid is trading around a key support region at $76, where several technical factors converge. These include the base of a falling wedge pattern, the value area low, and the 200-day simple moving average (SMA). This confluence makes the region key for monitoring whether buyers can defend support and establish the conditions for a recovery.
If price holds above $76 and buying pressure strengthens, Hyperliquid may attempt to break out of the falling wedge structure. A confirmed breakout, id
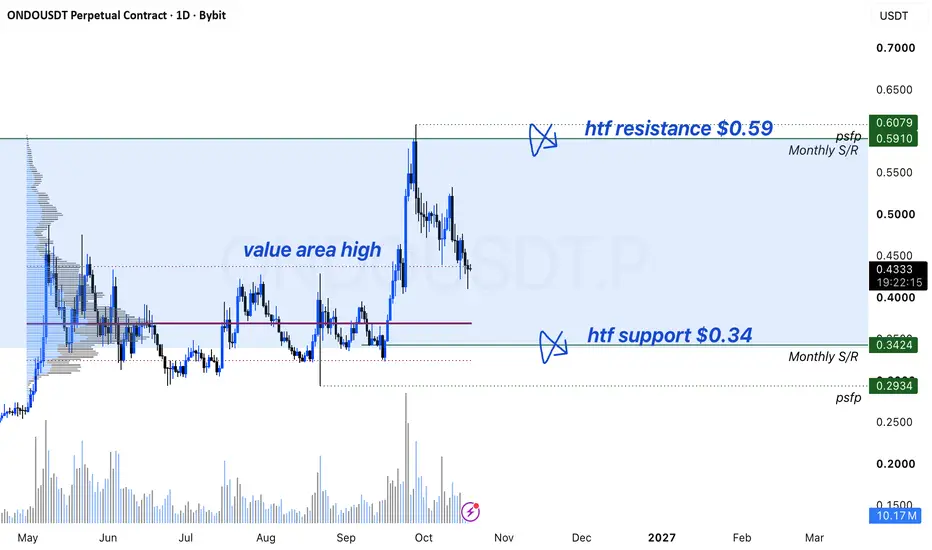
ONDO Price | Key Range Support and ResistanceONDO price action continues to trade within a broader high-timeframe range, with support established around $0.34 and resistance situated near $0.59. These two levels define the current trading structure and provide reference points for assessing potential continuation, corrective movement, and a possible change in market direction.
In the immediate term, price action is testing the value area high, making this a key region to monitor. If ONDO maintains acceptance above this level, price may co
Ethereum: Rising Channel Keeps $3,000 in FocusEthereum price action continues to trade within a local ascending channel, maintaining a sequence of higher lows as buyers defend key support. The channel's lower boundary, situated around $2,400, remains an important technical level, with recent price action respecting this region and preserving the current upward structure.
As long as ETH holds above this support, the probability of continued movement towards the $3,000 resistance area remains in play. This level represents the next upside re
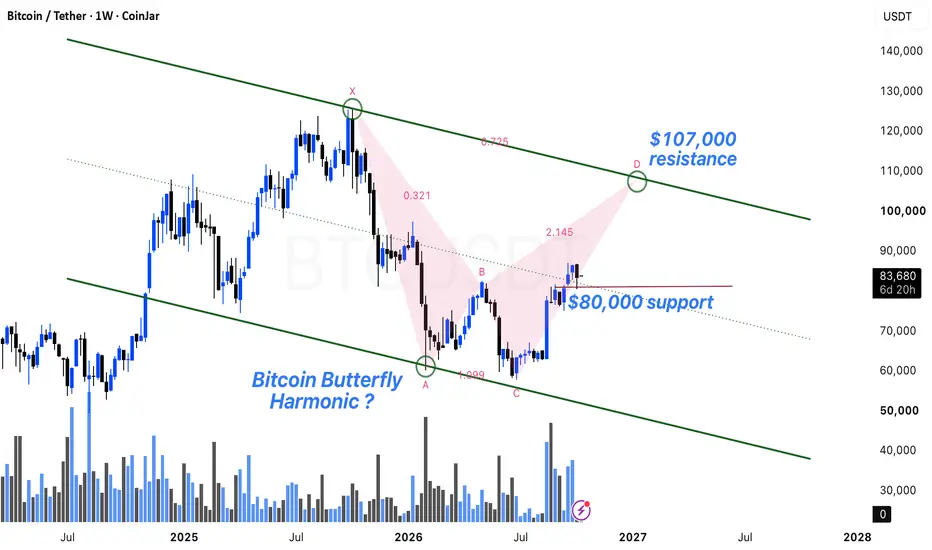
Bitcoin Butterfly Harmonic Pattern Forming ? Bitcoin price action is potentially forming a butterfly harmonic pattern, a five-point XABCD structure that identifies a possible reversal zone based on Fibonacci relationships. The pattern's completion area currently aligns with the higher-time-frame channel resistance ($107,000), creating an important confluence to monitor as price approaches a potential turning point.
For the bullish scenario to remain technically valid, Bitcoin needs to maintain the local support region around $80,000. If t
Pump Price Continues to Trade in a Trading ChannelPUMP price action has recently rejected from the upper boundary of its established trading channel, creating the potential for a rotation back toward channel support. This support region also aligns with the 0.618 Fibonacci retracement, giving the area additional technical confluence and making the reaction there important for the broader structure.
If price retests this confluence zone and manages to hold above it, the existing channel structure would remain intact. A sustained reaction from s
DOT Price Action Re-Accumulation ? DOT price action is currently trading above a high-timeframe support region around $1.10. This level has recently acted as an important area of demand, with price showing a reaction after testing the region. If DOT is able to maintain acceptance above this support over the coming weeks, it could provide the conditions for a period of re-accumulation before another potential expansion.
The current structure remains dependent on how price behaves around $1.10. Holding above the level would keep t
PEPE Channel Support Retest ApproachesPEPE price action continues to trade within a well-defined larger trading channel, with price recently rejecting from the upper boundary and now rotating back toward a key support confluence zone.
If price is able to hold above this support region, the current channel structure remains intact, increasing the probability of further rotational price action. A sustained reaction from support could allow price to move back toward the channel midpoint before potentially challenging the upper boundar
Dogecoin: Key Resistance and Support Levels to WatchDogecoin price action has been advancing through a series of bullish impulses, although the market is currently experiencing a corrective phase following rejection from daily resistance around $0.14. This level remains important, as price has yet to establish a sustained break above it.
As long as DOGE remains below the $0.14 resistance area, there is a possibility of further corrective movement towards the daily support region. A retracement into this area would not necessarily invalidate the
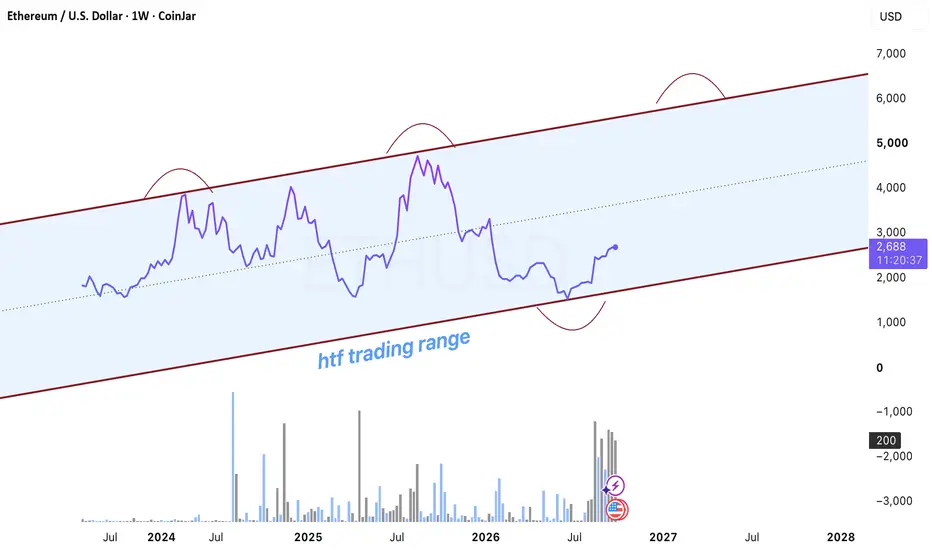
Ethereum: Multi-Year Range Structure Remains IntactEthereum price action continues to trade within a broader multi-year range, with price recently respecting the lower support region of this structure. From a higher time frame perspective, this keeps the overall range intact and suggests that the market remains rotational rather than clearly trending in either direction.
As long as Ethereum continues to hold the established support area, there is a probability that price could spend additional time consolidating and building within the range. E
Bitcoin Price Remains Above EMA Ribbon Bitcoin price action continues to trade above the EMA ribbon, while price has also reclaimed the higher time frame channel as support. This structure keeps the broader technical outlook constructive, although confirmation remains important before assuming further upside.
As long as price remains above the current bullish EMA ribbon and continues to hold the reclaimed channel support, the probability of a move towards the $94,000 resistance area increases. This level may act as an important test
NEAR Price Potential Range Bound Scenario NEAR price action is currently trading at a resistance zone around $5.90, making this an important area to monitor for the next potential directional move. If price corrects from this region, it could rotate back towards the $3.07 support level, where the reaction from buyers may provide further insight into the broader market structure.
If NEAR moves towards $3.07 and successfully holds this support, price could remain range-bound between the established support and resistance zones. Continued
Solana Price Trades Above Key Support Solana price action is currently trading above a key higher-time-frame support level around $99, making this region an important area for the broader structure. A retest of this support could provide a clearer indication of whether buyers are willing to defend the level and maintain the current range structure.
If price retests $99 and holds, the market could remain rotational, with the $200 area becoming a potential higher-time-frame resistance target. However, this scenario remains conditiona
XRP Price Action to Remain Range Bound ? XRP price action has been correcting from higher-time-frame resistance around $1.56, keeping the broader structure within a defined range. The current point of control sits around the midpoint of this range and is acting as an important area of support. Holding this region may allow price to remain rotational within the established range, while a sustained loss of support would increase the possibility of a deeper corrective move towards the $1.28 area.
From a technical perspective, XRP remains
Bitcoin: Bull Flag Retest at a Key Decision ZoneBitcoin price action is currently retesting the breakout region of the bull flag formation we have been monitoring over the past several weeks. Price previously broke above this structure, shifting the short-term market bias toward the upside, but the current pullback is now testing whether that breakout can hold as genuine support.
If BTC can maintain this region and establish a bullish retest, it would strengthen the probability of continuation higher. A successful hold could create the found
Silver: 0.618 Fibonacci Retest at Key Channel SupportSilver price action has retraced into a key technical area, with the 0.618 Fibonacci retracement aligning closely with the lower boundary of the current price channel. This creates a notable confluence zone where the market could determine its next directional move.
If price is able to maintain this region as support, the current retracement could develop into a potential bullish reaction. A sustained hold, particularly if accompanied by improving momentum and buying pressure, would increase th
Ethereum: High-Timeframe Resistance in FocusEthereum price action has rallied into a high-timeframe resistance region around $2,800, making this an important area for assessing the next phase of the current market structure.
If ETH is unable to reclaim and sustain above this resistance, price could remain within its broader rotational structure, with a potential move back toward the $2,390 region. Such a move would represent continued range-bound price action rather than necessarily signalling a change in the broader trend.
On the downs
Sonic Price Key Levels To Watch, Continuation ?Sonic token has formed a complex inverse head-and-shoulders structure, with price currently showing signs of a potential upside breakout. However, the market is also reacting from point-of-control resistance, meaning further confirmation may be needed before the pattern can be considered fully established.
A possible scenario is a retest of the neckline after the initial reaction. The $0.03 area is therefore an important level to monitor. If price can hold above this neckline resistance and est
Litecoin: Resistance Reclaim and Deviation Litecoin price action has recently reclaimed a key resistance level around $47.30, which is now acting as an important support area. This shift in market structure is worth monitoring because maintaining price above this region could support the possibility that the recent move below the previous range was a deviation rather than a sustained breakdown.
As long as Litecoin continues to hold above $47.30, attention can remain focused on the next significant resistance around $110. However, reachi
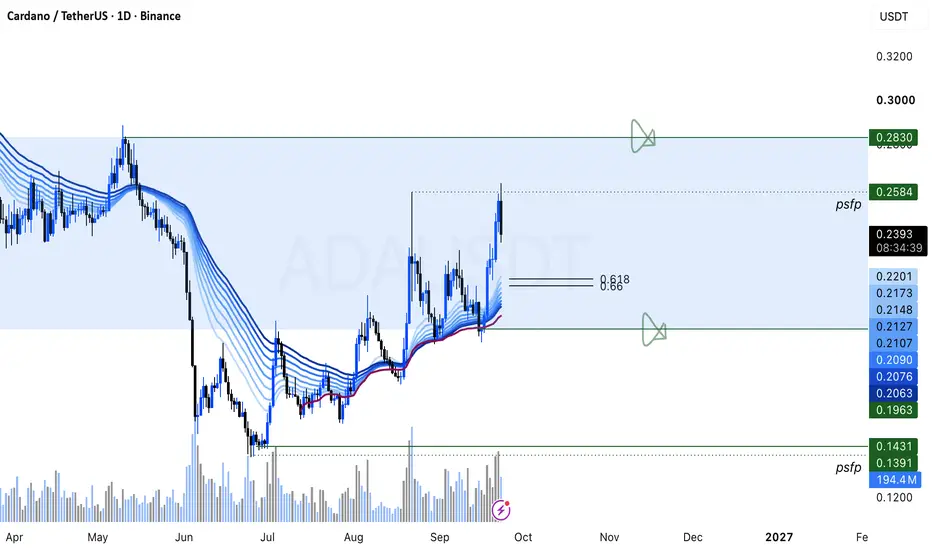
ADA: Higher-Timeframe Trend and Key LevelsADA price action continues to form a sequence of higher highs and higher lows, which remains consistent with a broader bullish market structure. However, price is currently trading at a location where a corrective move could develop, particularly after the recent expansion.
A potential pullback toward the EMA ribbon would provide an important area to monitor. If the ribbon continues to act as dynamic support and price establishes another higher low, it could help maintain the existing bullish s