USD/JPY targeting higher levels despite intervention risksIt would be remiss of me not to shine some of the limelight on USD/JPY right now – a pair that has been propelled to highs north of ¥163 in recent trading (levels not seen since 1986). Bolstered by rising yields and USD strength, the unit is well and truly within intervention territory right now; verbal intervention from Japan’s finance minister has clearly had limited effect.
From a technical perspective, USD/JPY bulls are likely to remain in the driving seat, with scope for further outperformance to resistance just south of ¥164. This level has historical significance dating back to mid-1986. Consequently, while intervention risks remain elevated, buyers could continue to push this market higher.
Written by FP Markets Chief Market Analyst Aaron Hill
FP Markets publications
ASX 200 eyeing a pattern breakoutWe have some interesting price action brewing on the ASX 200.
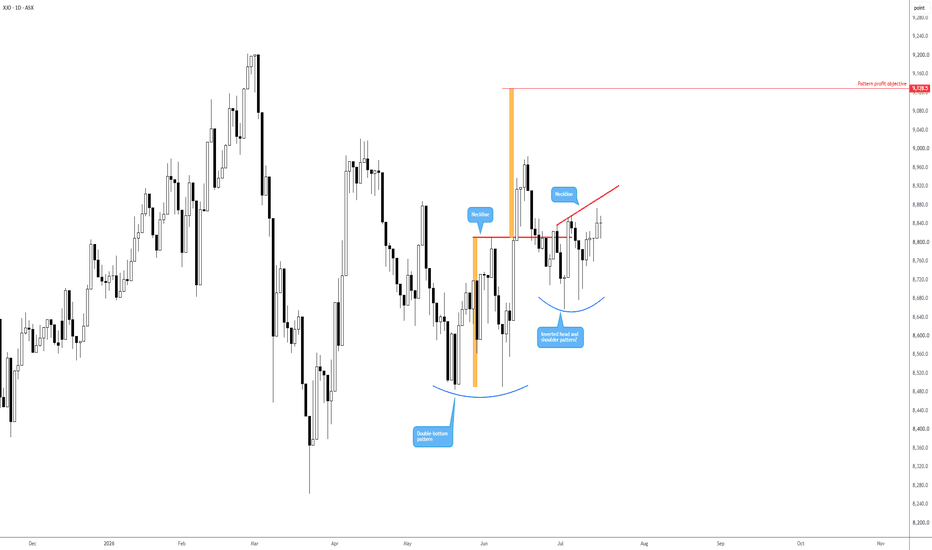
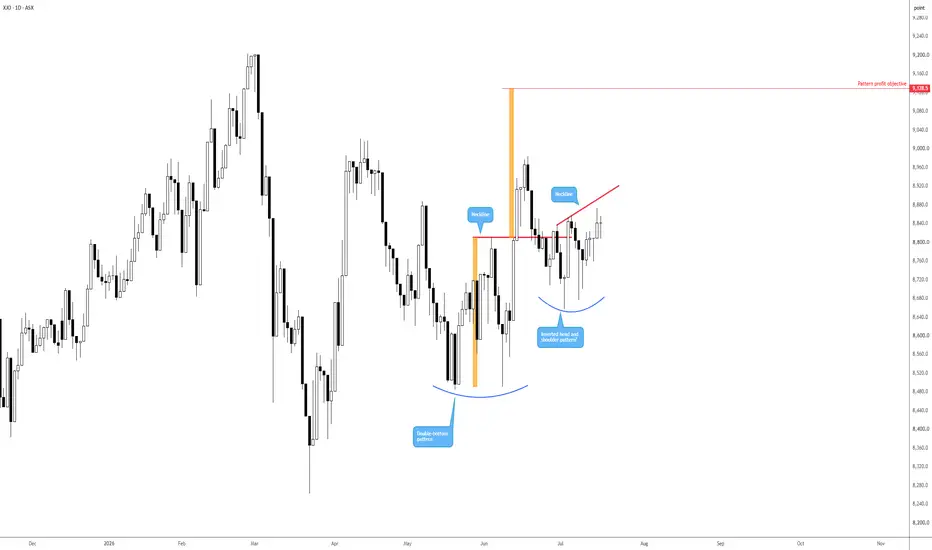
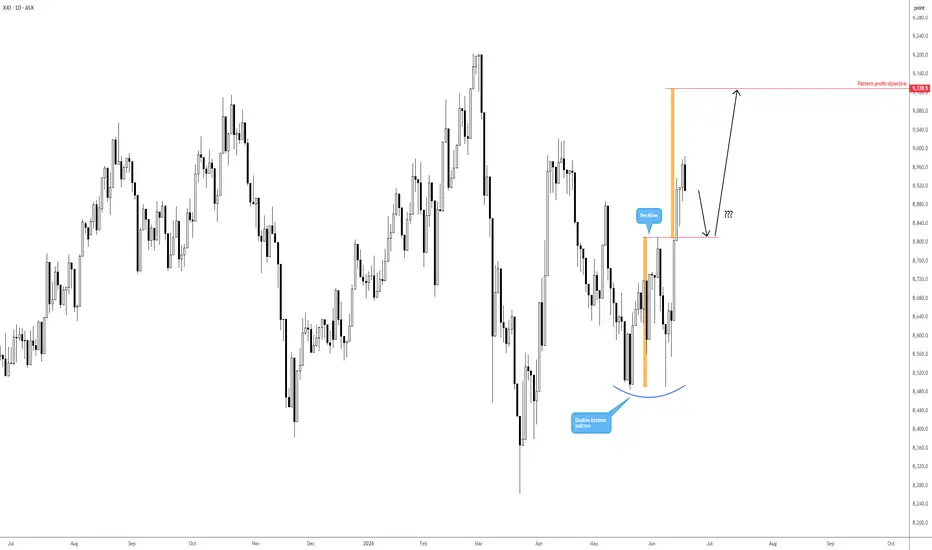
Although a pullback from 8,983 occurred following the break of a double-bottom pattern’s neckline at 8,811, price is beginning to find a footing without breaching the pattern’s lows of around 8,485. The pattern’s profit objective is still calling for attention at 9,128.
Additionally, you may acknowledge the potential inverted head-and-shoulders pattern now forming, with the neckline at 8,900. A break above here may help reaffirm bullish intent from the double-bottom formation, targeting the said profit objective of 9,128.
Written by FP Markets Chief Market Analyst Aaron Hill
Brent crude about ready to burst?With Middle East flare-ups still front and centre and geopolitical risk premium being priced into oil, the technical picture on Brent crude right now shows a potential breakout brewing.
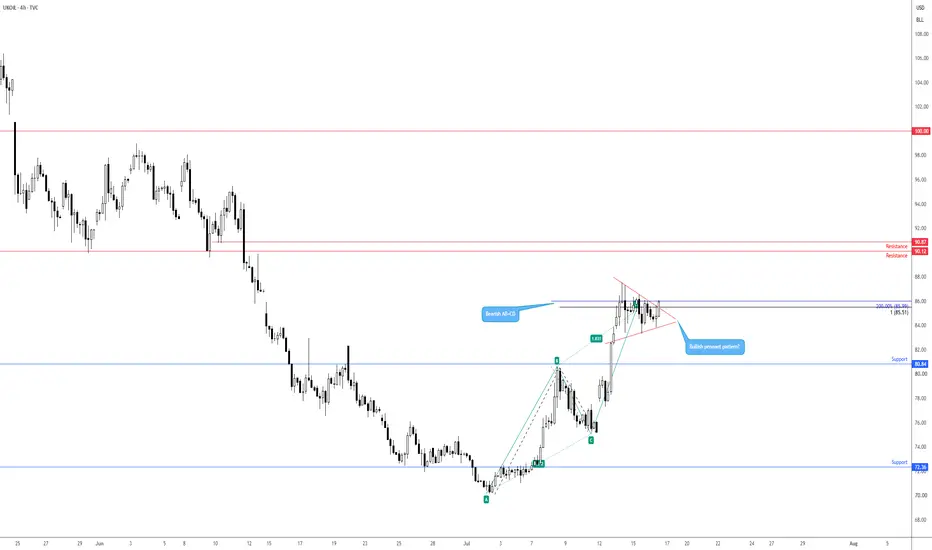
As shown in the chart, between US$87.55 and US$83.32, we have seen price build out a pennant pattern, with the unit not far from the formation’s apex and looking about ready to burst. Price is now on the verge of breaking out higher, perhaps clearing the path for a run towards a resistance zone between US$90.87 and US$90.12.
I do want to note that while the pennant formation is considered a bullish continuation pattern, we also have a bearish AB=CD configuration around US$85.50. However, sellers have been reluctant to commit here so far, adding weight to a breakout north.
Written by FP Markets Chief Market Analyst Aaron Hill
S&P 500 testing upper boundary of a bullish pennantSince the S&P 500 clocked a fresh record high of 7,620 at the beginning of June – and a low of 7,237 – price has been compressing between two converging lines, forming a potential bullish pennant pattern.
You will note that the index recently breached the upper boundary of said pattern, but has since modestly pulled back and found support ahead of the 50-day SMA at 7,417. This – coupled with the clear-cut uptrend and yesterday’s hammer candle pattern – may eventually be enough to tempt a higher breakout.
Written by FP Markets Chief Market Analyst Aaron Hill
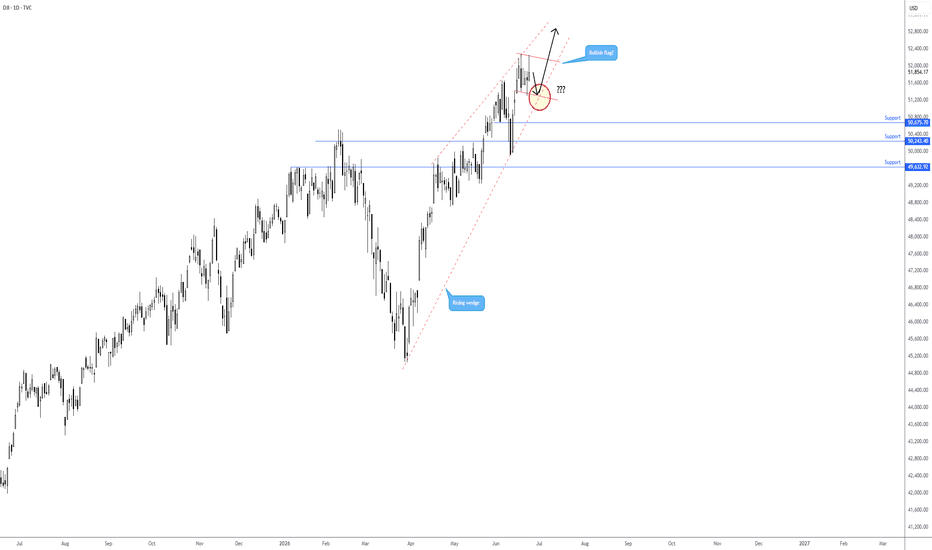
Dow Jones eyeing bull flag/support confluencePrice action on the Dow Jones Industrial Average is in the process of chalking up a potential bullish flag between the all-time high of 52,286 and 51,398. You will also note that the index is forming a rising wedge pattern between 45,057 and 49,717.
While the noted patterns offer conflicting signals, the fact that the lower edge of the rising wedge merges with the lower boundary of the bullish flag pattern, and that this market is entrenched within a strong uptrend, suggests that a rebound from the merge point (red circle) could be something dip buyers watch for.
Written by FP Markets Chief Market Analyst Aaron Hill
USD index gearing up to breakout higher?Fed-tightening expectations and safe-haven demand have underpinned the USD so far this month, pushing the USD index up by 2.8%.
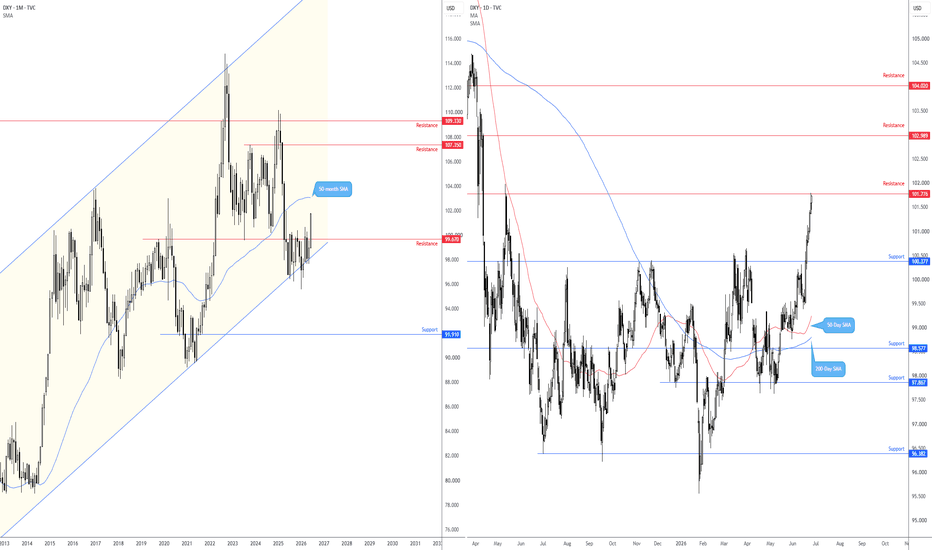
As shown in the charts below, monthly price action suggests scope for further outperformance as buyers strengthen their grip above resistance at 99.67. The 50-month SMA at 103.03 calls for attention overhead, with a break above this level unearthing resistance at 107.35. Meanwhile, on the daily chart, price recently touched gloves with resistance at 101.78. Interestingly, breaching this resistance could open the door to another layer of resistance at 102.99, a base set just south of the 50-month SMA mentioned above.
So, we have room to push higher on the monthly, and a break of daily resistance at 101.78 could trigger breakout buyers.
Written by FP Markets Chief Market Analyst Aaron Hill
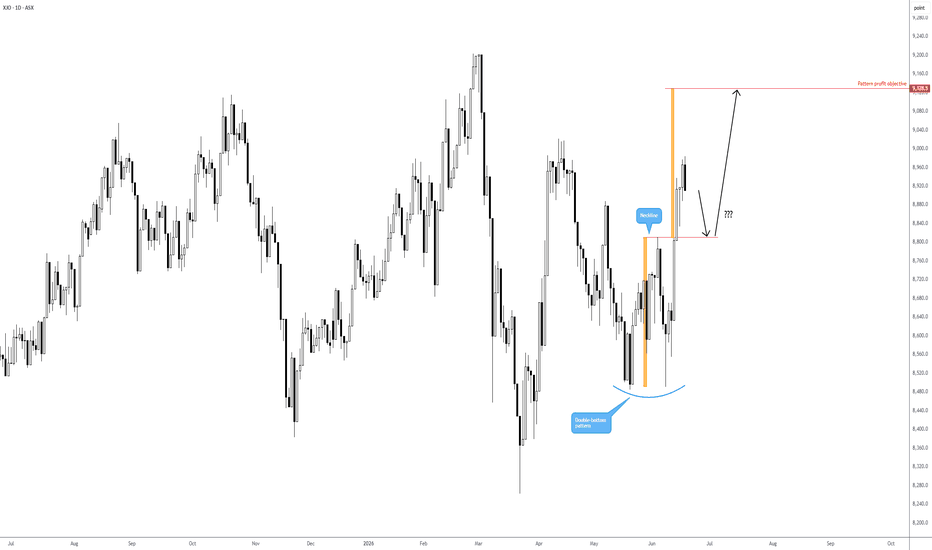
ASX 200 double-bottom pattern in playThe ASX 200 pencilled in a double-bottom pattern at 8,485 in early June, where price recently crossed above the formation’s neckline at 8,810. With Thursday's session closing in the red and snapping a four-day winning streak, this could open the door for a retest of the neckline (as support) to perhaps target the pattern’s profit objective at 9,128 – a base set just south of the index’s all-time high at 9,202.
Written by FP Markets Chief Market Analyst Aaron Hill
GBP/USD shaking hands with key support
The GBP has been considerably under pressure this week, following softer-than-expected CPI inflation, and while headline job numbers came in stronger today, falling private payrolls and slowing wage growth will give the BoE some confidence to remain on hold. Markets are still pricing around 30 bps of BoE tightening by year-end.
From a technical standpoint, you can see GBP/USD is on the doorstep of support between US$1.3205 (1M) and US$1.3246 (1Y). For me, this area is considered a strong base, so if this is engulfed on the back of recent sentiment, it tells me that the pair could close in quickly on the March lows of US$1.3159 and perhaps support between US$1.3112 (3M) and US$1.3129 (1M).
Written by FP Markets Chief Market Analyst Aaron Hill
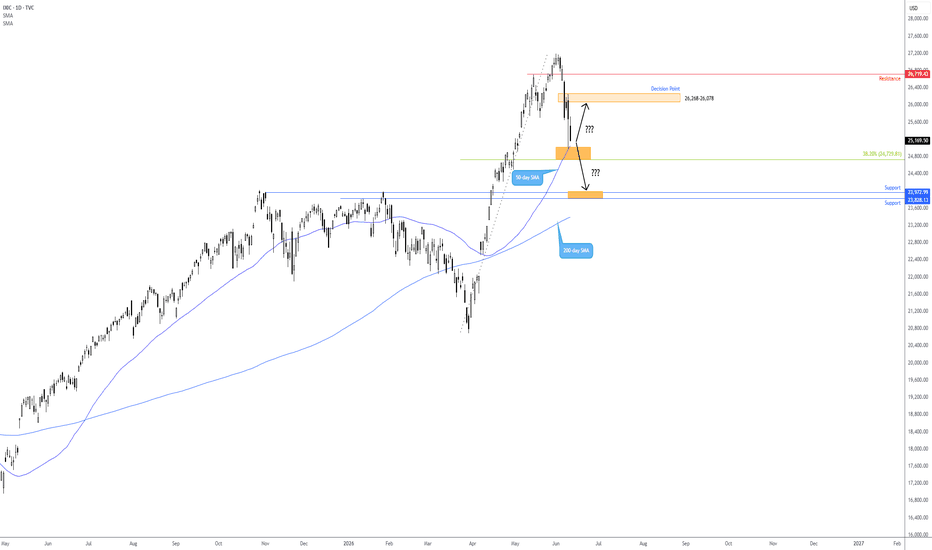
Path of least resistance remains to the upsideDown nearly 8% from record highs of 27,190, the Nasdaq Composite recently shook hands with the 50-day SMA at 25,045, a dynamic value that is closely bolstered by a 38.2% Fibonacci retracement at 24,729.
The nearby decision point area is seen overhead at 26,268-26,078, with a break above this area paving the way for a run to resistance at 26,719. To the downside, beyond current support, opens the door to another layer of support at 23,828 and 23,972.
Ultimately, with the trend still very much alive in this market, the path of least resistance is to the upside. Therefore, traders may attempt to buy the dip from current price levels, with some pyramiding on a breakout above 26,268-26,078.
Written by FP Markets Chief Market Analyst Aaron Hill
USD/JPY shows weak bullish momentum within intervention zoneAlthough implied volatility remains low for USD/JPY, the currency pair recently moved above key resistance at ¥160.23. The area between this level (which I now consider support) and resistance at ¥161.67 is closely watched by markets for possible intervention.
While the breakout above ¥160.23 technically opens the door to targeting ¥161.67, traders will likely be cautious at current levels amid intervention threats. Notably, on the H1 timeframe, a clear-cut rising wedge formed between ¥160.05 and ¥160.44, and price recently broke below the lower boundary, which signals a lack of buying in this market right now.
Written by FP Markets Chief Market Analyst Aaron Hill
BTC/USD bears in the driving seat
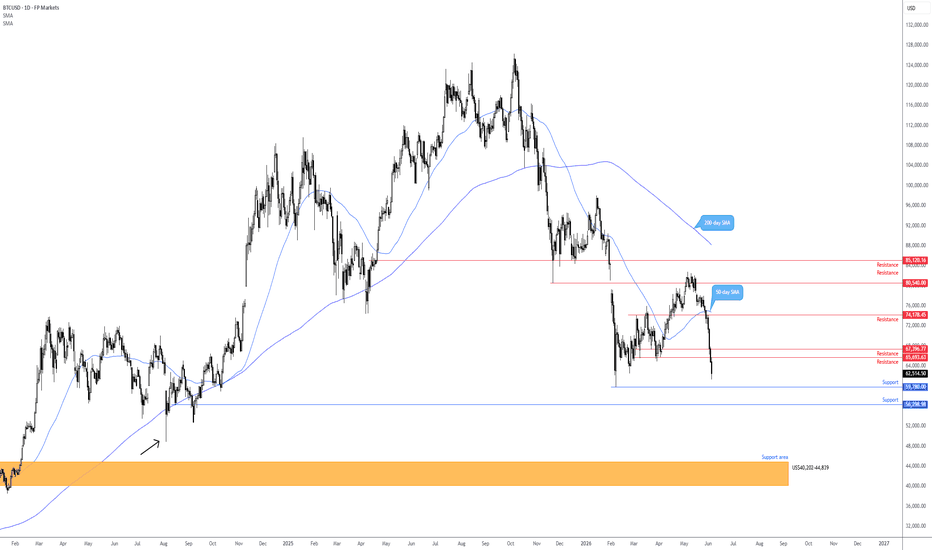
Against the USD, BTC has been under pressure since the end of May and is rapidly approaching the YTD lows of US$59,780. It has essentially been a one-sided move lower after BTC/USD crossed beneath US$74,705: the 50-day SMA.
Resistance is positioned nearby between US$67,396 and US$65,693, with a break below US$59,780 paving the way lower to support at US$56,298. My view of this market remains unchanged; if we push south of this support, we should expect further downside. Stops below the US$48,807 low established in August 2024 (black arrow) would likely provide enough liquidity (sell stops from those long the market and breakout sellers) for buyers to fade and buy from the support area as far south as US$40,202-44,839.
Written by FP Markets Chief Market Analyst Aaron Hill
USD/JPY circling the intervention zone
While implied volatility remains low for USD/JPY, the pair is on the doorstep of ¥160 – an area that markets are monitoring closely for possible intervention from Japan’s MoF.
Technically, ¥160.23 is a resistance on my watchlist, which, as you can see, withstood two upside attempts in March and April this year. Of note, the latest move lower – albeit it managed to print a fresh low – was swiftly halted after brushing up against familiar multi-month trendline support, extended from the low of ¥139.89.
Markets are tentatively approaching ¥160.23, with a breakout above this level potentially targeting the ¥161.95 high from July 2024. However, a move higher is likely to be met with uncertainty; therefore, it is worth pencilling in the possibility of a bull trap forming between ¥161.95 and ¥160.23, particularly if intervention headlines intensify.
Written by FP Markets Chief Market Analyst Aaron Hill
ETH/USD clearing support for further downsideFollowing price failing to find acceptance above resistance at US$2,381 and the failure to test channel resistance (extended from the high of US$2,383) initially had me thinking that bulls were tired. I posted about this in late April – it was in one of my Levels of the Day releases – and have since witnessed the unit travel below the 50-day SMA at US$2,211 and channel support, extended from the low of US$1,797.
In addition to the above, current price action is navigating space south of support at US$2,022 – a move reaffirming the downside bias and paving the way to support at US$1,894 and the US$1,738 low formed on 7 February.
Written by FP Markets Chief Market Analyst Aaron Hill
WTI on the verge of a breakoutIn the commodities space, oil prices remain the dominant driver of market sentiment. From a technical perspective, there are two symmetrical triangles (‘coils’) in play right now – the larger of the two is taken from US$119.42 and US$76.74, while a smaller formation can be seen between US$117.54 and US$79.01. The reason I have not labelled these as pennant patterns is simply the asymmetry between the ‘pole’ and the pattern; I believe they are symmetrical triangles.
Regardless of the name behind the pattern, you will note that the smaller formation has price fast approaching its apex, thereby highlighting a potential breakout play, with the larger formation's boundaries serving as logical targets.
Written by FP Markets Chief Market Analyst Aaron Hill
ETH/USD: Bears in the driving seatIn the cryptocurrency space, the ETH/USD daily chart is offering a bearish picture. Following the pair’s rejection from resistance at US$2,381, and the failure to reach channel resistance (extended from the high of US$2,383), as well as the subsequent push below the 50-day SMA at US$2,226 and recently the channel support (taken from the low of US$1,797), support at US$2,022 is now seen as the next downside target.
Coupled with the downtrend seen in ETH/USD since the US$4,864 high formed in August 2025, and assuming bears maintain their position below the recently breached channel support, sellers could target US$2,022. Follow-through selling could also take shape toward support at US$1,894, with a possible test of the YTD lows at US$1,738.
Written by FP Markets Chief Market Analyst Aaron Hill
Double-bottom pattern brewing on the USD indexI am aware that the US dollar index (DXY) has been range-bound since May 2025, but the technical confluence on deck right now is notable and could prompt USD bulls to change gears.
Bolstered by a descending support taken from the high of 100.40 and a neighbouring Fibonacci cluster around 97.50 – 61.8% and 78.6% retracements – a double-bottom pattern is forming off the lows at 97.63. While the greenback is tentatively bullish right now, I would think buyers would want to see price engulf the pattern’s neckline at 99.34 before having enough conviction to perhaps take aim at 31 March 100.64 highs. This would be closely followed by the pattern’s profit objective at 101.04 – levels not seen in play since May 2025.
Written by FP Markets Chief Market Analyst Aaron Hill
DXY: Daily zone breach could trigger further downsideI will try to keep this short and simple today. Following President Trump’s recent announcement that Project Freedom has been paused, markets have reacted positively, driving a bid across risk assets. While I personally think the move may be overblown, this has sent the USD southbound as traders unwind safe-haven positions.
Technically, since mid-2025, buyers and sellers have been battling for position between monthly channel support (taken from the low of 72.70) and resistance from 99.67. As you can see, price is currently testing channel support and threatening a lower breakout – a move that swings the technical pendulum toward support at 94.79.
Meanwhile, on the daily chart, price is retesting a familiar decision-point zone at 97.36-97.89 after failing to manoeuvre above resistance formed by the 50- and 200-day SMAs between 99.00 and 98.55. Sellers will likely want to see price engulf the said decision point before committing, targeting support from 96.21, followed by 95.53, and then the monthly support highlighted above at 94.79.
Written by FP Markets Chief Market Analyst Aaron Hill
XRP/USD gearing up for a leg lower?We have an interesting technical picture building on XRP/USD (Ripple versus the US dollar).
First and foremost, the unit has been trending lower since logging highs of US$3.6662 in mid-2025, offering trend followers clear sell-rally scenarios to work with. In addition to this bearish picture, the beginning of February witnessed price begin carving out a bearish pennant pattern between US$1.1180 and US$1.6705. Another bearish point is that price is now below both the 200- and 50-day SMAs at US$1.8092 and US$1.3919. Finally, you will also acknowledge that following the most recent rebound from the pennant pattern’s support, price failed to reach the opposing pennant resistance, signalling a lack of strength on the side of the bulls.
Given all of the above, a breakout below the pennant pattern’s structure could open the door to lows of US$1.2775, with a break below here perhaps triggering further downside to as far south as support from US$1.1063.
Written by FP Markets Chief Market Analyst Aaron Hill
USD/JPY getting hammeredThe JPY recently caught a solid bid on warnings of potential intervention, sending USD/JPY (US dollar versus the Japanese yen) lower by nearly 2.5% as of writing. Comments hitting the wires included those from Japanese Finance Minister Satsuki Katayama, who said that decisive action was near.
Despite a fleeting move north of resistance at ¥160.23 – a move refreshing YTD highs – the USD/JPY is now on the doorstep of an interesting area of technical support between ¥154.54 and ¥155.51. This is made up of 38.2% and 61.8% Fibonacci retracement ratios, as well as two trendline supports, extended from lows of ¥139.89 and ¥145.48, and a horizontal support. While this is a technically sound support zone, a break south of here could unearth a bearish scenario to February lows of ¥152.27.
Written by FP Markets Chief Market Analyst Aaron Hill
BTC/USD gearing up for a breakout higherThe daily chart of BTC/USD appears to be gearing up for a breakout higher.
Buyers and sellers are battling for position around the underside of resistance at US$76,742, with very little selling pressure at this point. While any rejection from the noted resistance could pull the pair as far south as trendline support around US$70,393 – extended from the low of US$59,780 – sentiment suggests a breakout to the upside could be on the table.
Cautious traders – those wary of bull traps – will want to at least see a retest of US$76,742 as a support (per black arrows), while more aggressive traders may look to enter on a close above the level. Regardless of the entry strategy used, resistance at US$85,120 warrants attention as an upside objective.
Written by FP Markets Chief Market Analyst Aaron Hill
Dow gearing up for a breakout higher?While it remains a fluid situation, markets continue to cheer developments between the US and Iran, which led to a strong bid in the Dow yesterday.
In a previous report, I highlighted that the market average engulfed the neckline (measured from the high of 46,712) of a daily inverted head-and-shoulders pattern that formed around the lows of 45,000 in late March. As shown in the chart, price action is now within touching distance of the pattern’s profit objective at 48,540.
Taking out 48,540 this week will likely open the door to a run to daily resistance at 49,632, which sits within a whisker of the all-time high of 50,512.
Written by FP Markets Chief Market Analyst Aaron Hill
Bull and bear traps seen on silverAn interesting setup on spot silver has been brewing since the metal whipsawed the high of US$92.18 in early March, forming what many technical hands will acknowledge as a textbook bull trap. Following this, the unit fell by around 36% and whipsawed south of the US$64.05 low at the end of March, delivering a classic bear trap. US$92.18 and US$64.05 mark the boundaries of the ‘range’ we are dealing with.
Commonly, after a bull and bear trap form in succession – as described above – this tends to trigger a solid bid. We have seen buyers come in reasonably strong following the bear trap, but we remain ‘mid-range’ right now. Resistance at US$86.89 could be considered a logical upside target, set just beneath the range's upper edge.
Written by FP Markets Chief Market Analyst Aaron Hill
USD on the back foot but could soon find a floorWith haven flows continuing to unwind, the USD has been on the ropes, but I feel the case for further underperformance has yet to be made. This will become more apparent with concrete peace talks.
Right now, the technicals suggest USD buyers could enter the fray. The monthly scale shows buyers and sellers squaring off at a channel support, extended from the low of 72.70. You will note that price has been swinging between this ascending support and an overhead resistance level from 99.67 since mid-2025, and, as you can see, is nearing the apex of these levels, meaning a breakout could soon be on the table. Above, the 50-month SMA calls for attention around 103.05, while below, support is at 94.79, closely shadowed by a 200-month SMA at 92.55.
Across the page on the daily chart, a decision point zone at 97.36-97.89 converges with the noted channel support on the monthly timeframe. This is a clear area of multi-timeframe confluence, which could prompt a recovery back up to at least the 200-day and 50-day SMAs between 98.52 and 98.70, respectively.
Written by FP Markets Chief Market Analyst Aaron Hill
EUR/USD testing AB=CD resistancesFrom the daily chart of the EUR/USD, the pair gained traction today amid a broad-based USD sell-off following the recent US-Iran ceasefire.
Technically, the unit is now shaking hands with a resistance zone between US$1.1734 and US$1.1690 – a base made up of a 1.272% Fibonacci projection and a 100% projection (AB=CD resistance levels). Complementing this area is an ascending resistance, taken from the low of US$1.1468.
Current AB=CD sellers will likely target the 38.2% and 61.8% Fibonacci retracements at US$1.1596 and US$1.1527, respectively, derived from legs A-D of the larger AB=CD pattern.
Written by FP Markets Chief Market Analyst Aaron Hill