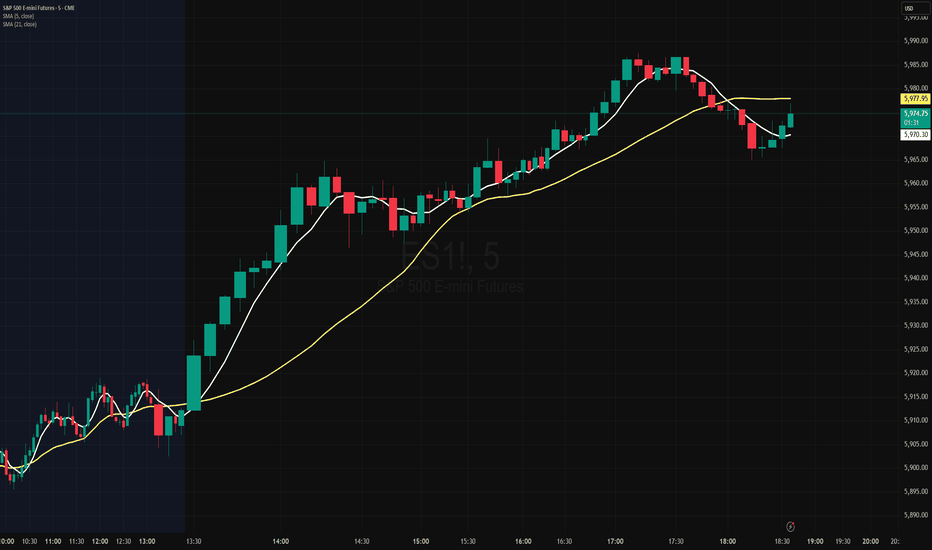
How to Use Paper Trading in TradingViewPractice trading risk free using TradingView's built-in simulator in this step-by-step tutorial from Optimus Futures.
Paper trading lets you buy and sell with virtual money in real market conditions, so you can test strategies and build confidence without putting real capital at risk.
What You'll Learn:
Understanding paper trading as a risk free simulator that tracks your orders, positions, and profit and loss just like a live account
How to activate your paper trading account
Why your account starts with a default balance of one hundred thousand dollars in virtual money
Understanding the pre-configured leverage settings for stocks, futures, forex, crypto, and other asset types
How to reset your account to change balance, currency, or leverage, and what data a reset deletes
Navigating the Trading Panel, including the Account Manager, Order Panel, and Depth of Market diagram
Tracking your activity through the Positions, Orders, History, Account History, and Trading Journal tabs
How to place trades through the Order Ticket
Placing trades directly from the chart with chart trading
This tutorial is designed for new traders learning the platform and experienced traders who want a risk free environment to test new strategies before going live.
The methods discussed may help you build trading discipline, understand order types, and develop a repeatable process across multiple markets and timeframes.
Learn more about futures trading with TradingView: optimusfutures.com
Disclaimer
There is a substantial risk of loss in futures trading. Past performance is not indicative of future results. Please trade only with risk capital. We are not responsible for any third-party links, comments, or content shared on TradingView. Any opinions, links, or messages posted by users on TradingView do not represent our views or recommendations. Please exercise your own judgment and due diligence when engaging with any external content or user commentary.
This video represents the opinion of Optimus Futures and is intended for educational purposes only.
Chart interpretations are presented solely to illustrate objective technical concepts and should not be viewed as predictive of future market behavior. In our opinion, charts are analytical tools — not forecasting instruments.  Education
How to Set Up Automation in TradingViewHere's the companion piece for the automation script:
How to Set Up Automation in TradingView
Learn to create alerts and configure webhooks for automated trading using TradingView's alert system in this comprehensive tutorial from Optimus Futures.
TradingView automation uses alerts to monitor your charts and notify you when specific conditions are met. These alerts can send notifications to your devices or trigger external services to execute trades on your behalf.
What You'll Learn:
How to create alerts using the top toolbar, Alerts Manager panel, right-click menu, or keyboard shortcuts
Understanding the three alert tabs: Settings, Message, and Notifications
Setting alert conditions for price levels, indicators, strategies, or drawing tools
Choosing trigger frequency: only once, every time, once per bar close, or once per minute
Configuring alert expiration dates or setting open-ended alerts
Customizing alert names and messages with dynamic placeholders
Enabling notifications via mobile app, browser pop-up, email, or sound
How webhooks send HTTP POST requests to external URLs when alerts trigger
Enabling two-factor authentication to unlock webhook functionality
Formatting alert messages in JSON for third-party automation services
Understanding TradingView's webhook IP addresses for whitelisting
Connecting supported brokers directly through the Trading Panel
Using third-party automation tools to bridge TradingView alerts to your broker
Testing automation setups in paper trading before going live
This tutorial will benefit futures traders and technical analysts who want to automate their trading signals and reduce manual execution.
The tools covered may help you monitor markets around the clock, eliminate emotional trading decisions, and execute strategies with faster precision.
Learn more about futures trading with TradingView: optimusfutures.com
Disclaimer
There is a substantial risk of loss in futures trading. Past performance is not indicative of future results. Please trade only with risk capital. We are not responsible for any third-party links, comments, or content shared on TradingView. Any opinions, links, or messages posted by users on TradingView do not represent our views or recommendations. Please exercise your own judgment and due diligence when engaging with any external content or user commentary.
This video represents the opinion of Optimus Futures and is intended for educational purposes only. Chart interpretations are presented solely to illustrate objective technical concepts and should not be viewed as predictive of future market behavior. In our opinion, charts are analytical tools - not forecasting instruments. Market conditions are constantly evolving, and all trading decisions should be made independently, with careful consideration of individual risk tolerance and financial objectives.
Education
How to Trade Options on Futures in TradingViewLearn to find and analyze options on futures using TradingView's dedicated options platform in this comprehensive tutorial from Optimus Futures.
Options on futures combine the leverage of futures contracts with the flexibility of options strategies. TradingView provides powerful tools to research these instruments, view options chains, and build custom strategies.
What You'll Learn:
How to access TradingView's options platform from the Products dropdown menu
Understanding the difference between equity and futures option contracts
Using the right toolbar to view options alongside any futures chart
Analyzing options by futures contract settlment date
Navigating the options chain to view all available strikes and expirations
Reading key data including volume, bid/ask prices, implied volatility, and Greeks
Using the expiration selector to navigate between different expiration dates
How the Strategy Builder lets you create and visualize options strategies
Filtering pre-built strategies by market outlook: bullish, bearish, or neutral
Using the Volatility tab to analyze implied volatility across strikes
This tutorial will benefit futures traders and technical analysts who want to incorporate options strategies into their trading process.
The tools covered may help you research hedging opportunities, analyze market expectations through implied volatility, and build defined-risk positions on futures products.
Learn more about futures trading with TradingView: optimusfutures.com
Disclaimer
There is a substantial risk of loss in futures and options trading. Past performance is not indicative of future results. Please trade only with risk capital. We are not responsible for any third-party links, comments, or content shared on TradingView. Any opinions, links, or messages posted by users on TradingView do not represent our views or recommendations. Please exercise your own judgment and due diligence when engaging with any external content or user commentary.
This video represents the opinion of Optimus Futures and is intended for educational purposes only. Chart interpretations are presented solely to illustrate objective technical concepts and should not be viewed as predictive of future market behavior. In our opinion, charts are analytical tools - not forecasting instruments. Market conditions are constantly evolving, and all trading decisions should be made independently, with careful consideration of individual risk tolerance and financial objectives. Education
How to Trade Price Action Patterns in TradingViewHow to Trade Price Action Patterns in TradingView
Master price action pattern recognition using TradingView's charting tools in this comprehensive tutorial from Optimus Futures.
Price action patterns are among the most time-tested technical analysis methods available.
They help traders identify potential reversals, continuations, and high-probability entry points directly from candlestick formations.
What You'll Learn:
Understanding price action patterns: reading market psychology through candlestick formations
The two main pattern categories: reversal patterns and continuation patterns
Essential reversal patterns: pin bars, engulfing candles, and double tops/bottoms
How pin bar wicks reveal price rejection at key levels
Bullish and bearish engulfing patterns for identifying shifts in control
Double tops and bottoms as significant turning point signals
Key continuation patterns: flags, triangles, and inside bars
Using TradingView's built-in candlestick pattern recognition indicators
Manual pattern identification techniques and optimal timeframes
Practicing with TradingView's bar replay feature
The importance of context: trading patterns at support and resistance zones
Entry timing: waiting for confirmation candles
Stop placement strategies for different pattern types
Calculating measured move targets for profit-taking
Multiple timeframe analysis for added conviction
Combining price action with volume analysis for confluence
Aligning patterns with Fibonacci levels and prior swing points
This tutorial may benefit futures traders, swing traders, and technical analysts who want to read price action directly without indicator lag.
The concepts covered could help you recognize high-probability setups, time entries more precisely, and understand the buyer/seller dynamics behind each candlestick formation.
Learn more about futures trading with TradingView: optimusfutures.com
Disclaimer:
There is a substantial risk of loss in futures trading. Past performance is not indicative of future results. Please trade only with risk capital. We are not responsible for any third-party links, comments, or content shared on TradingView. Any opinions, links, or messages posted by users on TradingView do not represent our views or recommendations. Please exercise your own judgment and due diligence when engaging with any external content or user commentary.
This video represents the opinion of Optimus Futures and is intended for educational purposes only. Chart interpretations are presented solely to illustrate objective technical concepts and should not be viewed as predictive of future market behavior. In our opinion, charts are analytical tools, not forecasting instruments.  Education
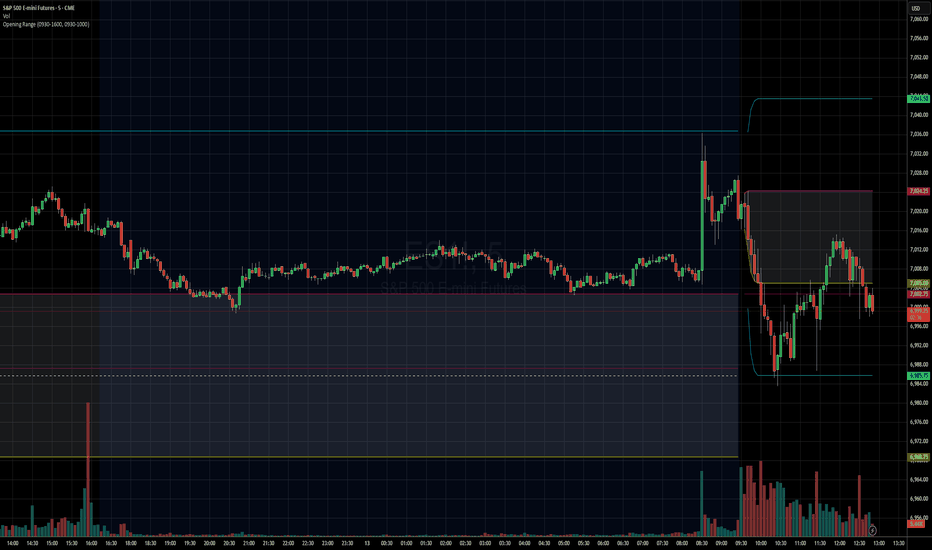
How to Trade Opening Range on TradingViewMaster the opening range strategy using TradingView's charting tools in this comprehensive tutorial from Optimus Futures.
The opening range captures the high and low established during a defined period at the market open. It represents the first consensus between overnight positioning and new session orders, often setting the tone for the rest of the trading day.
What You'll Learn:
Understanding the opening range as a key price zone formed during the first minutes of a session
How the Opening Range High (ORH) marks the ceiling of early session activity and acts as a breakout trigger
How the Opening Range Low (ORL) marks the floor and signals potential bearish momentum when broken
Why range width matters — narrow ranges often precede explosive moves, while wide ranges may indicate exhaustion
Recognizing failed breakouts when price breaches the range but reverses back inside
How to use the range midpoint as a magnet for price and a target for profit-taking
Identifying breakout entries when price closes outside the range with conviction
Why breakouts should be confirmed with volume and price action, not used in isolation
How to add the Opening Range indicator to a TradingView chart via the Indicators menu
Understanding session settings and how to customize the time window (15, 30, or 60 minutes)
Practical examples on the E-mini S&P 500 futures chart to illustrate opening range signals in real market conditions
Applying opening range analysis across different sessions and products for higher-confidence setups
This tutorial will benefit futures traders, day traders, and technical analysts who want to incorporate opening range strategies into their trading process.
The concepts covered may help you identify early directional bias, breakout opportunities, and potential entry or exit points across different markets and timeframes.
Learn more about futures trading with TradingView:
optimusfutures.com
Disclaimer
There is a substantial risk of loss in futures trading. Past performance is not indicative of future results. Please trade only with risk capital. We are not responsible for any third-party links, comments, or content shared on TradingView. Any opinions, links, or messages posted by users on TradingView do not represent our views or recommendations. Please exercise your own judgment and due diligence when engaging with any external content or user commentary.
This video represents the opinion of Optimus Futures and is intended for educational purposes only.
Chart interpretations are presented solely to illustrate objective technical concepts and should not be viewed as predictive of future market behavior. In our opinion, charts are analytical tools — not forecasting instruments.
Education
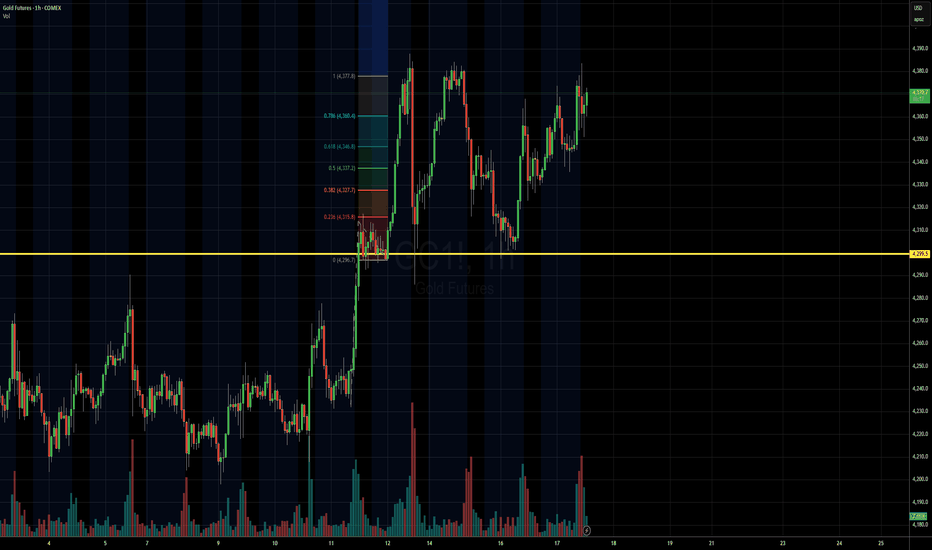
How to Trade with Volume Profile in TradingView Master Volume Profile using TradingView's powerful charting tools in this step-by-step tutorial from Optimus Futures.
Volume Profile is an advanced charting indicator that helps traders identify key support and resistance levels, areas of price acceptance, and potential breakout zones by showing where trading activity is concentrated at different price levels.
What You'll Learn:
Understanding Volume Profile as a price-based volume tool that displays trading activity horizontally across price levels
How the Point of Control (POC) represents the price level with the highest traded volume
How the Value Area encompasses approximately 70% of all traded volume, bounded by the Value Area High (VAH) and Value Area Low (VAL)
Why High Volume Nodes signal areas of price acceptance and potential support or resistance
Why Low Volume Nodes signal areas of price rejection where markets tend to move quickly
Recognizing when price trades above or below the previous session's Value Area for directional bias
Why these levels aren't automatic buy or sell triggers, and how to confirm them with other tools like traditional support/resistance or trend analysis
Identifying the "low volume node breakout," a setup where price accelerates through thin areas
Spotting potential mean-reversion trades when price returns to the POC after an extended move
How to add Volume Profile tools on TradingView via the drawing tools panel
Understanding Fixed Range, Anchored, and Session Volume Profile options and when to use each
Practical examples using futures charts
Applying Volume Profile across daily, weekly, and intraday timeframes for market structure analysis and trade planning
Learn more about futures trading with TradingView:
optimusfutures.com
Disclaimer
There is a substantial risk of loss in futures trading. Past performance is not indicative of future results. Please trade only with risk capital. We are not responsible for any third-party links, comments, or content shared on TradingView. Any opinions, links, or messages posted by users on TradingView do not represent our views or recommendations. Please exercise your own judgment and due diligence when engaging with any external content or user commentary.
This video represents the opinion of Optimus Futures and is intended for educational purposes only. Chart interpretations are presented solely to illustrate objective technical concepts and should not be viewed as predictive of future market behavior. In our opinion, charts are analytical tools — not forecasting instruments.  Education

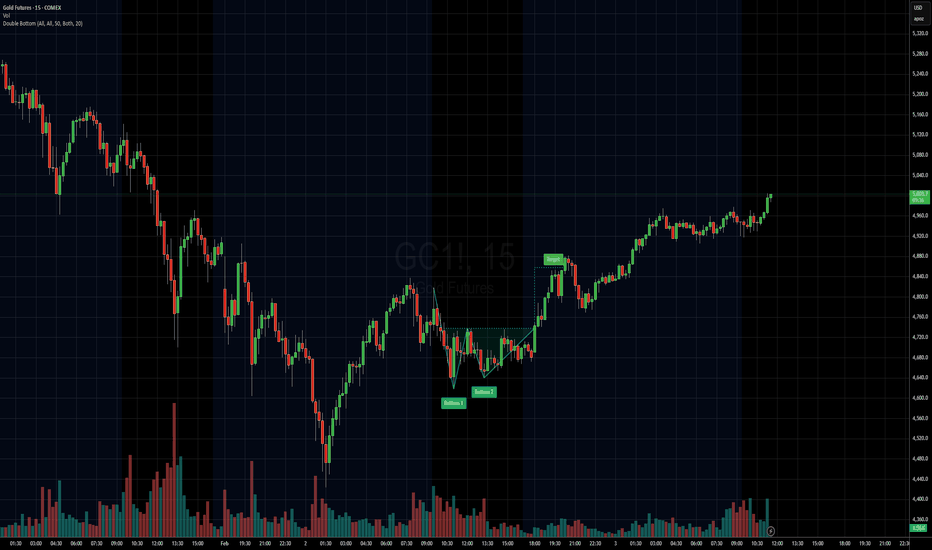
How to Trade Breakouts in TradingViewBreakout trading is a strategy that aims to capture strong price movements when markets break through key support or resistance levels, often signaling the start of a new trend or continuation move.
What You'll Learn:
Understanding breakouts as price movements beyond established support or resistance levels
How breakouts can occur at horizontal levels, trendlines, or chart patterns like triangles, rectangles, and flags
Why consolidation patterns often precede strong breakout moves
Recognizing the difference between false breakouts and confirmed breakouts
How to use candle closes beyond key levels as confirmation rather than relying on quick spikes
The critical role of volume in validating breakouts and separating real moves from fakeouts
Why expanding ATR during a breakout confirms increasing volatility and momentum
Understanding the break and close entry method for conservative breakout trades
How to scale into positions by entering partially on the break and adding on continuation
Using the pullback entry strategy to trade retests of broken levels as new support or resistance
Setting stop losses using ATR-based methods or placing them beyond consolidation patterns
Calculating profit targets with measured move techniques by projecting pattern heights
How to mark key levels in TradingView using the horizontal line tool from the left toolbar
Drawing trendlines and connecting swing points for pattern recognition
Accessing built-in pattern recognition tools through the Indicators menu
Practical examples using futures charts across multiple timeframes
This tutorial is designed for futures traders, day traders, and swing traders who want to capitalize on momentum moves and volatility expansion using technical breakout strategies.
The methods discussed may help you identify high-probability breakout setups, manage entries with proper confirmation, and set risk-appropriate stops and targets across multiple markets and timeframes.
Learn more about futures trading with TradingView: optimusfutures.com
Disclaimer
There is a substantial risk of loss in futures trading. Past performance is not indicative of future results. Please trade only with risk capital. We are not responsible for any third-party links, comments, or content shared on TradingView. Any opinions, links, or messages posted by users on TradingView do not represent our views or recommendations. Please exercise your own judgment and due diligence when engaging with any external content or user commentary.
This video represents the opinion of Optimus Futures and is intended for educational purposes only. Chart interpretations are presented solely to illustrate objective technical concepts and should not be viewed as predictive of future market behavior. In our opinion, charts are analytical tools, not forecasting instruments. Education
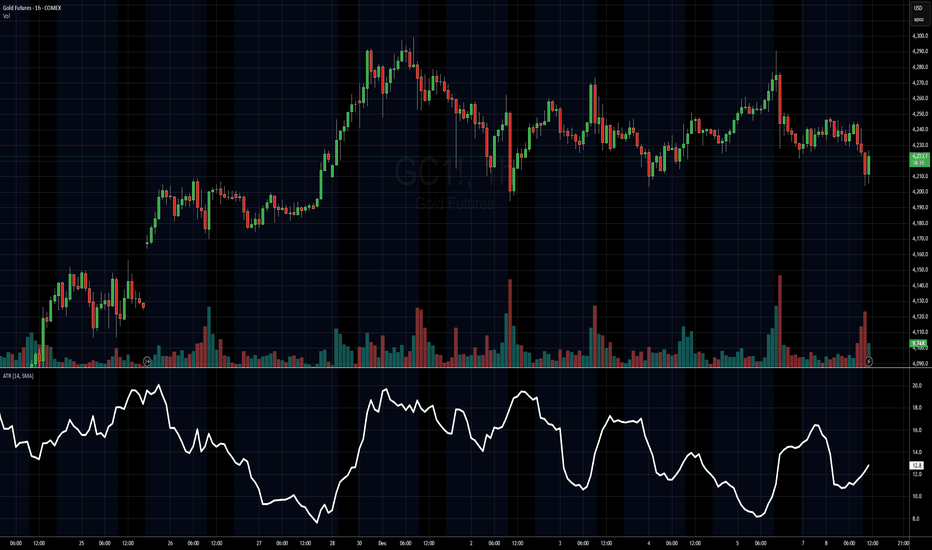
How to Use ATR in TradingViewMaster ATR using TradingView's powerful charting tools in this step-by-step tutorial from Optimus Futures.
ATR, or Average True Range, is a volatility indicator that helps traders measure market movement, set appropriate stop losses, and adjust position sizing based on current market conditions.
What You'll Learn:
Understanding ATR as a volatility measurement tool that tracks price movement regardless of direction
How ATR calculates the average range between highs and lows over a specified period — typically 14
Why rising ATR signals increasing volatility and larger price swings
Why falling ATR indicates decreasing volatility and quieter market conditions
Using ATR to set dynamic stop losses that adjust to current volatility rather than arbitrary dollar amounts
How to calculate stop distances by multiplying ATR by factors like 2x or 3x
Applying ATR for position sizing to maintain consistent risk across different volatility environments
Setting profit targets based on ATR multiples to align with actual market movement
Filtering trade setups using ATR levels to avoid low-volatility periods or confirm breakout momentum
How to add ATR on TradingView via the Indicators menu
Understanding the default 14-period setting and how shorter or longer periods affect responsiveness
Practical examples using the E-mini S&P 500 futures chart
Applying ATR across daily, weekly, and intraday timeframes for risk management and trade planning
This tutorial is designed for futures traders, swing traders, and risk-focused analysts who want to integrate volatility-based risk management into their trading approach.
The methods discussed may help you set smarter stops, size positions appropriately, and adapt your trading strategy to changing market conditions across multiple markets and timeframes.
Learn more about futures trading with TradingView: optimusfutures.com
Disclaimer
There is a substantial risk of loss in futures trading. Past performance is not indicative of future results. Please trade only with risk capital.
We are not responsible for any third-party links, comments, or content shared on TradingView. Any opinions, links, or messages posted by users on TradingView do not represent our views or recommendations.
Please exercise your own judgment and due diligence when engaging with any external content or user commentary.
This video represents the opinion of Optimus Futures and is intended for educational purposes only. Chart interpretations are presented solely to illustrate objective technical concepts and should not be viewed as predictive of future market behavior.
In our opinion, charts are analytical tools, not forecasting instruments. Education
How to Trade with Bollinger Bands in TradingViewBollinger Bands are a volatility indicator that helps traders identify market extremes, trend strength, and potential breakout setups by measuring how far price moves away from its average.
What You’ll Learn:
• Understanding Bollinger Bands as a volatility-based trading tool built around a moving average
• How the middle band represents the 20-period simple moving average (SMA)
• How the upper and lower bands are calculated as two standard deviations above and below that SMA
• Why expanding bands signal rising volatility — and tightening bands signal market compression
• Recognizing overbought and oversold conditions when price touches or moves beyond the upper or lower bands
• Why these signals aren’t automatic buy or sell triggers, and how to confirm them with other tools like RSI or MACD
• Identifying the “Bollinger Band squeeze,” a setup that often precedes major breakouts
• Spotting potential mean-reversion trades when price closes back inside the bands after moving outside
• How to add Bollinger Bands on TradingView via the Indicators menu
• Understanding the default settings (20, 2) and how adjusting the period or deviation affects sensitivity
• Practical examples using the E-mini S&P 500 futures chart
• Applying Bollinger Bands across daily, weekly, and intraday timeframes for volatility analysis and signal confirmation
This tutorial is designed for futures traders, swing traders, and technical analysts who want to integrate volatility dynamics into their trading approach.
The methods discussed may help you identify breakout conditions, trend continuation signals, and potential reversal zones across multiple markets and timeframes.
Learn more about futures trading with TradingView:
optimusfutures.com
Disclaimer
There is a substantial risk of loss in futures trading. Past performance is not indicative of future results. Please trade only with risk capital. We are not responsible for any third-party links, comments, or content shared on TradingView. Any opinions, links, or messages posted by users on TradingView do not represent our views or recommendations. Please exercise your own judgment and due diligence when engaging with any external content or user commentary.
This video represents the opinion of Optimus Futures and is intended for educational purposes only.
Chart interpretations are presented solely to illustrate objective technical concepts and should not be viewed as predictive of future market behavior. In our opinion, charts are analytical tools — not forecasting instruments.
Education
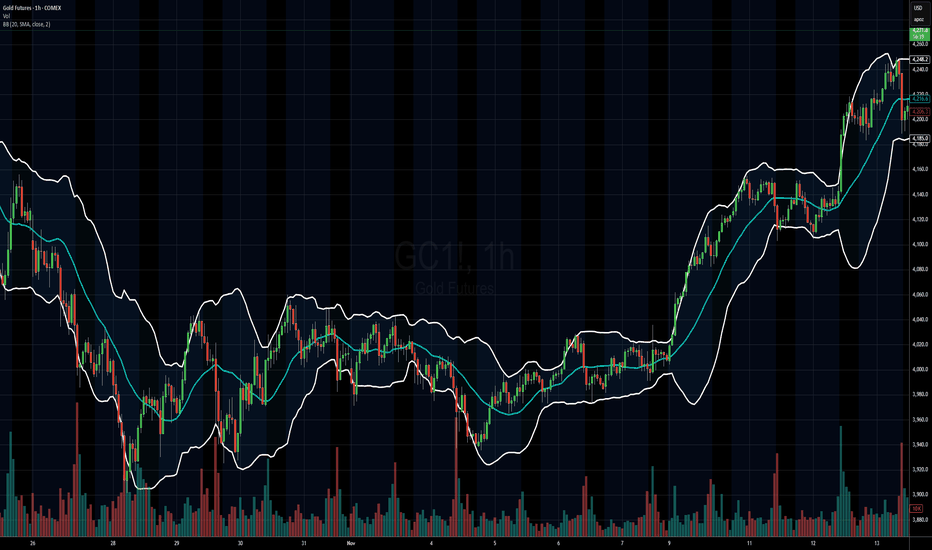
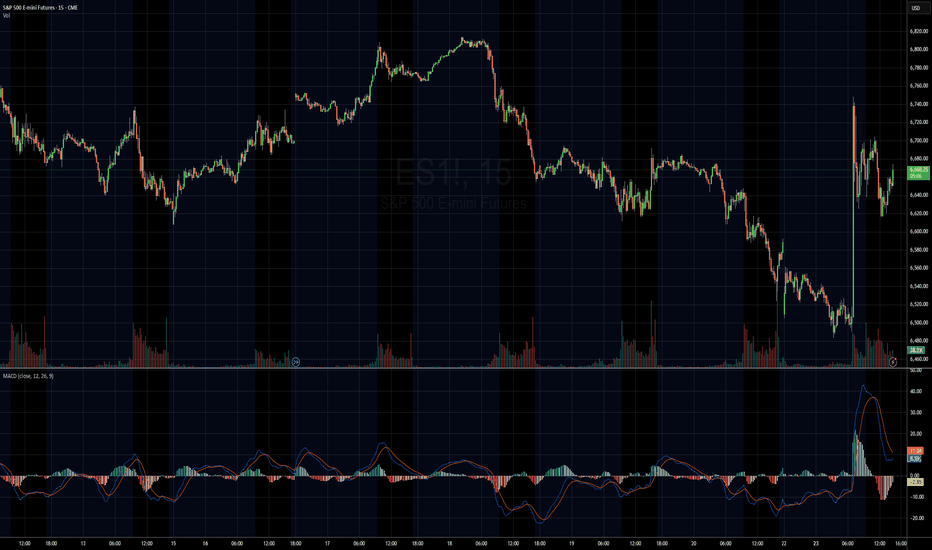
How to Trade with MACD in TradingViewMaster the MACD indicator using TradingView’s charting tools in this comprehensive tutorial from Optimus Futures.
The Moving Average Convergence Divergence (MACD) is a momentum and trend-following indicator that helps traders identify shifts in market direction and momentum strength. It measures the relationship between two exponential moving averages (EMAs) to reveal when momentum may be building or fading.
What You’ll Learn:
Understanding MACD as a tool that tracks the convergence and divergence of moving averages
How the MACD line is calculated as the difference between the 12-period and 26-period EMAs
How the Signal line acts as a 9-period EMA of the MACD line and serves as a trigger for potential buy or sell signals
How the Histogram visualizes the distance between the MACD line and Signal line to show momentum strength
Recognizing bullish and bearish crossovers between the MACD and Signal lines
How to interpret the Zero Line as a momentum baseline — above zero suggests an uptrend, below zero suggests a downtrend
Identifying bullish and bearish divergences between MACD and price to anticipate potential reversals
Why crossovers and divergences should be confirmed with price action and trend structure, not used in isolation
How to add MACD to a TradingView chart via the Indicators menu
Understanding the default settings (12, 26, 9) and how adjusting them changes responsiveness
Practical examples on the E-mini S&P 500 futures chart to illustrate MACD signals in real market conditions
Applying MACD across multiple timeframes — daily, weekly, or intraday — for higher-confidence confirmations
This tutorial will benefit futures traders, swing traders, and technical analysts who want to incorporate MACD into their trading process.
The concepts covered may help you identify trend changes, momentum shifts, and potential entry or exit points across different markets and timeframes.
Learn more about futures trading with TradingView:
optimusfutures.com
Disclaimer
There is a substantial risk of loss in futures trading. Past performance is not indicative of future results. Please trade only with risk capital. We are not responsible for any third-party links, comments, or content shared on TradingView. Any opinions, links, or messages posted by users on TradingView do not represent our views or recommendations. Please exercise your own judgment and due diligence when engaging with any external content or user commentary.
This video represents the opinion of Optimus Futures and is intended for educational purposes only.
Chart interpretations are presented solely to illustrate objective technical concepts and should not be viewed as predictive of future market behavior. In our opinion, charts are analytical tools — not forecasting instruments. Education

How to Trade with Stochastics in TradingViewMaster Stochastics using TradingView’s charting tools in this comprehensive tutorial from Optimus Futures.
The Stochastic Oscillator is a momentum indicator that helps traders identify potential turning points in the market by comparing the current closing price to the recent high–low range. It’s designed to show when momentum may be shifting from buyers to sellers — or vice versa.
What You’ll Learn:
- Understanding the Stochastic Oscillator as a momentum tool plotted from 0 to 100
- How the %K line represents the current close relative to the recent high–low range
- How the %D line acts as a moving average of %K and serves as a signal line
- Key thresholds: readings above 80 suggest overbought conditions, while below 20 suggest oversold conditions
- Why overbought and oversold levels are not automatic buy or sell signals — and how strong trends can keep Stochastics extended
- Identifying bullish and bearish crossovers between %K and %D
- Spotting bullish and bearish divergence between price and momentum
- Using Stochastics to confirm trend direction across different timeframes
- How to add Stochastics on TradingView via the Indicators menu
- Understanding the default settings (14, 3, 3) and how adjusting them affects responsiveness
- Practical examples on the E-mini S&P 500 futures chart
- Applying Stochastics across multiple timeframes — daily, weekly, or intraday — for confirmation signals
This tutorial will benefit futures traders, swing traders, and technical analysts who want to incorporate Stochastics into their trading process.
The concepts covered may help you identify momentum shifts, potential reversal zones, and trend confirmations across different markets and timeframes.
Learn more about futures trading with TradingView:
optimusfutures.com
Disclaimer
There is a substantial risk of loss in futures trading. Past performance is not indicative of future results. Please trade only with risk capital. We are not responsible for any third-party links, comments, or content shared on TradingView. Any opinions, links, or messages posted by users on TradingView do not represent our views or recommendations. Please exercise your own judgment and due diligence when engaging with any external content or user commentary.
This video represents the opinion of Optimus Futures and is intended for educational purposes only.
Chart interpretations are presented solely to illustrate objective technical concepts and should not be viewed as predictive of future market behavior. In our opinion, charts are analytical tools — not forecasting instruments. Education
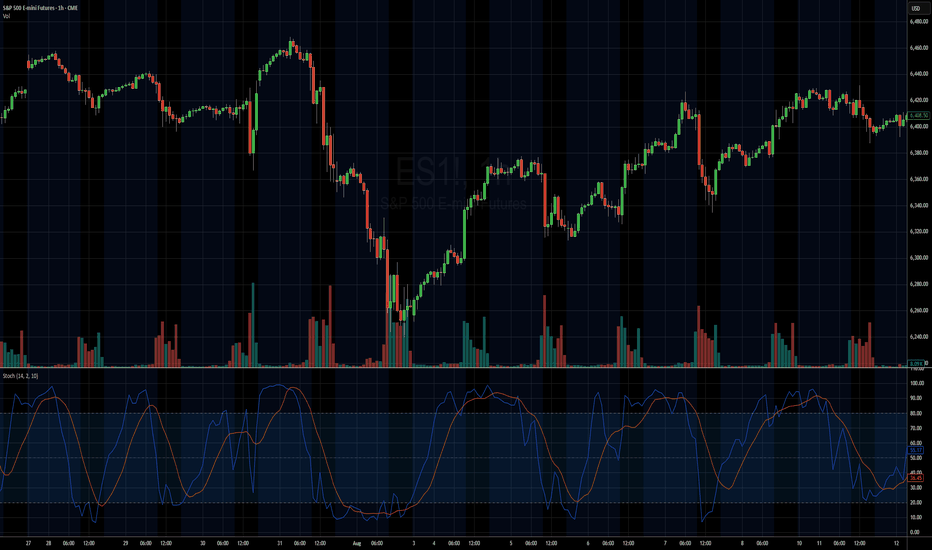
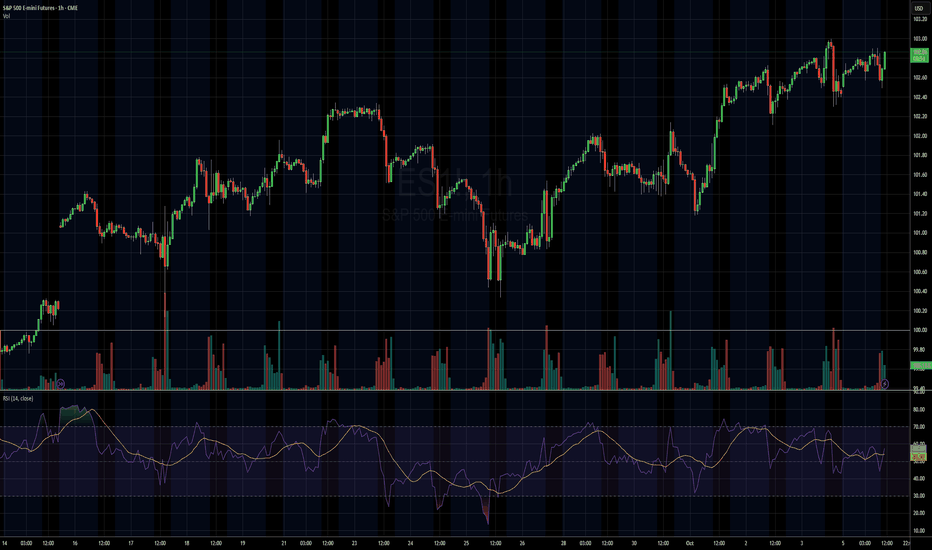
How to Use The Relative Strength Index (RSI) in TradingViewMaster RSI using TradingView’s charting tools in this comprehensive tutorial from Optimus Futures.
The Relative Strength Index (RSI) is one of the most widely used momentum indicators in technical analysis. It helps traders identify potential overbought and oversold conditions, spot divergences, and confirm the strength of trends.
What You’ll Learn:
Understanding RSI: a momentum oscillator plotted from 0 to 100
Key thresholds: how readings above 70 suggest overbought conditions and below 30 suggest oversold conditions
Why RSI signals are not automatic buy/sell triggers, and how strong trends can keep RSI extended for long periods
Spotting bullish and bearish price divergences
Using RSI to confirm trends
How to add RSI on TradingView via the Indicators menu
Understanding the default inputs and how changing them affects the indicator
Example on the E-mini S&P 500 futures: how RSI dipping below 30 and crossing back above can highlight momentum shifts
Combining RSI with other analysis for better confirmation
Practical applications across multiple timeframes, from intraday trading to swing setups
This tutorial will benefit futures traders, swing traders, and technical analysts who want to incorporate RSI into their trading strategies.
The concepts covered may help you identify momentum shifts, potential reversal points, and confirmation of trend strength across different markets
Learn more about futures trading with TradingView:
optimusfutures.com
Disclaimer:
There is a substantial risk of loss in futures trading. Past performance is not indicative of future results. Please trade only with risk capital. We are not responsible for any third-party links, comments, or content shared on TradingView. Any opinions, links, or messages posted by users on TradingView do not represent our views or recommendations. Please exercise your own judgment and due diligence when engaging with any external content or user commentary.
This video represents the opinion of Optimus Futures and is intended for educational purposes only. Chart interpretations are presented solely to illustrate objective technical concepts and should not be viewed as predictive of future market behavior. In our opinion, charts are analytical tools—not forecasting. Education
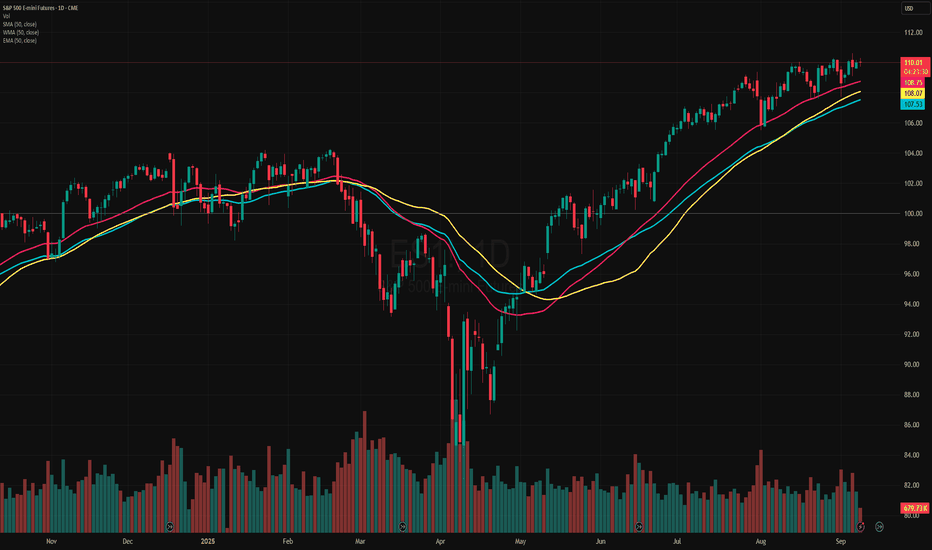
How to Use Moving Averages in TradingViewMaster moving averages using TradingView's charting tools in this comprehensive tutorial from Optimus Futures.
Moving averages are among the most versatile technical analysis tools available, helping traders analyze trends, identify overbought/oversold conditions, and create tradeable support and resistance levels.
What You'll Learn:
Understanding moving averages: lagging indicators with multiple applications
Simple moving average basics: calculating price averages over set periods
Key configuration choices: lookback periods, price inputs, and timeframes
How to select optimal lookback periods (like 200-day) for different trading styles
Using different price inputs: close, open, high, or low prices
Applying moving averages across all timeframes from daily to 5-minute charts
Analyzing price relative to moving averages for trend identification
Using 50-day and 200-day moving averages for trend analysis on E-Mini S&P 500
Mean reversion trading: how price tends to return to moving averages
Trend direction analysis using moving average slopes
Famous crossover signals: "Death Cross" and "Golden Cross" explained
Trading moving averages as dynamic support and resistance levels
Advanced moving average types: weighted and exponential moving averages
Applying moving averages to other indicators like MACD and Stochastics
Balancing sensitivity vs. noise when choosing periods
This tutorial may benefit futures traders, swing traders, and technical analysts who want to incorporate moving averages into their trading strategies.
The concepts covered could help you identify trend direction, potential reversal points, and dynamic trading levels across multiple timeframes.
Learn more about futures trading with TradingView:
optimusfutures.com
Disclaimer:
There is a substantial risk of loss in futures trading. Past performance is not indicative of future results. Please trade only with risk capital. We are not responsible for any third-party links, comments, or content shared on TradingView. Any opinions, links, or messages posted by users on TradingView do not represent our views or recommendations. Please exercise your own judgment and due diligence when engaging with any external content or user commentary.
This video represents the opinion of Optimus Futures and is intended for educational purposes only. Chart interpretations are presented solely to illustrate objective technical concepts and should not be viewed as predictive of future market behavior. In our opinion, charts are analytical tools—not forecasting Education
Education
 Education

Education

Education
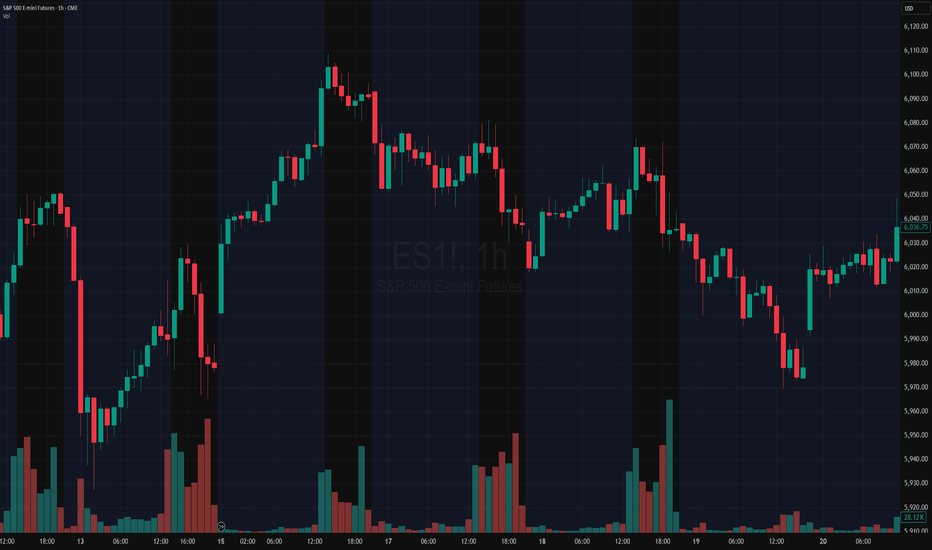
How to Trade Double Tops & Bottoms in TradingViewLearn how to identify, validate, and trade double top and double bottom reversal patterns using TradingView's charting tools in this comprehensive tutorial from Optimus Futures. Understanding these classic chart formations can help you spot potential trend reversals and capitalize on contrarian trading opportunities in the futures markets.
What You'll Learn:
• Understanding contrarian vs. continuation trading strategies and when to use each approach
• The psychology behind buying low and selling high through reversal pattern trading
• How to identify double top and double bottom formations on any timeframe
• Key characteristics of valid double tops and bottoms, including volume confirmation
• Using TradingView's XABCD pattern tool to validate potential double top/bottom setups
• Real-world example analysis using crude oil futures charts
• Risk management techniques for trading reversal patterns
• How to calculate appropriate entry points, stop losses, and profit targets
• Setting up 1:1 risk-reward ratios for mathematical trading edge
• Understanding win rate requirements for profitable pattern trading
• How double bottom patterns work as the inverse of double top formations
This tutorial may benefit futures traders, swing traders, and technical analysts interested in contrarian trading strategies and reversal pattern recognition. The concepts covered could help you identify potential turning points in market trends and develop systematic approaches to trading these classic chart formations.
Visit Optimus Futures to learn more about trading futures with TradingView: optimusfutures.com/Platforms/TradingView.php
Disclaimer:
There is a substantial risk of loss in futures trading. Past performance is not indicative of future results. Please trade only with risk capital. We are not responsible for any third-party links, comments, or content shared on TradingView. Any opinions, links, or messages posted by users on TradingView do not represent our views or recommendations. Please exercise your own judgment and due diligence when engaging with any external content or user commentary.
This video represents the opinion of Optimus Futures and is intended for educational purposes only. Chart interpretations are presented solely to illustrate objective technical concepts and should not be viewed as predictive of future market behavior. In our opinion, charts are analytical tools—not forecasting instruments. Market conditions are constantly evolving, and all trading decisions should be made independently, with careful consideration of individual risk tolerance and financial objectives. Education
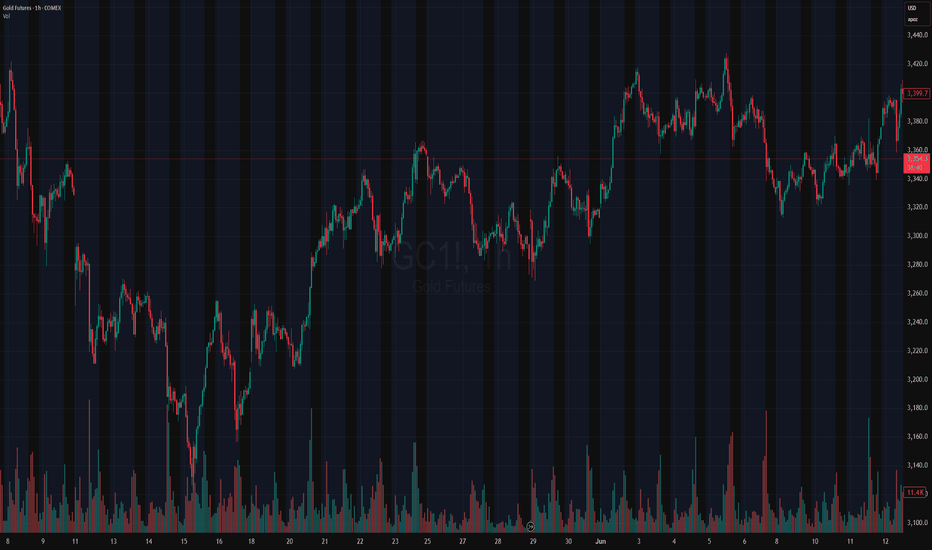
How to Spot Head & Shoulders Patterns in TradingViewDiscover how to identify and validate Head & Shoulders patterns using TradingView's built-in pattern recognition tools in this detailed tutorial from Optimus Futures. Chart patterns are essential tools for many futures traders, and the Head & Shoulders formation is among the most recognized reversal patterns in technical analysis.
What You'll Learn:
• Understanding the Head & Shoulders pattern: a key reversal formation in technical analysis
• How to access and use TradingView's pattern drawing tools and objects
• Step-by-step process for identifying potential Head & Shoulders formations on any timeframe
• Techniques for spotting the "head" by locating the highest high or lowest low pivot points
• How to identify matching "shoulders" on either side of the head formation
• Validating your pattern identification using TradingView's drawing tools
• Real-world example using crude oil futures on an hourly chart from October 2024
• Key characteristics that distinguish bearish Head & Shoulders reversal patterns
• Best practices for using pivot points and swing analysis in pattern recognition
This tutorial may benefit futures traders, swing traders, and technical analysts who want to improve their chart pattern recognition skills in TradingView. The techniques demonstrated could help you identify potential reversal opportunities and make more informed trading decisions when these classic formations appear on your charts.
Keywords: Head and Shoulders pattern, TradingView tutorial, chart patterns, technical analysis, reversal patterns, futures trading, pivot points, swing analysis, pattern recognition, trading education
Visit Optimus Futures to learn more about trading futures with TradingView:
optimusfutures.com
Disclaimer:
There is a substantial risk of loss in futures trading. Past performance is not indicative of future results. Please trade only with risk capital. We are not responsible for any third-party links, comments, or content shared on TradingView. Any opinions, links, or messages posted by users on TradingView do not represent our views or recommendations. Please exercise your own judgment and due diligence when engaging with any external content or user commentary.
This video represents the opinion of Optimus Futures and is intended for educational purposes only. Chart interpretations are presented solely to illustrate objective technical concepts and should not be viewed as predictive of future market behavior. In our opinion, charts are analytical tools—not forecasting instruments. Market conditions are constantly evolving, and all trading decisions should be made independently, with careful consideration of individual risk tolerance and financial objectives.
 Education
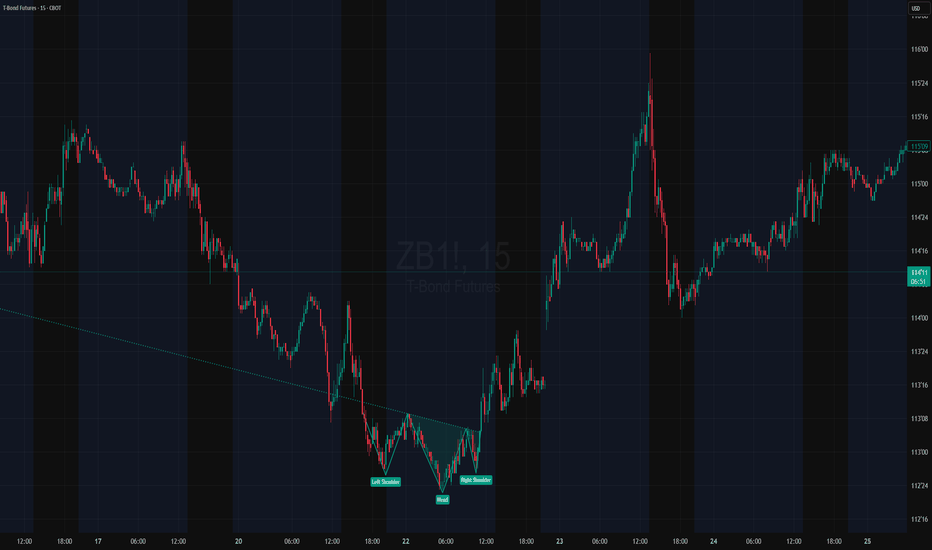
How to Draw Support & Resistance In TradingViewLearn how to effectively identify, draw, and utilize support and resistance levels in TradingView with this comprehensive step-by-step tutorial. Whether you're a beginner trader or looking to refine your technical analysis skills, this video covers everything you need to know about one of the most fundamental concepts in trading.
What You'll Learn:
Understanding support and resistance: the foundation of technical analysis and price action trading
Step-by-step instructions for drawing horizontal support and resistance lines in TradingView
Creating support and resistance zones for more flexible trading approaches
Practical tips for using TradingView's drawing tools effectively
This tutorial may be helpful for day traders, swing traders, and investors using TradingView who want to improve their chart analysis skills. The techniques covered could help you make more informed entry and exit decisions by understanding where price might find support or encounter resistance.
Visit Optimus Futures to learn more about trading futures with TradingView: optimusfutures.com
Disclaimer:
There is a substantial risk of loss in futures trading. Past performance is not indicative of future results. Please trade only with risk capital. We are not responsible for any third-party links, comments, or content shared on TradingView. Any opinions, links, or messages posted by users on TradingView do not represent our views or recommendations. Please exercise your own judgment and due diligence when engaging with any external content or user commentary.
This video represents the opinion of Optimus Futures and is intended for educational purposes only. Chart interpretations are presented solely to illustrate objective technical concepts and should not be viewed as predictive of future market behavior. In our opinion, charts are analytical tools—not forecasting instruments. Market conditions are constantly evolving, and all trading decisions should be made independently, with careful consideration of individual risk tolerance and financial objectives. Education
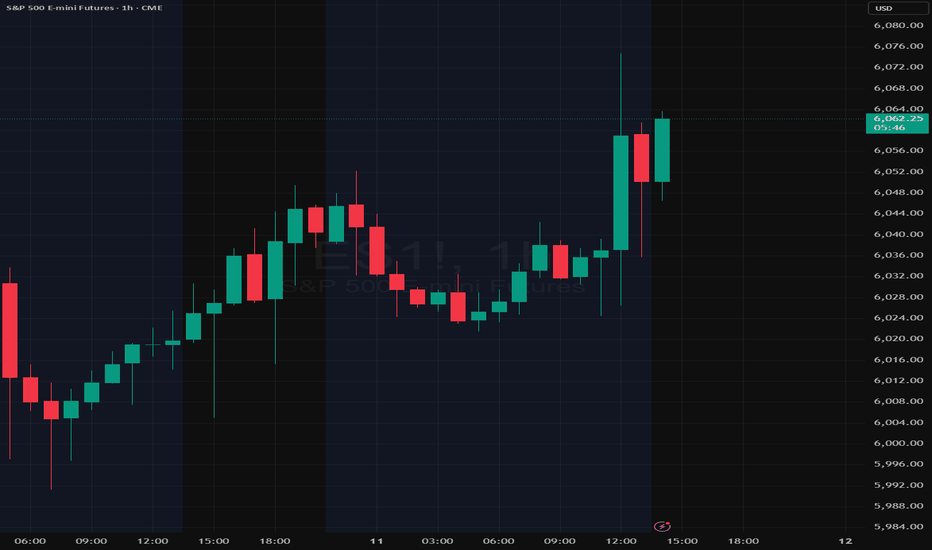
How to Choose Chart Types in TradingViewThis tutorial covers the 21 chart types available in TradingView, explaining what each one is, how to read it, as well as the advantages and drawbacks.
Learn more about trading futures with Optimus Futures using the TradingView platform here: www.optimusfutures.com
Disclaimer:
There is a substantial risk of loss in futures trading. Past performance is not indicative of future results. Please trade only with risk capital. We are not responsible for any third-party links, comments, or content shared on TradingView. Any opinions, links, or messages posted by users on TradingView do not represent our views or recommendations. Please exercise your own judgment and due diligence when engaging with any external content or user commentary.
This video represents the opinion of Optimus Futures and is intended for educational purposes only. Chart interpretations are presented solely to illustrate objective technical concepts and should not be viewed as predictive of future market behavior. In our opinion, charts are analytical tools—not forecasting instruments. Market conditions are constantly evolving, and all trading decisions should be made independently, with careful consideration of individual risk tolerance and financial objectives.
Education

Education
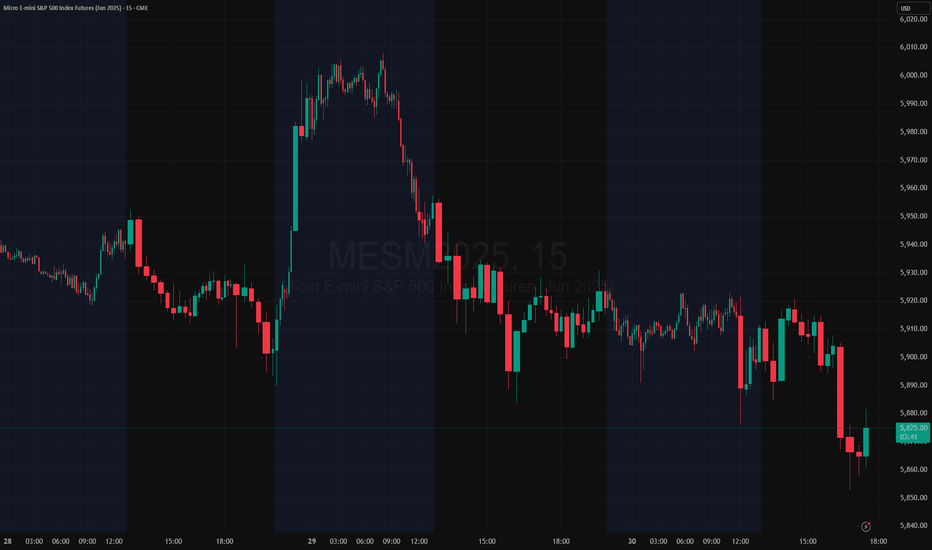
How to Use Stop Losses in TradingViewThis video covers stop loss orders, explaining what they are, why traders use them, and how to set them up in TradingView.
Disclaimer:
There is a substantial risk of loss in futures trading. Past performance is not indicative of future results. Please trade only with risk capital. We are not responsible for any third-party links, comments, or content shared on TradingView. Any opinions, links, or messages posted by users on TradingView do not represent our views or recommendations. Please exercise your own judgment and due diligence when engaging with any external content or user commentary.
The placement of contingent orders by you or broker, or trading advisor, such as a "stop-loss" or "stop-limit" order, will not necessarily limit your losses to the intended amounts, since market conditions may make it impossible to execute such orders.
Education

Education