Apple strengthens its position in India with Bharti AirtelApple has partnered with India's second-largest telecom operator, giving the iPhone producer a much-needed boost in the content market. The company remains significantly behind giants such as Spotify and Walt Disney in this market.
The American tech corporation, aiming to increase global revenue from services, including apps, payment systems, and media, will offer 281 million Bharti Airtel customers free access to streaming music and video. In doing so, the company achieves two goals at once: diversification and sales growth.
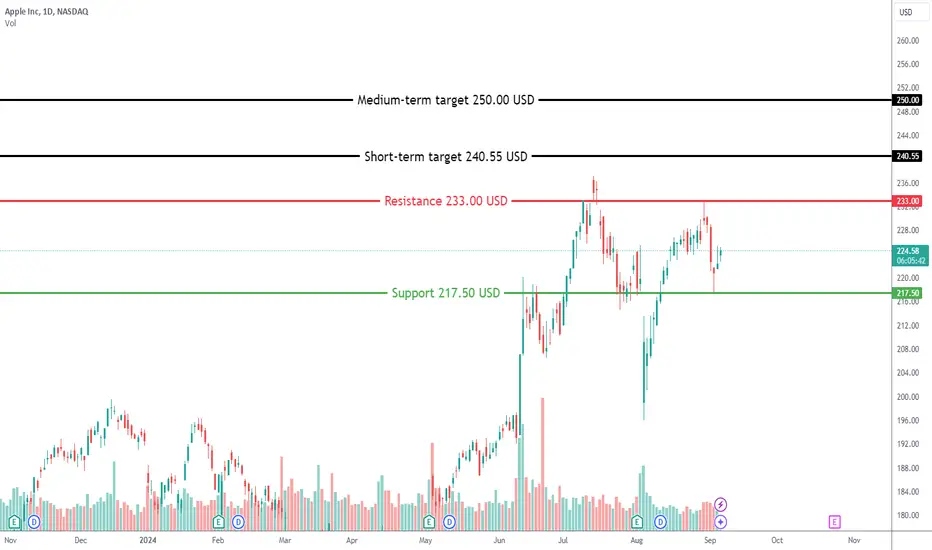
Let's examine Apple Inc. (NASDAQ: AAPL) stock chart for possible trades from a technical analysis point of view.
On the D1 timeframe, resistance has formed at 233.00 USD, with support at 217.50 USD. The asset is in an upward trend with the quotes above the support line. If the trend reverses, the target for the fall could be 202.80 USD.
If the upward trend continues after breaking through the resistance level at 233.00 USD, the short-term target could be 240.55 USD. In the medium term, the price may rise to 250.00 USD.
—
Ideas and other content presented on this page should not be considered as guidance for trading or an investment advice. RoboMarkets bears no responsibility for trading results based on trading opinions described in these analytical reviews.
The material presented and the information contained herein is for information purposes only and in no way should be considered as the provision of investment advice for the purposes of Investment Firms Law L. 87(I)/2017 of the Republic of Cyprus or any other form of personal advice or recommendation, which relates to certain types of transactions with certain types of financial instruments.
Risk Warning: CFDs are complex instruments and come with a high risk of losing money rapidly due to leverage. 65.68% of retail investor accounts lose money when trading CFDs with this provider. You should consider whether you understand how CFDs work and whether you can afford to take the high risk of losing your money. GitLab reports strong Q2 earnings, surpasses expectationsGitLab Inc. has delivered a robust financial performance for Q2 , posting earnings of 12.3 million USD or 0.08 USD per share, a significant improvement from a loss of 51.2 million USD or 0.33 USD per share a year earlier. On an adjusted basis, earnings per share reached 0.15 USD, surpassing the expected 0.10 USD per share. Revenue also rose impressively, reaching 182.6 million USD, up from 139.6 million USD and exceeding forecasts of 176.9 million USD.
The positive financial outcome has led GitLab to revise its full-year earnings per share guidance upwards to 0.45-0.47 USD and its revenue forecast to 742-744 million USD. This update reflects a strong demand for GitLab's offerings and a robust operational execution.
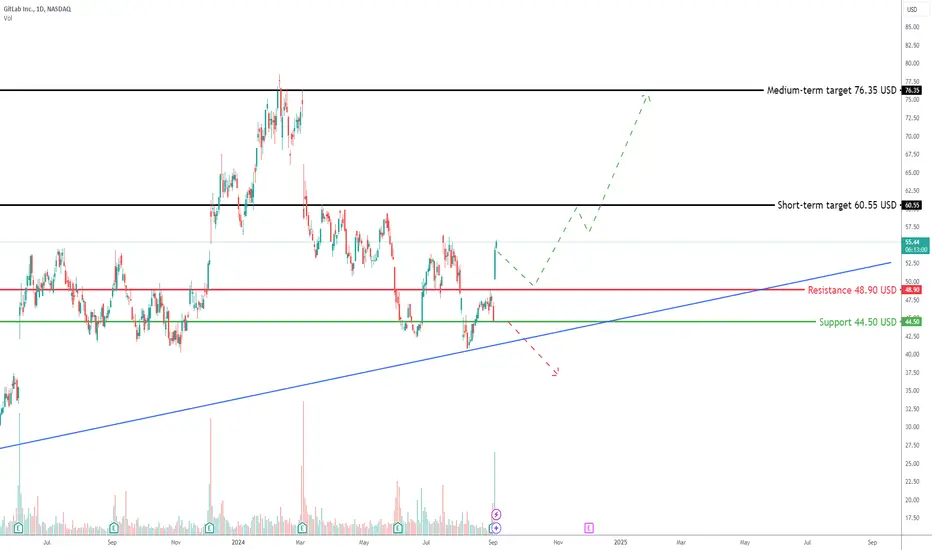
Technical analysis of GitLab Inc. (NASDAQ: GTLB)
Looking at GitLab's stock for potential trading opportunities:
Timeframe : Daily (D1)
Current Trend : the stock is in an uptrend, having recently broken the resistance at 48.90 USD, which now acts as support
Short-term Target : if the uptrend persists, the immediate target is 60.55 USD, following the break above the previous resistance
Medium-term Target : if the bullish momentum continues, the price could potentially extend to 76.35 USD
Key Support : positioned at 44.50 USD
Downtrend Scenario : if the stock were to reverse and breach the support at 44.50 USD, it could target a lower support at 37.10 USD
Market outlook
GitLab's shares show strong bullish signals following the positive earnings report and upbeat revenue projections. The break above key resistance levels suggests confidence among investors in the company's growth trajectory. Traders and investors might consider potential entry points as the stock tests new highs, keeping an eye on the established support levels for risk management. The company's upward revision in financial guidance could continue to fuel investor optimism and propel the stock towards medium-term targets.
—
Ideas and other content presented on this page should not be considered as guidance for trading or an investment advice. RoboMarkets bears no responsibility for trading results based on trading opinions described in these analytical reviews.
The material presented and the information contained herein is for information purposes only and in no way should be considered as the provision of investment advice for the purposes of Investment Firms Law L. 87(I)/2017 of the Republic of Cyprus or any other form of personal advice or recommendation, which relates to certain types of transactions with certain types of financial instruments.
Risk Warning: CFDs are complex instruments and come with a high risk of losing money rapidly due to leverage. 65.68% of retail investor accounts lose money when trading CFDs with this provider. You should consider whether you understand how CFDs work and whether you can afford to take the high risk of losing your money. Tesla Set to Launch Six-Seat Model Y in China by 2025Tesla Inc. is gearing up to introduce a six-seat version of its Model Y vehicle in China starting in 2025, aiming to refresh the appeal of its top-selling but maturing electric car model. The company has initiated preparations with suppliers to ramp up Model Y production significantly at its Shanghai facility. While details on the expansion of the production plant remain concealed, pending approval for a 70-hectare expansion on former farmland, Tesla continues to show robust performance with a 6% year-on-year increase in Model 3 deliveries in the first half of the year.
This move to expand and innovate within the Chinese market is part of Tesla's broader strategy to maintain its competitive edge and adapt to evolving consumer preferences and technological advancements in the electric vehicle sector.
Technical analysis of Tesla Inc. (NASDAQ: TSLA)
Examining Tesla's stock to offer insights into potential trading strategies:
Timeframe : Daily (D1)
Current Trend : the stock exhibits an upward trend, recently regaining momentum above the key support level
Short-term Target : if the uptrend persists, the immediate target is at 266.00 USD, contingent upon breaking through the resistance at 235.50 USD
Medium-term Target : a successful breach of the current resistance could propel the stock towards 300.00 USD
Key Support : the crucial support level to watch is at 181.45 USD
Reversal Scenario : if the stock breaks below this support, it could signal a potential downtrend, with a downside target of 140.00 USD
Market outlook
As Tesla prepares to produce the new Model Y variant in China, its stock could see increased investor interest, particularly if it continues demonstrating innovation and market expansion capability. The technical setup is currently bullish, suggesting that, if Tesla can maintain its trajectory and break
—
Ideas and other content presented on this page should not be considered as guidance for trading or an investment advice. RoboMarkets bears no responsibility for trading results based on trading opinions described in these analytical reviews.
The material presented and the information contained herein is for information purposes only and in no way should be considered as the provision of investment advice for the purposes of Investment Firms Law L. 87(I)/2017 of the Republic of Cyprus or any other form of personal advice or recommendation, which relates to certain types of transactions with certain types of financial instruments.
Risk Warning: CFDs are complex instruments and come with a high risk of losing money rapidly due to leverage. 65.68% of retail investor accounts lose money when trading CFDs with this provider. You should consider whether you understand how CFDs work and whether you can afford to take the high risk of losing your money. Alibaba's antitrust scrutiny concludes with a positive outcomeChina's State Administration of Market Regulation (SAMR) has officially concluded its antitrust investigation into Alibaba, indicating satisfactory compliance by the e-commerce giant with anti-monopoly laws. This investigation, which began in 2021, resulted in a substantial fine of 18.23 billion CNY (approximately 2.6 billion USD) due to practices restricting sellers from exclusively choosing Alibaba's platform over competitors. SAMR noted that Alibaba's remediation efforts have produced "good results," addressing issues related to its previous "pick one" policy, which unfairly bolstered its market dominance.
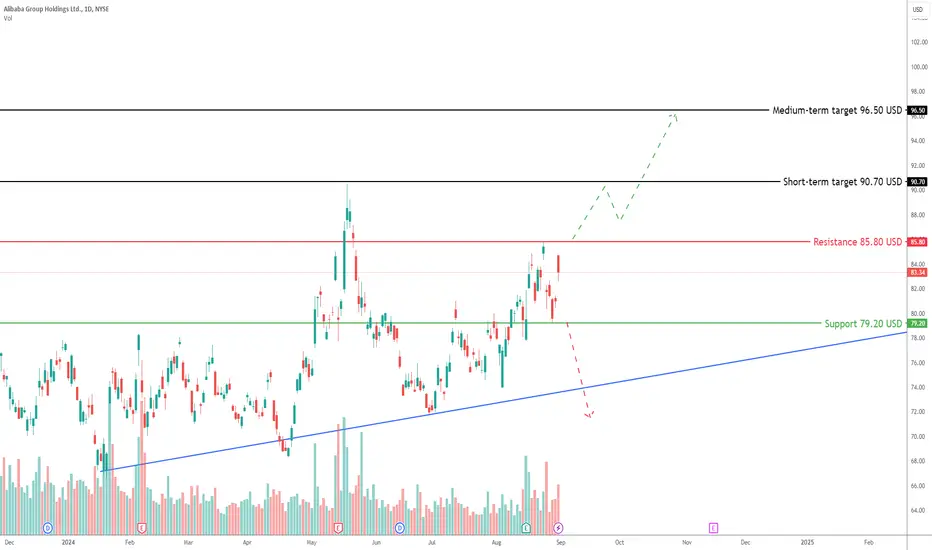
Technical analysis of Alibaba Group Holding Ltd ADR (NYSE: BABA)
A review of Alibaba's stock performance offers insights into potential trading opportunities based on its current technical landscape:
Timeframe : Daily (D1)
Current Trend : the stock is exhibiting an upward trend, having recently breached the resistance level at 85.80 USD, which now serves as support
Short-term Target : the immediate upside target is at 90.70 USD, contingent upon breaking past the current resistance
Medium-term Target : If the momentum continues past the short-term resistance, the next target is at 96.50 USD
Key Support : established at 79.20 USD
Downside Scenario : a reversal below the key support level could trigger a potential decline to 71.50 USD, signalling a bearish shift
Market outlook
Following the conclusion of the antitrust investigation and subsequent compliance measures, Alibaba's stock is showing signs of resilience and potential growth. Investors and traders might find this development encouraging as it not only alleviates regulatory uncertainties but also highlights Alibaba's adaptability to stringent market regulations. As Alibaba continues to navigate the competitive e-commerce landscape with renewed regulatory compliance, its stock may witness further appreciation, making it a compelling watch for potential upward movements.
—
Ideas and other content presented on this page should not be considered as guidance for trading or an investment advice. RoboMarkets bears no responsibility for trading results based on trading opinions described in these analytical reviews.
The material presented and the information contained herein is for information purposes only and in no way should be considered as the provision of investment advice for the purposes of Investment Firms Law L. 87(I)/2017 of the Republic of Cyprus or any other form of personal advice or recommendation, which relates to certain types of transactions with certain types of financial instruments.
Risk Warning: CFDs are complex instruments and come with a high risk of losing money rapidly due to leverage. 65.68% of retail investor accounts lose money when trading CFDs with this provider. You should consider whether you understand how CFDs work and whether you can afford to take the high risk of losing your money. Marvell forecasts revenue growth driven by AI productsMarvell Technology, Inc. has reported a remarkable 10% quarter-on-quarter revenue growth, primarily driven by robust demand for its artificial intelligence (AI) products. According to the company's recent press release, Marvell anticipates continued growth across all end markets, with an expected revenue increase of 14% for Q3.
Matt Murphy, chair and CEO of Marvell Technology, highlighted the strong demand for AI and electro-optical products as critical contributors to the company's growth. He remains optimistic about growth prospects in all company markets in the upcoming quarter.
Technical analysis of Marvell Technology, Inc. (NASDAQ: MRVL)
Analysing potential trading opportunities based on the technical setup of Marvell's stock:
Timeframe : four-hour (H4)
Current trend : the stock is currently in an upward trend, trading within a bullish price channel
Short-term target : the immediate upside target is at resistance at 85.55 USD
Medium-term target : breaking past the resistance at 72.95 USD could open the way for further growth, potentially reaching the yearly high of 98.65 USD
Key support : positioned at 60.55 USD
Reversal scenario : a break below the key support at 60.55 USD would negate the bullish scenario, possibly leading to a decline toward 46.55 USD
Market outlook
Marvell Technology's stock has rebounded strongly and is now testing the upper boundary of a descending correction channel. A breakout above this channel could signal the continuation of bullish momentum, with initial targets at 85.55 USD and an extended target of 98.65 USD. An additional bullish signal would be a breakout on the RSI resistance line. Conversely, a decline below the key support of 60.55 USD could indicate a bearish reversal, potentially pushing the stock down to 46.55 USD.
Investors should closely monitor Marvell's performance as it navigates through these growth phases, particularly its emphasis on AI and electro-optical products. The upcoming quarterly results and market reactions will provide further insights into the stock's trajectory. Gap Anticipates Revenue Growth in Q2 ReportGap Inc., a leading global retailer, is poised to release its Q2 earnings report after today's market close, projecting a revenue increase to 3.63 billion USD, marking a 2% rise from the previous year. The company also anticipates an increase in earnings per share to 0.40 USD, up by 0.06 USD from last year. Additionally, preliminary data suggest a nearly 3% growth in same-store sales. Since the start of the year, Gap's stock has seen a moderate increase of 11%, and a positive quarterly report could further catalyse the stock's upward trajectory.
Technical analysis of The Gap, Inc. (NYSE: GAP)
Exploring potential trading opportunities based on the technical setup of Gap's stock ahead of its earnings announcement:
Timeframe : Four-hour (H4)
Current Trend : the stock is exhibiting an upward trend within an ascending price channel on the H4 chart
Short-term Target : the immediate upside target is positioned at the resistance level of 25.40 USD
Medium-term Target : breaking past the 25.40 USD resistance could lead to further price appreciation towards the yearly high of 30.74 USD
Key Support : currently established at 22.24 USD
Reversal Scenario : should the stock breach the key support level at $22.24, it would negate the bullish outlook, potentially driving prices down to around 20.00 USD
Market outlook
Gap Inc. shares are currently trading near the support line of the ascending price channel. A robust earnings report could provide the necessary momentum for the stock to continue its upward movement, possibly approaching annual highs near 30.00 USD. Investors and traders should closely monitor the reaction to the post-earnings which will likely set the tone for the stock's short-to-medium-term trajectory. A positive outcome could reinforce the bullish trend, while any negative surprises might prompt a reassessment of the stock's growth prospects.
—
Ideas and other content presented on this page should not be considered as guidance for trading or an investment advice. RoboMarkets bears no responsibility for trading results based on trading opinions described in these analytical reviews.
The material presented and the information contained herein is for information purposes only and in no way should be considered as the provision of investment advice for the purposes of Investment Firms Law L. 87(I)/2017 of the Republic of Cyprus or any other form of personal advice or recommendation, which relates to certain types of transactions with certain types of financial instruments.
Risk Warning: CFDs are complex instruments and come with a high risk of losing money rapidly due to leverage. 65.68% of retail investor accounts lose money when trading CFDs with this provider. You should consider whether you understand how CFDs work and whether you can afford to take the high risk of losing your money. IBM reaches all-time highs amid strategic shiftsIBM captured significant attention in August 2024, driven by pivotal developments that underscore the company’s strategic realignment and technological innovation. The decision to close its research and development centre in China, which will impact over 1,000 employees, is part of a broader global restructuring aimed at sharpening its focus on burgeoning sectors like artificial intelligence (AI) and cloud technology. This move reflects IBM's commitment to consolidating its resources towards high-growth areas.
Adding to the momentum, IBM's presentation at the Hot Chips 2024 conference showcased its latest advancements in processor technology. The introduction of the Telum II processor and Spyre gas pedal marks a significant leap in computing power and energy efficiency, particularly for AI tasks, which are becoming increasingly crucial across industries.
These initiatives indicate IBM's ongoing efforts to fortify its leadership in AI and cloud technologies, signalling a future solid trajectory despite the reductions in other operational areas.
Technical analysis of International Business Machines Corp. (NYSE: IBM)
Exploring potential trading opportunities based on the current technical indicators of IBM's stock:
Timeframe : Hourly (H1)
Current Trend : the daily trend is upward, with the hourly chart showing a correction phase following extended growth
Short-term Target : immediate resistance is at 194.50 USD, which is the current target of the correction phase
Medium-term Target : a break above the resistance at 199.00 USD could pave the way for a rise to 210.00 USD
Key Support : positioned at 194.50 USD
Reversal Scenario : a break below key support at 194.50 USD could negate the bullish outlook, potentially leading to a decline towards 193.50 USD
IBM's shares are experiencing robust growth, hitting all-time highs. The stock's trajectory suggests that with the continuation of a favourable economic environment, there is potential to breach the 210.00 USD mark and achieve further gains. Investors and traders should monitor these levels closely as IBM continues to navigate strategic transitions and capitalise on its technological advancements.
—
Ideas and other content presented on this page should not be considered as guidance for trading or an investment advice. RoboMarkets bears no responsibility for trading results based on trading opinions described in these analytical reviews.
The material presented and the information contained herein is for information purposes only and in no way should be considered as the provision of investment advice for the purposes of Investment Firms Law L. 87(I)/2017 of the Republic of Cyprus or any other form of personal advice or recommendation, which relates to certain types of transactions with certain types of financial instruments.
Risk Warning: CFDs are complex instruments and come with a high risk of losing money rapidly due to leverage. 65.68% of retail investor accounts lose money when trading CFDs with this provider. You should consider whether you understand how CFDs work and whether you can afford to take the high risk of losing your money. ExxonMobil projects stability in global oil demand through 2050ExxonMobil has released a report projecting that global oil demand will remain stable until 2050 despite the accelerating shift towards renewable energy sources. According to ExxonMobil, oil demand is expected to stabilise after 2030, maintaining levels above 100 million barrels per day, closely aligning with the current 102.2 million barrels per day. This forecast starkly contrasts with its competitor, BP, which anticipates a decline to 75 million barrels per day by 2050.
The report highlights that petroleum products will continue to play a critical role in industrial processes and heavy transportation sectors such as shipping, trucking, and aviation. Moreover, ExxonMobil notes that despite the increased adoption of electric vehicles and other renewable energy resources, oil and natural gas are projected to constitute over half of the global energy mix by 2050. This outlook supports an optimistic long-term scenario for ExxonMobil's core oil and gas operations.
Technical analysis of Exxon Mobil Corporation (NYSE: XOM)
Reviewing potential trading strategies based on the technical setup of ExxonMobil's stock:
Timeframe : Daily (D1)
Current trend : the stock is trending upward within an ascending channel, having recently rebounded from the support level at 114.00 USD and approaching a critical resistance at 120.00 USD
Short-term target : the immediate upside target lies at the resistance level of 123.65 USD
Medium-term target : a breach of the 123.65 USD resistance could pave the way for further gains towards 127.60 USD
Key support : positioned at 114.00 USD
Reversal indicator : if the stock breaks below the key support at 114.00 USD, it will negate the current bullish scenario, potentially driving prices down to 108.45 USD
ExxonMobil's shares currently benefit from positive momentum, having broken the upper boundary of a descending channel. A successful breach of the key resistance at 120.00 USD would signify an exit from a Triangle pattern, potentially strengthening the bullish momentum with a target at 127.60 USD, aligned with the pattern's projected outcome.
Investors should closely monitor ExxonMobil's movements, especially in light of its optimistic oil demand forecast and the potential impact on its stock price in the context of prevailing market dynamics and energy sector trends.
—
Ideas and other content presented on this page should not be considered as guidance for trading or an investment advice. RoboMarkets bears no responsibility for trading results based on trading opinions described in these analytical reviews.
The material presented and the information contained herein is for information purposes only and in no way should be considered as the provision of investment advice for the purposes of Investment Firms Law L. 87(I)/2017 of the Republic of Cyprus or any other form of personal advice or recommendation, which relates to certain types of transactions with certain types of financial instruments.
Risk Warning: CFDs are complex instruments and come with a high risk of losing money rapidly due to leverage. 65.68% of retail investor accounts lose money when trading CFDs with this provider. You should consider whether you understand how CFDs work and whether you can afford to take the high risk of losing your money. NVDA: The market anticipates Nvidia's Q2 earnings reportInvestors and analysts are keenly focused on Nvidia Corporation as it prepares to release its Q2 earnings this Wednesday. Nvidia, a powerhouse in the artificial intelligence industry, has been at the forefront of producing cutting-edge chips for data centres, which is crucial for developing AI models. The company's products are in high demand, serving a diverse customer base from tech behemoths like Microsoft to innovative startups like OpenAI.
For the second quarter, Nvidia's management has projected a staggering 28 billion USD in total revenue, following a robust Q1 performance during which the company garnered 26 billion USD, surpassing its initial 24 billion USD forecast. The market is optimistic, anticipating that the Q2 results might exceed expectations, similar to the previous quarter.
Technical analysis of NVIDIA Corporation (NASDAQ: NVDA)
Exploring potential trading opportunities based on Nvidia's stock performance ahead of the earnings report:
Timeframe : Hourly (H1)
Current trend : the stock is showing an upward trend on a daily scale, with prices consolidating in a narrow range on the hourly chart as the market waits for the earnings announcement
Short-term target : the immediate upside target is set at the resistance level of 130.00 USD
Medium-term target : breaking past the 130.00 USD resistance could open the pathway to further gains, potentially reaching the yearly high of around 140.00 USD
Key support : currently established at 123.00 USD
Reversal scenario : if the price drops below the critical support level at 123.00 USD, it could negate the bullish outlook and lead to a potential decline towards the next support level around 115.00 USD
Market impact
The upcoming earnings report from Nvidia is poised to influence market sentiment significantly and could catalyse movements across the broader US stock market. A report surpassing expectations may propel Nvidia's stock and lift broader market indices, while a disappointing outcome could trigger a corrective phase in Nvidia shares and dampen market sentiments. Investors should stay tuned for the earnings release, which will provide critical insights into Nvidia's financial health and its impact on stock market dynamics.
—
Ideas and other content presented on this page should not be considered as guidance for trading or an investment advice. RoboMarkets bears no responsibility for trading results based on trading opinions described in these analytical reviews.
The material presented and the information contained herein is for information purposes only and in no way should be considered as the provision of investment advice for the purposes of Investment Firms Law L. 87(I)/2017 of the Republic of Cyprus or any other form of personal advice or recommendation, which relates to certain types of transactions with certain types of financial instruments.
Risk Warning: CFDs are complex instruments and come with a high risk of losing money rapidly due to leverage. 65.68% of retail investor accounts lose money when trading CFDs with this provider. You should consider whether you understand how CFDs work and whether you can afford to take the high risk of losing your money. Lucid Motors' shares surge 37% following major investmentLucid Motors has seen a remarkable 37% increase in stock value following a significant 1.5 billion USD investment from the Saudi Arabian Public Investment Fund, a principal shareholder. This influx of capital is pivotal as it supports the launch and development of Lucid's new electric vehicle, the Lucid Gravity. The investment enhances Lucid Motors' financial stability and liquidity, which are crucial for the continued innovation and production of their next model and building on the success of Lucid Air.
Lucid Gravity targets the burgeoning market for electric SUVs, combining premium quality with an electric powertrain – a rapidly growing consumer preference. With this strategic financial backing, Lucid is well-positioned to capture a significant market share in this segment.
Technical analysis of Lucid Group Inc (NASDAQ: LCID)
Analysing the potential trading opportunities based on the technical indicators of Lucid's stock:
Timeframe : Daily (D1)
Current trend : The stock has shown a strong upward movement, breaking past the resistance at 3.60 USD, which now serves as a new support level
Short-term target : The immediate upside target lies at the resistance level of 4.25 USD
Medium-term target : Should the stock surpass the 4.25 USD resistance, the next significant target could be at 5.00 USD
Key support level : 2.90 USD, which the stock recently rebounded from significantly
Growth scenario cancellation : If the stock breaks below the key support at 2.90 USD, it could negate the bullish scenario and potentially lead to a decline toward 2.50 USD
Given that Lucid's shares have previously reached as high as 60 USD in 2021, the current price levels suggest a substantial growth potential if the company can capitalise on its recent investments and market trends favourably. The recent rebound from the 2.90 USD support could begin a long-term uptrend for Lucid Group shares, especially as the company continues expanding its electric vehicle offerings.
—
Ideas and other content presented on this page should not be considered as guidance for trading or an investment advice. RoboMarkets bears no responsibility for trading results based on trading opinions described in these analytical reviews.
The material presented and the information contained herein is for information purposes only and in no way should be considered as the provision of investment advice for the purposes of Investment Firms Law L. 87(I)/2017 of the Republic of Cyprus or any other form of personal advice or recommendation, which relates to certain types of transactions with certain types of financial instruments.
Risk Warning: CFDs are complex instruments and come with a high risk of losing money rapidly due to leverage. 65.68% of retail investor accounts lose money when trading CFDs with this provider. You should consider whether you understand how CFDs work and whether you can afford to take the high risk of losing your money.
PayPal’s stock climbs following strategic partnership with AdyenPayPal Holdings, Inc. has entered into a promising partnership with the Dutch payment company Adyen, introducing the innovative Fastlane feature to streamline the checkout process for corporate and marketplace customers in the US. This collaboration is poised to significantly boost PayPal’s revenue, potentially adding 1-1.5 billion USD to its transaction margin. This strategic alliance strengthens PayPal’s competitive edge in the online payments sector and sets the stage for expansion both in the US and globally.
Financial experts project a potential increase in PayPal’s stock value, targeting a near-term price of 90 USD, bolstered by the operational benefits and enhanced market positioning derived from the partnership with Adyen.
Technical analysis of PayPal Holdings, Inc. (NASDAQ: PYPL)
Examining potential trading opportunities based on recent movements in PayPal’s stock:
Timeframe : Daily (D1)
Current trend : the stock has exited the descending channel present since mid-2022, signalling a potential end to the medium-term bearish trend
Key resistance level : initially at 68.00 USD, which has been surpassed with consolidation above this point
First target : 78.00 USD, with a breakout above this level potentially leading towards 90.00 USD
RSI indicator : the breakdown of the resistance line on the RSI supports a bullish outlook
Potential negative scenario : a drop below 55.00 USD could signal a re-entry into the descending channel, possibly leading to a further decline towards 45.00 USD
Investors should closely monitor PayPal, particularly in light of its strategic manoeuvres and the potential for increased market share driven by the partnership with Adyen. While technical indicators suggest a bullish outlook, vigilance is advised due to the possibility of fluctuations that could test new support levels.
—
Ideas and other content presented on this page should not be considered as guidance for trading or an investment advice. RoboMarkets bears no responsibility for trading results based on trading opinions described in these analytical reviews.
The material presented and the information contained herein is for information purposes only and in no way should be considered as the provision of investment advice for the purposes of Investment Firms Law L. 87(I)/2017 of the Republic of Cyprus or any other form of personal advice or recommendation, which relates to certain types of transactions with certain types of financial instruments.
Risk Warning: CFDs are complex instruments and come with a high risk of losing money rapidly due to leverage. 65.68% of retail investor accounts lose money when trading CFDs with this provider. You should consider whether you understand how CFDs work and whether you can afford to take the high risk of losing your money. General Motors initiates downsizing in China amid market shiftsGeneral Motors (GM) is undergoing a significant restructuring of its operations in China in response to declining sales and intense competition from local manufacturers. As part of its strategic adjustments, GM has started to reduce its workforce, particularly in departments focused on the Chinese market, such as research and development. These changes are unfolding as GM plans to meet with its local partner, SAIC, to discuss further capacity reductions and a broader reorganisation of its business strategies in China.
The automotive giant's reorientation towards electric vehicle production and the focus on higher-priced and premium imported models come as the company grapples with the challenges posed by an oversaturated auto market in China. This strategic pivot is aimed at revitalizing GM's brand presence and competitiveness in the world’s largest auto market.
Technical analysis of General Motors (NYSE: GM)
Exploring potential trading opportunities based on the current technical setup of General Motors' stock:
Timeframe : Daily (D1)
Current trend : the stock is currently in an uptrend, with recent activity testing the support line.
Resistance : 45.05 USD
Support : 39.00 USD
Potential downtrend target : should the trend reverse into a downtrend, the downside target could be set at 34.50 USD.
Short-term target : if the uptrend persists and the stock breaks through the resistance at 45.05 USD, a short-term target could be 50.05 USD.
Medium-term target : with sustained positive momentum, the stock price might aim for 55.50 USD.
General Motors' performance, particularly amid ongoing organizational changes and strategic shifts in China, warrants close attention. The company's efforts to adapt to the evolving automotive industry and transition towards electric vehicles could have a substantial impact on its market position and stock performance.
—
Ideas and other content presented on this page should not be considered as guidance for trading or an investment advice. RoboMarkets bears no responsibility for trading results based on trading opinions described in these analytical reviews.
The material presented and the information contained herein is for information purposes only and in no way should be considered as the provision of investment advice for the purposes of Investment Firms Law L. 87(I)/2017 of the Republic of Cyprus or any other form of personal advice or recommendation, which relates to certain types of transactions with certain types of financial instruments.
Risk Warning: CFDs are complex instruments and come with a high risk of losing money rapidly due to leverage. 65.68% of retail investor accounts lose money when trading CFDs with this provider. You should consider whether you understand how CFDs work and whether you can afford to take the high risk of losing your money. Nu Holdings reports strong Q2 earnings, shares surgeNu Holdings Ltd., a leading digital banking player globally, saw its stock prices rise following an impressive second-quarter earnings report . The company's profits more than doubled compared to the previous year, an achievement that has significantly offset concerns about increasing loan delinquency rates and a reduction in bad loan provisions.
Operating predominantly in Brazil, Mexico, and Colombia, Nu Holdings boasts a customer base exceeding 100 million, covering 55% of Brazil's adult population. Known as Nubank, the company operates without physical branches, leveraging a cloud-based platform optimized for mobile devices. For the quarter, Nu recorded revenues of USD 2.8 billion, surpassing the average analyst estimate of USD 2.66 billion, according to a Bloomberg survey.
Technical analysis of Nu Holdings Ltd. (NYSE: NU)
Examining potential trading opportunities based on the current technical landscape of Nu Holdings' stock:
Timeframe : Daily (D1)
Current trend : the stock is currently in an uptrend, with the quotes recently reaffirming support above the support line
Resistance : the resistance at 12.30 USD has been broken
Support : support has solidified at 9.65 USD
Potential downtrend target : should the trend reverse to a downtrend, the downside target could be set at 7.50 USD
Short-term target : if the uptrend persists and continues beyond the current resistance, a short-term target could be 14.35 USD
Medium-term target : with continued momentum, the stock price might aim for 15.50 USD
Investors and traders should monitor Nu Holdings closely, especially in light of its strong quarterly performance and its strategic position in the growing digital banking sector. The company's innovative approach and expansive market coverage in key Latin American countries position it well for sustained growth, which is reflected in the positive trajectory of its stock price.
—
Ideas and other content presented on this page should not be considered as guidance for trading or an investment advice. RoboMarkets bears no responsibility for trading results based on trading opinions described in these analytical reviews.
The material presented and the information contained herein is for information purposes only and in no way should be considered as the provision of investment advice for the purposes of Investment Firms Law L. 87(I)/2017 of the Republic of Cyprus or any other form of personal advice or recommendation, which relates to certain types of transactions with certain types of financial instruments.
Risk Warning: CFDs are complex instruments and come with a high risk of losing money rapidly due to leverage. 65.68% of retail investor accounts lose money when trading CFDs with this provider. You should consider whether you understand how CFDs work and whether you can afford to take the high risk of losing your money. EPAM Systems focuses on AI and cloud technologiesEPAM Systems Inc., a global provider of software and cloud services, recently disclosed its Q2 2024 earnings, presenting a mix of challenges and strategic advancements. Despite experiencing a decline in revenue and profit, EPAM has surpassed its forecasts, signalling resilience and potential for recovery. The company, known for its digital platform design, consulting, and software development services, increasingly focuses on artificial intelligence (AI) and cloud technologies to adapt to market demands and fuel long-term growth.
EPAM's strategy to enhance its AI and cloud services offerings aims to leverage these technologies to maintain a competitive edge. The company benefits from a diversified customer portfolio and a skilled workforce, which are crucial as it navigates uncertain market conditions. For investors, the key will be to monitor how EPAM utilises its technological capabilities in AI and cloud services to drive future growth and address ongoing market challenges.
Technical analysis of EPAM Systems Inc. (NYSE: EPAM)
Exploring potential trading opportunities based on the current technical setup of EPAM Systems' stock:
Timeframe : Daily (D1)
Current trend : the stock is currently in a downtrend but shows signs of potentially shifting to an uptrend
Resistance : 222.75 USD
Support : 179.90 USD
Potential downtrend target: if the downtrend persists, the downside target could be at 140.00 USD
Short-term target : if the trend reverses and the stock breaks through the resistance at 222.75 USD, a short-term target could be set at 250.00 USD
Medium-term target : with sustained upward momentum, the stock price might aim for 275.00 USD
Investors should keep a close eye on EPAM, particularly given its strategic emphasis on AI and cloud technologies. This focus could be crucial to the company's ability to rebound and thrive in a technological landscape.
—
Ideas and other content presented on this page should not be considered as guidance for trading or an investment advice. RoboMarkets bears no responsibility for trading results based on trading opinions described in these analytical reviews.
The material presented and the information contained herein is for information purposes only and in no way should be considered as the provision of investment advice for the purposes of Investment Firms Law L. 87(I)/2017 of the Republic of Cyprus or any other form of personal advice or recommendation, which relates to certain types of transactions with certain types of financial instruments.
Risk Warning: CFDs are complex instruments and come with a high risk of losing money rapidly due to leverage. 65.68% of retail investor accounts lose money when trading CFDs with this provider. You should consider whether you understand how CFDs work and whether you can afford to take the high risk of losing your money. SoundHound AI reports record revenue growth in Q2SoundHound AI Inc. has demonstrated a significant uptick in its financial performance with a strong Q2 earnings report , a testament to its economic stability. Sounhound AI not only posted record revenue, but also maintained a robust cash reserve, signalling healthy operational stamina and potential for further growth. This performance is underpinned by the promising prospects of expanding applications for its voice technology software.
In the last quarter, SoundHound AI's revenue surged 54% year-over-year to 13.5 million USD, while its GAAP gross margin stood at 63%. The company's total subscriptions and order book roughly doubled from the previous year. Despite these gains, SoundHound reported a net loss of 37.3 USD million or 0.11 USD per share. SoundHound's recent acquisition of Amélia, a firm specialising in conversational AI technologies, also positions it to venture into new sectors such as finance, insurance, and healthcare, promising further diversification and revenue streams.
Technical analysis of SoundHound AI Inc. (NASDAQ: SOUN)
Exploring potential trading opportunities based on the current technical landscape of SoundHound AI's stock:
Timeframe : Daily (D1)
Current trend : the stock shows a sideways channel formation with an emerging uptrend
Resistance level : 5.30 USD
Support level : 3.95 USD
Potential downtrend target : should a downtrend take hold, the downside target could be at 2.40 USD
Short-term target : if the uptrend gains momentum and the stock breaks through the resistance at 5.30 USD, a short-term target could be 6.45 USD
Medium-term target : with sustained positive movement, the stock price might target 7.95 USD
A strategic acquisition and the potential to enter new markets could significantly impact SoundHound AI's stock performance and valuation. Investors should monitor SoundHound AI closely, especially considering its proven ability to leverage its technological innovations in conversational AI across various industries.
—
Ideas and other content presented on this page should not be considered as guidance for trading or an investment advice. RoboMarkets bears no responsibility for trading results based on trading opinions described in these analytical reviews.
The material presented and the information contained herein is for information purposes only and in no way should be considered as the provision of investment advice for the purposes of Investment Firms Law L. 87(I)/2017 of the Republic of Cyprus or any other form of personal advice or recommendation, which relates to certain types of transactions with certain types of financial instruments.
Risk Warning: CFDs are complex instruments and come with a high risk of losing money rapidly due to leverage. 65.68% of retail investor accounts lose money when trading CFDs with this provider. You should consider whether you understand how CFDs work and whether you can afford to take the high risk of losing your money. Apple to introduce paid AI features, eyeing revenue boostApple Inc. is reportedly considering charging users up to 20 USD for advanced artificial intelligence features under its new initiative, Apple Intelligence. This strategic move aims to bolster the company's revenue streams by leveraging its technological advancements. Slated to be rolled out on some devices later this year, Apple Intelligence plans to enhance Siri's capabilities and introduce functionalities such as automated email and image generation.
However, the rollout will be gradual, with some regions like China and Europe initially excluded from accessing the new features. This phased approach and potential subscription models for advanced applications align with Apple's long-term strategy to diversify its revenue sources beyond hardware sales.
Technical analysis of Apple Inc. (NASDAQ: AAPL)
Reviewing potential trading scenarios based on Apple's current stock dynamics:
Timeframe : Daily (D1)
Current trend : the stock is currently in a downtrend but shows signs that it could transition to an uptrend
Resistance level : 225.60 USD
Support level : 201.05 USD
Potential downtrend target : if the downtrend continues, the downside target could be 185.00 USD
Short-term target : if the stock reverses its current trend and breaks through the resistance at 225.60 USD, a short-term target could be set at 235.00 USD
Medium-term target : with sustained positive momentum, the stock price might aim for 250.00 USD
Investors should keep a close eye on Apple, particularly in light of its strategic push to monetise AI capabilities. This development could significantly impact consumer behaviour and market dynamics, potentially influencing Apple's stock trajectory as the company continues to innovate and expand its software and service offerings.
—
Ideas and other content presented on this page should not be considered as guidance for trading or an investment advice. RoboMarkets bears no responsibility for trading results based on trading opinions described in these analytical reviews.
The material presented and the information contained herein is for information purposes only and in no way should be considered as the provision of investment advice for the purposes of Investment Firms Law L. 87(I)/2017 of the Republic of Cyprus or any other form of personal advice or recommendation, which relates to certain types of transactions with certain types of financial instruments.
Risk Warning: CFDs are complex instruments and come with a high risk of losing money rapidly due to leverage. 65.68% of retail investor accounts lose money when trading CFDs with this provider. You should consider whether you understand how CFDs work and whether you can afford to take the high risk of losing your money. Netflix reports continued revenue growth amid strategic shiftsNetflix Inc. has once again demonstrated a robust increase in revenue, confirming the effectiveness of its strategic initiatives aimed at boosting subscriber growth. A significant aspect of Netflix's strategy has been tightening rules against account sharing and introducing cheaper, ad-supported subscription plans. These measures have attracted new subscribers successfully, particularly those sensitive to price, leading to sustained revenue growth over several quarters.
For Q3, Netflix projects its revenue to reach 9.73 billion USD, marking a 13.9% increase year-on-year. Earnings are expected to rise by 36.7%, reaching 5.1 USD per share. Netflix's heavy investment in new original projects and securing rights to popular existing content is a key part of its growth strategy, positioning the company well for future success.
Technical analysis of Netflix Inc. (NASDAQ: NFLX)
Here is an analysis of potential trading opportunities based on Netflix's current stock performance:
Timeframe : Daily (D1)
Current trend : the stock is in a downtrend but shows potential for reversing into an uptrend
Resistance level : 633.60 USD
Support level : 587.05 USD
Potential downtrend target : if the downtrend persists, the next target could be around 540.00 USD
Short-term target : if the trend reverses and breaks through the resistance at 633.60 USD, a short-term target could be set at 675.00 USD
Medium-term target : with continued positive momentum, the stock price might aim for 700.00 USD
Investors and traders should closely monitor Netflix, particularly given its proactive measures to increase its subscriber base and revenue. The company's focus on content creation and adaptation to market demands plays a critical role in its ongoing success. If these strategies continue to prove effective, they could drive its stock performance upward.
—
Ideas and other content presented on this page should not be considered as guidance for trading or an investment advice. RoboMarkets bears no responsibility for trading results based on trading opinions described in these analytical reviews.
The material presented and the information contained herein is for information purposes only and in no way should be considered as the provision of investment advice for the purposes of Investment Firms Law L. 87(I)/2017 of the Republic of Cyprus or any other form of personal advice or recommendation, which relates to certain types of transactions with certain types of financial instruments. IonQ secures government contract for quantum security projectIonQ, Inc., a leader in quantum computing technology, has been awarded a pivotal 40 million USD contract by the Applied Research Laboratory for Intelligence and Security (ARLIS) in the US, in line with the Pentagon's major initiative in quantum security. This contract potentially positions IonQ to lead in this high-stakes area for years to come. It also sparks anticipation as the company gears up to integrate its quantum computing capabilities into various research projects for the US military and intelligence community.
Quantum computers offer groundbreaking capabilities, crucial for defence agencies These include advanced logistics planning, the potential to decrypt currently secure communications, and enhancing the efficiency of complex AI algorithms. This strategic deployment underscores quantum technology's critical role in national security.
Technical analysis of IonQ, Inc. (NYSE: IONQ)
Examining potential trading opportunities based on the current technical setup of IonQ's stock:
Timeframe : Daily (D1)
Current trend : the stock is in a downtrend, but recent developments may signal a potential shift towards an uptrend
Resistance level : 8.45 USD
Support level : 6.20 USD
Potential downtrend target : if the downtrend persists, the downside target could be set at 4.30 USD
Short-term target : if the trend reverses and the stock breaks through the resistance at 8.45 USD, a short-term target could be 10.00 USD
Medium-term target : with sustained positive momentum, the stock price might aim for 12.05 USD
The recent government contract could significantly impact IonQ's market position and improve its prospects. Integrating IonQ's quantum technologies into defence projects strengthens the company's credibility and lays a solid foundation for future growth in the rapidly developing field of quantum computing.
—
Ideas and other content presented on this page should not be considered as guidance for trading or an investment advice. RoboMarkets bears no responsibility for trading results based on trading opinions described in these analytical reviews.
The material presented and the information contained herein is for information purposes only and in no way should be considered as the provision of investment advice for the purposes of Investment Firms Law L. 87(I)/2017 of the Republic of Cyprus or any other form of personal advice or recommendation, which relates to certain types of transactions with certain types of financial instruments.
Risk Warning: CFDs are complex instruments and come with a high risk of losing money rapidly due to leverage. 65.68% of retail investor accounts lose money when trading CFDs with this provider. You should consider whether you understand how CFDs work and whether you can afford to take the high risk of losing your money. Wix.com partners with Google to resell generative AI toolsWix.com Ltd., known for its website-building solutions, has announced a landmark partnership with Google. This collaboration positions it as the first third-party reseller of Google's new Gemini generative artificial intelligence (AI) technology integrated into Google Workspace. This strategic move will potentially revolutionise how users interact with digital content creation tools within Google's ecosystem.
Additionally, Wix launched its own generative AI technology in July 2024. This technology is tailored to generate blog topics and craft nearly complete content across various subjects. Wix anticipates that its AI tool will complement its existing website-building services, particularly benefiting long-standing websites seeking to refresh or expand their content dynamically.
Technical analysis of Wix.com Ltd. (NASDAQ: WIX)
Exploring potential trading opportunities based on the current technical setup of Wix's stock:
Timeframe : Daily (D1)
Current trend : the stock is in an uptrend, maintaining its momentum even after a significant correction on Monday
Resistance level : 159.70 USD
Support level : 141.75 USD
Potential downtrend target : should the trend reverse, the downside target could be set at 119.05 USD
Short-term target : if the uptrend continues and the stock breaks through the resistance at 159.70 USD, a short-term target could be 178.50 USD
Medium-term target : with sustained upward momentum, the stock price might aim for 205.00 USD
Wix.com's new role as a reseller of artificial intelligence tools and a Google partner will not only expand Wix's product offering but also strengthen its position in the competitive digital content and website creation market. The potential for increased demand for Wix's services, fuelled by its innovative artificial intelligence solutions, could be reflected in its share price.
—
Ideas and other content presented on this page should not be considered as guidance for trading or an investment advice. RoboMarkets bears no responsibility for trading results based on trading opinions described in these analytical reviews.
The material presented and the information contained herein is for information purposes only and in no way should be considered as the provision of investment advice for the purposes of Investment Firms Law L. 87(I)/2017 of the Republic of Cyprus or any other form of personal advice or recommendation, which relates to certain types of transactions with certain types of financial instruments.
Risk Warning: CFDs are complex instruments and come with a high risk of losing money rapidly due to leverage. 65.68% of retail investor accounts lose money when trading CFDs with this provider. You should consider whether you understand how CFDs work and whether you can afford to take the high risk of losing your money. AAPL: Warren Buffett accelerates sale of Apple sharesBerkshire Hathaway, led by Warren Buffett, has dramatically reduced its holdings in Apple Inc., marking a significant shift in its investment strategy. Over the past seven quarters, Berkshire has been consistently selling off its Apple shares, with the process intensifying in the second quarter of 2024. During this period, Buffett disposed of over USD 75 billion in stocks, including a substantial portion of his Apple holdings, reducing Berkshire’s stake in Apple from 789 million shares at the end of Q1 to 400 million.
The massive sell-off contributed to Berkshire Hathaway’s cash reserves reaching a record high of USD 276.9 billion. Buffett’s strategic move reflects broader market sentiments, where investors are increasingly cautious, favouring the security of high-yield US government bonds amid expectations of a rate cut by the Federal Reserve.
Technical analysis of Apple Inc. (NASDAQ: AAPL)
Reviewing Apple’s stock performance in light of recent developments:
Timeframe : Daily (D1)
Current trend: the stock is in a downtrend, exacerbated by the negative sentiment pervading the stock market and Buffett’s significant sell-off
Resistance level : 225.60 USD
Support level : the previous support at 214.50 USD has been breached
Short-term target : if the downtrend continues, the next target could be 181.45 USD following a rebound from the broken support
Medium-term target : a continued decline might see the stock reaching 172.70 USD
Potential uptrend scenario : if market conditions improve and the stock reverses its current trend, a potential growth target could be set at 235.00 USD
Investors and market watchers should closely monitor Apple’s stock, particularly in the context of Berkshire Hathaway’s reduced exposure and broader market dynamics. A significant divestment by a major investor like Buffett could influence other stakeholders and affect Apple’s stock performance in the near to medium term.
—
Ideas and other content presented on this page should not be considered as guidance for trading or an investment advice. RoboMarkets bears no responsibility for trading results based on trading opinions described in these analytical reviews.
The material presented and the information contained herein is for information purposes only and in no way should be considered as the provision of investment advice for the purposes of Investment Firms Law L. 87(I)/2017 of the Republic of Cyprus or any other form of personal advice or recommendation, which relates to certain types of transactions with certain types of financial instruments.
Risk Warning: CFDs are complex instruments and come with a high risk of losing money rapidly due to leverage. 65.68% of retail investor accounts lose money when trading CFDs with this provider. You should consider whether you understand how CFDs work and whether you can afford to take the high risk of losing your money. Nvidia under investigation by DOJ over competitive practicesNvidia, a leader in the artificial intelligence processor market, is under investigation by the US Department of Justice (DOJ). The probe, reported by The Information, focuses on allegations that Nvidia may have engaged in anti-competitive practices to maintain its market dominance. Specific concerns include potential restrictions placed on competition through product bundling and aggressive strategies aimed at deterring customers from engaging with competitors.
The investigation extends to accusations that Nvidia pressured cloud service providers into purchasing combinations of products, such as A100 or H100 GPUs and Mellanox-branded networking equipment, which could limit customer choices. Furthermore, the DOJ is scrutinising whether Nvidia imposed higher prices on networking equipment for customers who opted for AI processors from competitors like AMD and Intel.
Technical analysis of NVIDIA Corp. (NASDAQ: NVDA)
Here follows a review of NVIDIA's stock performance for potential trading opportunities:
Timeframe : Daily (D1)
Current trend : the stock is currently in a downtrend, influenced by broader market negativity and the recent allegations
Resistance level : 118.80 USD
Support level : 102.40 USD
Short-term target : if the downtrend continues and the support at 102.40 USD is breached, a short-term target could be set at 88.00 USD
Medium-term target : with further negative momentum, the price could potentially decline to 75.50 USD
Potential uptrend scenario : if market sentiment improves and Nvidia manages to navigate the investigation without significant damage, an uptrend could see the stock rise towards 130.00 USD
Investors and traders should closely monitor the developments of this DOJ investigation, as it could significantly impact Nvidia's business practices and market positioning. The outcome could have long-term implications for Nvidia's operations and its relationship with customers and competitors in the highly competitive AI processor market.
—
Ideas and other content presented on this page should not be considered as guidance for trading or an investment advice. RoboMarkets bears no responsibility for trading results based on trading opinions described in these analytical reviews.
The material presented and the information contained herein is for information purposes only and in no way should be considered as the provision of investment advice for the purposes of Investment Firms Law L. 87(I)/2017 of the Republic of Cyprus or any other form of personal advice or recommendation, which relates to certain types of transactions with certain types of financial instruments.
Risk Warning: CFDs are complex instruments and come with a high risk of losing money rapidly due to leverage. 65.68% of retail investor accounts lose money when trading CFDs with this provider. You should consider whether you understand how CFDs work and whether you can afford to take the high risk of losing your money. AMD surpasses expectations and raises AI chip sales for 2024Advanced Micro Devices (AMD) reported impressive quarterly results, beating analysts' expectations and raising its revenue forecast for artificial intelligence (AI) chips through 2024. According to the company's projections, demand for AI chips will outstrip supply through 2025, indicating a sustainable growth trajectory for AMD's key business segments.
For Q3 2024, AMD forecasts revenue of 6.7 billion USD, which aligns with LSEG analysts' average estimate of 6.61 billion USD. This projection is supported by the recovery of the PC market, which is experiencing a resurgence after a significant downturn. Integrating new artificial intelligence features is expected to boost consumer demand further.
In the data centre segment, AMD's largest division, revenue in Q2 rose 115% to 2.8 billion USD, exceeding expectations of 2.79 billion USD. Notably, quarterly revenue from artificial intelligence chips in this segment surpassed the 1 billion USD mark for the first time. Overall, AMD's revenue in the second quarter grew by 9% to 5.8 billion USD, exceeding the forecasted 5.72 billion USD.
Technical analysis of Advanced Micro Devices (NASDAQ: AMD)
Exploring potential trading opportunities based on AMD's stock performance:
Timeframe : Daily (D1)
Current trend : the stock is in a downtrend, but recent strong earnings and positive forecasts may catalyse a shift to an uptrend
Resistance level : 153.60 USD
Support level : previously at 138.60 USD, which has now been breached
Potential downtrend target : if the downtrend persists, the downside target could be at 117.50 USD
Short-term target : if the trend reverses and the stock returns above the previous support level, a short-term target could be 174.60 USD
Medium-term target : with sustained positive momentum, the stock price might aim for 188.50 USD
Investors and traders should keep a close eye on AMD, especially as the company capitalises on the growing demand for artificial intelligence chips and benefits from the recovery of the PC market. AMD's strategic focus on artificial intelligence and data centres sets it apart from its competitors, which may further boost the stock.
—
Ideas and other content presented on this page should not be considered as guidance for trading or an investment advice. RoboMarkets bears no responsibility for trading results based on trading opinions described in these analytical reviews.
The material presented and the information contained herein is for information purposes only and in no way should be considered as the provision of investment advice for the purposes of Investment Firms Law L. 87(I)/2017 of the Republic of Cyprus or any other form of personal advice or recommendation, which relates to certain types of transactions with certain types of financial instruments.
Risk Warning: CFDs are complex instruments and come with a high risk of losing money rapidly due to leverage. 65.68% of retail investor accounts lose money when trading CFDs with this provider. You should consider whether you understand how CFDs work and whether you can afford to take the high risk of losing your money. Commvault Systems Inc. releases strong fiscal Q1 2025 reportCommvault Systems Inc. has reported a robust Q1 for fiscal year 2025, showcasing significant growth in revenue and recurring earnings. The company, known for its data backup and recovery tools, is seeing increased demand as these solutions prove crucial for protecting IT infrastructure against failures and cyberattacks.
For the quarter ending on 30 June, Commvault reported a 13% increase in revenue year-over-year, reaching 224.7 million USD. Its annual recurring revenue rose 17% to 803 million USD, while subscription sales surged 28% to 124.1 million USD. The company also posted an operating profit of 18.4 million USD. Adding to its strategic moves, in mid-July 2024, Commvault expanded its presence on the AWS Marketplace, specifically targeting the US Intelligence Community (ICMP). This expansion is expected to open up avenues for long-term government contracts, further solidifying Commvault's position in the market.
Technical analysis of Commvault Systems Inc. (NASDAQ: CVLT)
Exploring potential trading opportunities based on Commvault’s current stock performance:
Timeframe : Daily (D1)
Current trend : the stock is currently experiencing a global uptrend
Resistance level : previously at 126.00 USD, which has now been surpassed
Support level : established at 121.80 USD
Potential downtrend target : If the trend reverses, a potential downside target might be set at 105.00 USD
Short-term target : if the uptrend continues and the stock maintains its momentum beyond the current resistance, a short-term target could be 165.00 USD
Medium-term target : with sustained positive movement, the stock price might aim for 175.00 USD
Investors and traders should monitor Commvault closely, particularly given the company’s strong quarterly performance and strategic initiatives to capture long-term government contracts. The expansion into dedicated sections of marketplaces like AWS for specific communities such as the ICMP highlights Commvault’s commitment to growth and its potential to leverage new market opportunities.
—
Ideas and other content presented on this page should not be considered as guidance for trading or an investment advice. RoboMarkets bears no responsibility for trading results based on trading opinions described in these analytical reviews.
The material presented and the information contained herein is for information purposes only and in no way should be considered as the provision of investment advice for the purposes of Investment Firms Law L. 87(I)/2017 of the Republic of Cyprus or any other form of personal advice or recommendation, which relates to certain types of transactions with certain types of financial instruments.
Risk Warning: CFDs are complex instruments and come with a high risk of losing money rapidly due to leverage. 65.68% of retail investor accounts lose money when trading CFDs with this provider. You should consider whether you understand how CFDs work and whether you can afford to take the high risk of losing your money. CACI has been awarded USD 414M for unmanned systems researchUS technology company CACI International Inc. has secured a USD 414 million contract to conduct research on unmanned systems for several US defence agencies, including DEVCOM and C5ISR. Under the new contract, CACI International will undertake a range of analytical and engineering tasks, with a primary focus on assessing the threats posed by new military drones, which have demonstrated high efficacy in recent years. In fact, the emergence of low-cost drones has raised questions about the effectiveness of current armoured vehicles and the ability of naval fleets to operate effectively in coastal zones.
CACI International's experts will analyse these threats and develop countermeasures and proprietary crewless military tools. More importantly, CACI International will study the drone problems at the operational and tactical levels, i.e. directly for troops on the front line. For investors, this signals CACI International's prominent role in the US national security strategy.
Technical analysis of CACI International Inc. (NYSE: CACI)
Review potential trading opportunities based on CACI International stock performance:
Timeframe : Daily (D1)
Current trend : the stock is currently in a global uptrend
Resistance level : 460.00 USD
Support level : 443.00 USD
Potential downtrend target : if the trend changes to a downtrend, a downside target could be set at 400.00 USD
Short-term target : if the uptrend continues and the stock breaks resistance at 460.00 USD, a short-term target could be set at 470.00 USD
Medium-term target : if the upward momentum continues, the stock could reach USD 480.00
The company's critical role in developing research in crewless systems not only strengthens its market position but also supports critical advances in US defence.
—
Ideas and other content presented on this page should not be considered as guidance for trading or an investment advice. RoboMarkets bears no responsibility for trading results based on trading opinions described in these analytical reviews.
The material presented and the information contained herein is for information purposes only and in no way should be considered as the provision of investment advice for the purposes of Investment Firms Law L. 87(I)/2017 of the Republic of Cyprus or any other form of personal advice or recommendation, which relates to certain types of transactions with certain types of financial instruments.
Risk Warning: CFDs are complex instruments and come with a high risk of losing money rapidly due to leverage. 65.68% of retail investor accounts lose money when trading CFDs with this provider. You should consider whether you understand how CFDs work and whether you can afford to take the high risk of losing your money.