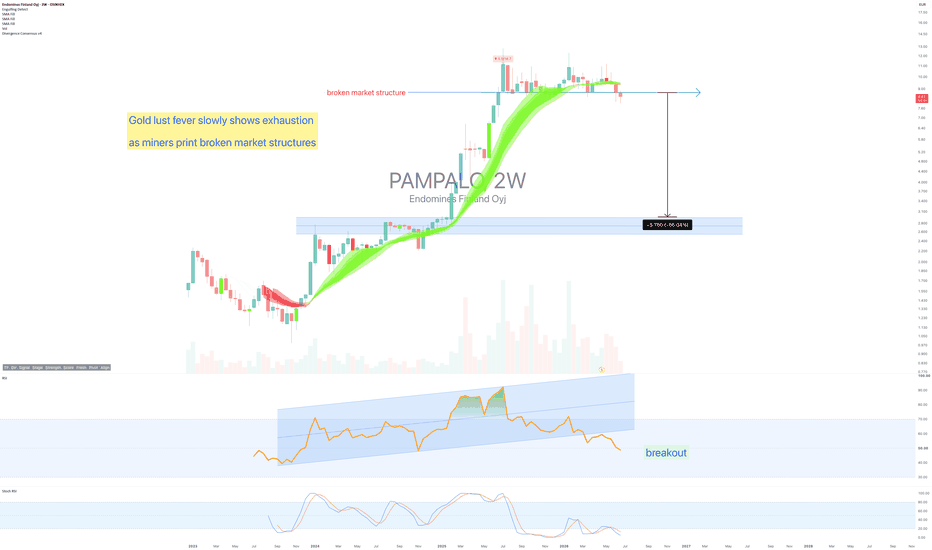
Endomines Breakdown Continues Lower - June 2026SYMBOL: OMXHEX:PAMPALO | DIRECTION: SHORT | TIMEFRAME: Monthly
Published: June 2026
On the above 2-week chart PAMPALO sits 33% below its 52 week high with structure deteriorating. The case for being short remains intact.
1) Broken market structure. Lower highs and lower lows define the last six months of 2 day bars.
2) Price sits well below both the 50 day and 200 day simple moving averages. At 8.43 the stock trades 11.1% beneath the 50 day and 10.3% beneath the 200 day. Mean reversion downward remains the path of least resistance.
3) See weekly chart below. The longer the timeframe you observe, the clearer the deterioration becomes. Weekly price action confirms the monthly breakdown after a Gravestone DOJI print.
4) Momentum on the daily timeframe reads 40.4 on RSI 14. This is not yet oversold territory, meaning room exists for further compression.
5) Volume is contracting overall, and the stock trades at the 23rd percentile of its 52 week range. Significant distance remains between current price and the 52 week low of 7.20.
Is it possible price recovers from here? Sure.
Is the downtrend finished? Not yet.
Ww
Weekly - Gravestone DOJI
=====================================
Disclaimer
This is not financial advice. I am not a financial adviser. This idea is for educational and informational purposes only. Do your own research.
=====================================
Rapala bounces from deep correction territory - June 2026SYMBOL: OMXHEX:RAP1V | DIRECTION: LONG | TIMEFRAME: Monthly
Published: June 2026
On the above Monthly chart RAP1V has corrected approximately 92 percent from cycle highs of 10 Euro. A number of reasons now exist for a bullish outlook.
1) Bullish divergence. Price has made a lower low whilst RSI has made a higher low over the past 90 days. Classic early-stage recovery signal that often precedes meaningful reversals.
2) Price sits just above both the 50-day and 200-day simple moving averages for the first time in a long long while. Proximity to these levels suggests key support is holding. Look left at what occurred when price tested these moving averages previously.
Daily
3) RSI on the weekly timeframe reads 52.2, neutral territory. The higher the timeframe you go, the stronger the signal. Weekly RSI confirmation of the divergence structure adds conviction to the bounce thesis.
4) Volume is contracting on down moves. This is a signature of seller exhaustion. Fewer sellers stepping in at lower prices suggests capitulation may be complete.
5) Price sits at the 57th percentile of its 52-week range, neither deeply oversold nor overbought. Room to run upward exists without price needing to break into fresh territory immediately.
Is it possible price corrects further? Sure.
Is it probable? No.
Ww
=====================================
Disclaimer
This is not financial advice. I am not a financial adviser. This idea is for educational and informational purposes only. Do your own research.
=====================================
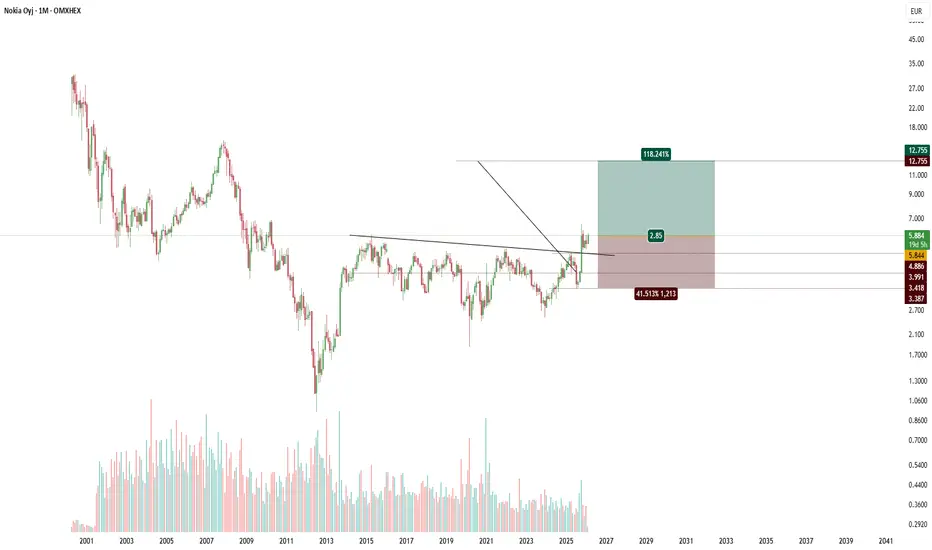
$NOKIA From Phones to AI Networks. Up 119% YTD. BUY The DIP!Most people still associate Nokia with mobile phones. 📱 That business was sold to Microsoft over a decade ago.
Nokia today is a pure play on AI network infrastructure, optical networking, and secure communications and the market is finally waking up to what this company has become. 🔥 Up 119% year to date.
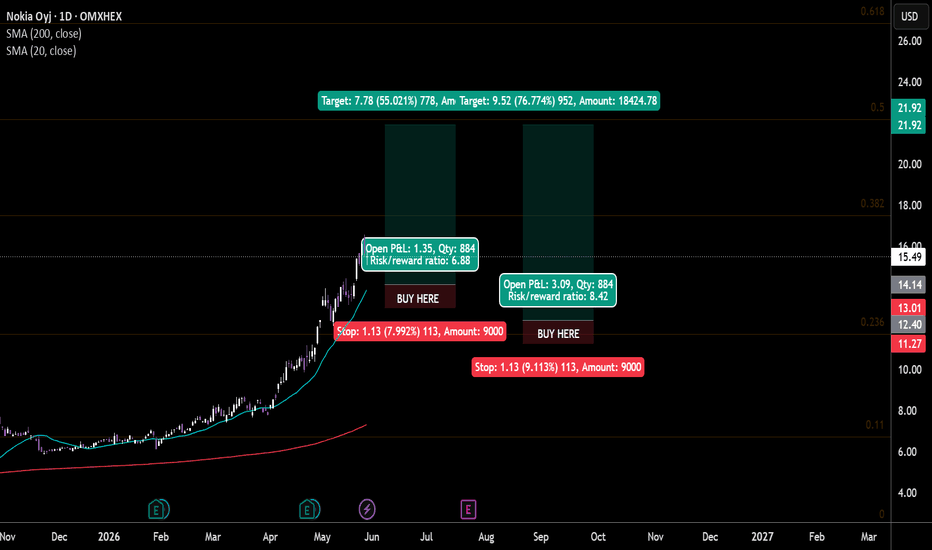
Pulling back. Two daily demand zones printed. This is the entry. 📊
Q1 2026 results beat expectations on every metric. 🏆 Net sales grew 4% to EUR 4.5 billion. Operating profit beat consensus by approximately 11%. 💰
Gross margin expanded 320 basis points. Operating margin expanded 200 basis points. Free cash flow hit EUR 629 million in a single quarter. 💪
AI and Cloud segment net sales surged 49% year over year, now representing 8% of total group revenue, with EUR 1 billion in new orders received in the quarter alone. 🤖
Book to bill was above 1 at the group level and well above 1 in Network Infrastructure. ⚡
Nokia raised its full year 2026 Network Infrastructure growth guidance to 12% to 14%, up from 6% to 8%. 📈
Optical and IP Networks combined guidance was raised to 18% to 20% growth, up from 10% to 12%. Nokia also raised its AI and Cloud addressable market CAGR estimate to 27% from 2025 to 2028, up from a prior estimate of 16%. 🎯
Management described the AI network opportunity as a multi year structural shift with hyperscaler capex expectations rising and longer lead times becoming normal. 🌐
Nokia opened its AI Networking Innovation Lab in Sunnyvale, California, with AMD, Lenovo, Supermicro, Keysight Technologies, Viavi Solutions and Weka as launch partners. 🏭 The lab is focused on AI native networking, switching, telemetry and automation for AI training and inference workloads. 🧠
Argus Research upgraded Nokia on 27 April 2026 with a price target of $15.00. 🐂 Nokia holds EUR 3.8 billion in net cash. 💵 The 52 week range sits between $4.00 and $16.63.
Next earnings are due 23 July 2026. 📅
The daily chart has pulled back from the 52 week high into two clean demand zones. ✅ Two entries. Two defined risk levels. One directional thesis. 📊
🟢 Zone 1 (Upper Entry) ~ $14.14 area (Daily)
💰 Entry: $14.14
🛑 Stop: $13.01 (7.992% below entry)
🎯 Target: $21.92 (55% upside from entry)
📈 Risk/Reward Ratio: 6.88
🟢 Zone 2 (Lower Entry) ~ $12.40 area (0.236 Fibonacci Daily)
💰 Entry: $12.40
🛑 Stop: $11.27 (9.113% below entry)
🎯 Target: $21.92 (76.8% upside from entry)
📈 Risk/Reward Ratio: 8.42
📅 Next Earnings: 23 July 2026
💵 Net Cash: EUR 3.8 billion
📈 YTD Performance: up 119%
🌍 52 Week Range: $4.00 to $16.63
From phones to AI networks. 🤖 119% YTD and still raising guidance.
📈 Two daily zones. Let price come to the level and let the trade do the work. 🚀
⚠️ Not financial advice. Manage your risk.
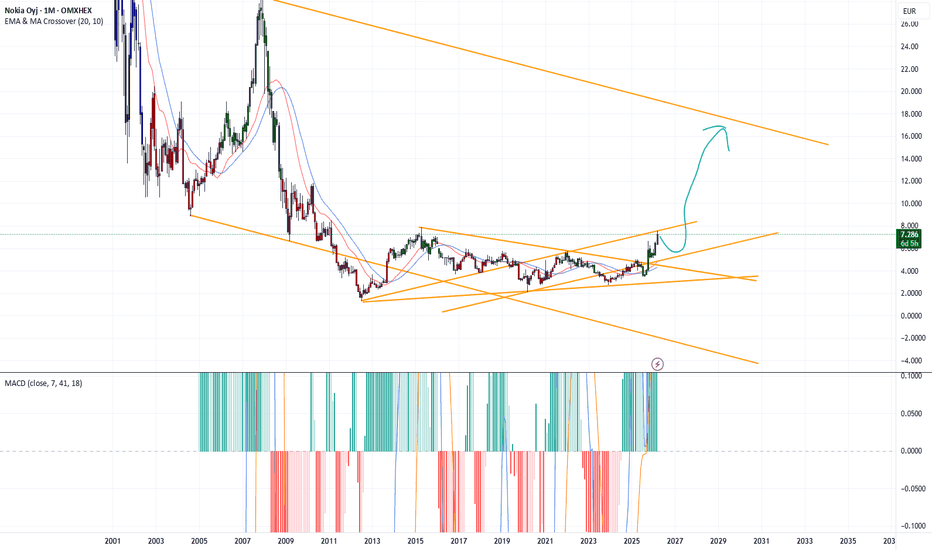
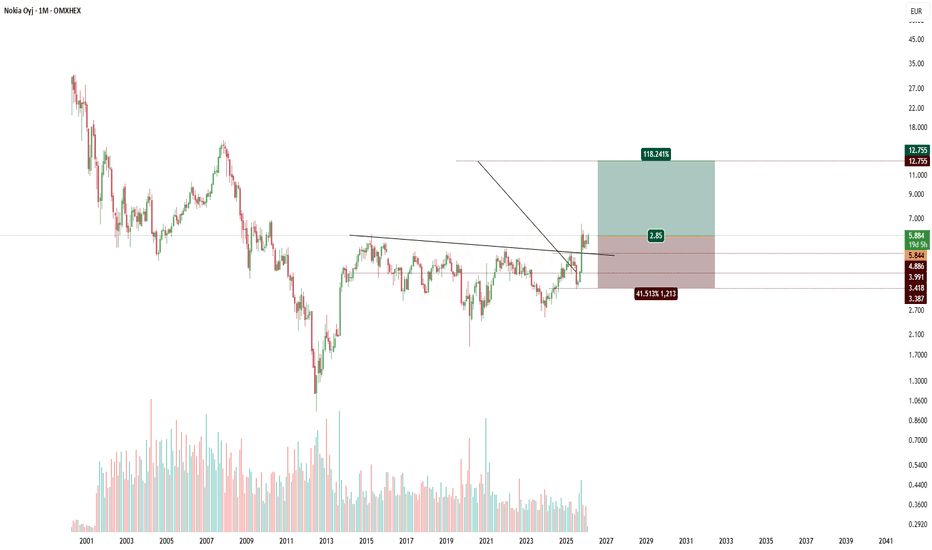
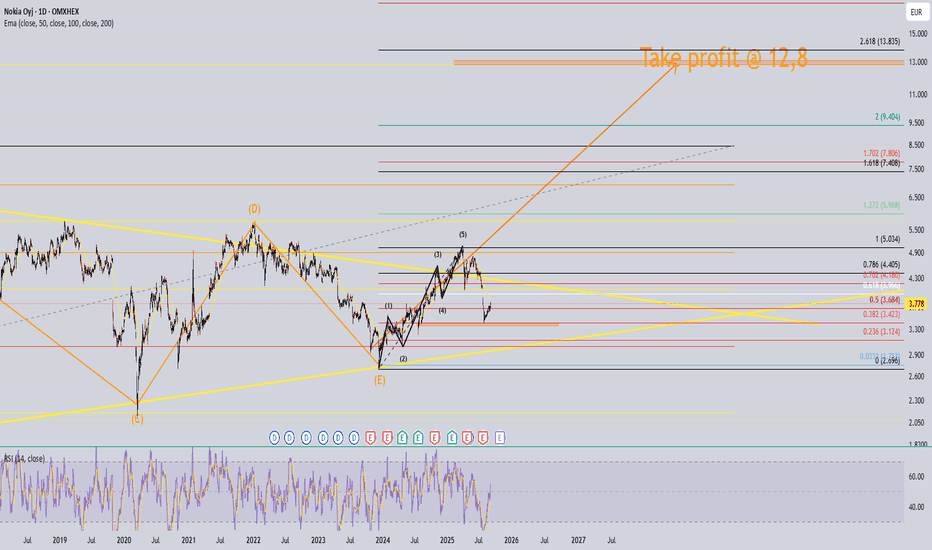
NOKIA Nokia and Nvidia have recently announced a strategic partnership centered on pioneering AI-powered telecommunications networks, particularly targeting the transition from 5G to 6G. Key points of the collaboration include:
Nvidia’s $1 billion investment in Nokia, acquiring a 2.9% stake at roughly $6.01 per share, underlining confidence in Nokia's AI-driven network strategy.
Joint development and commercialization of AI-native mobile networks (AI-RAN), with Nokia expanding its global access portfolio using Nvidia’s AI computing platforms.
Nvidia introduced the Arc Aerial RAN computer, a 6G-ready telecommunications platform, enabling faster and more efficient AI networking capabilities.
The collaboration aims to support the explosive growth of mobile AI traffic with AI services integrated into networks, enhancing consumer and enterprise experiences at the edge.
They are working with T-Mobile US on integrating AI-RAN into 6G development, with field trials beginning in 2026.
In addition to AI-RAN, Nokia and Nvidia are cooperating on AI networking solutions like data center switching and optical technologies for future AI infrastructure architectures.
This partnership positions Nokia to leverage Nvidia’s AI hardware and software expertise to become a leader in the emerging AI-driven telecom infrastructure segment, opening significant growth avenues in 5G-Advanced and 6G deployments.
In essence, the Nokia-Nvidia collaboration is a cornerstone bullish case driver for Nokia’s share price and industry standing, reflecting strong growth potential linked to AI and next-gen network innovations.
Fundamental Highlights
Nokia's Q3 2025 reported earnings per share (EPS) surpassed estimates at $0.069 vs $0.06 expected.
Revenue was approximately $5.61 billion, above consensus forecasts.
Strong growth in network infrastructure and cloud sectors continues, driven by demand from AI/data center customers.
Nokia's acquisition of Infinera enhanced its optical networking capabilities, bolstering its market position.
The company reported solid free cash flow of EUR 0.4 billion and a net cash balance of EUR 3.0 billion.
The price-to-earnings ratio (P/E) is relatively high, around 38.58, reflecting market optimism but also valuation considerations.
Possible Bullish Case Scenario
Continued growth from AI and cloud infrastructure demand could fuel revenue and operating margin expansion.
Strategic partnerships (e.g., with Nvidia on AI networking) may unlock new avenues of market share gain.
Optical network segment strength may benefit from rising data traffic and 5G/6G rollouts globally.
Strong cash flow generation supports investment in innovation and shareholder returns.
Positive market sentiment driven by technology upgrades and repositioning as a key AI infrastructure player.
#NOKIA # STOCKS
Is the Finnish Bank OmaSp about to collapse?The charts are suggesting caution. On the above 10-day chart:
1) Double top in price.
2) Regular bearish divergence.
The higher the timeframe you look the more ugly this divergence is.
Laterally I’m wondering if the small banking crisis that hit the US is now venturing to other parts of the world. OmaSp does not appear to be in isolation.
There were some tell-tell signs before the collapses of Silicon Valley and Signature Banks. (No one in Europe heard of those banks!) They were:
1) Strong bond market exposure.
AND
2) Same TA as above.
“OmaSp has been active in the bond market since 2013” says their website. Very true..
Until recently you could get the information on their Bond market exposure.. You click on the WebPage today and you get:
www.omasp.fi
“Unfortunately the webpage you were looking for can not be found”
Oh dear…
Ww
Type: Trade, short
Risk: <=3%
Timeframe: Candles closing at 19 and under.
10-day Silicon Valley Bank
before
after
10-day Signature Bank
before
after
Nuclear new goldAll this talk about nuclear energy, i think that its the new gold. It seems like a sustainable solution, especially with data center for AI's. OMXHEX:FORTUM and OMXSTO:SVIK is two candidates, they work with nuclear waste, and does some jobs in Sweden where 10 new reactors is planed to be build.
These two are a bit slow in price swings, why i post them. Under the blue line sell out or if they dont follow the arrows.
If you dont mind big swings, i would DEFINITLEY! reccoment NYSE:SMR and NASDAQ:NNE
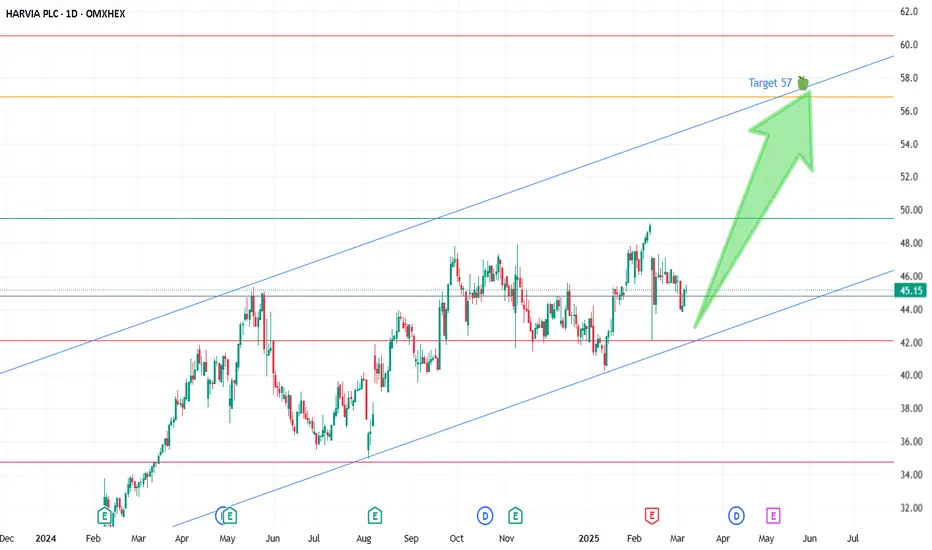
$Tokmanni Technical OutlookTokmanni is showing a bullish trend on the daily and lower timeframes, respecting supply and support levels. As seen before, when the price broke above 12, it made a natural pullback before continuing to break new highs.
With the trend still bullish, riding the wave makes sense. The stock seems to have solid momentum towards 18, where some selling pressure could appear.
However, one key thing to watch is that whenever the trend shifts bullish, it struggles to sustain positive momentum and quickly turns bearish. This pattern has repeated multiple times.
⚠️ Be cautious: if the wave turns bearish again, we could see a sharp sell-off.
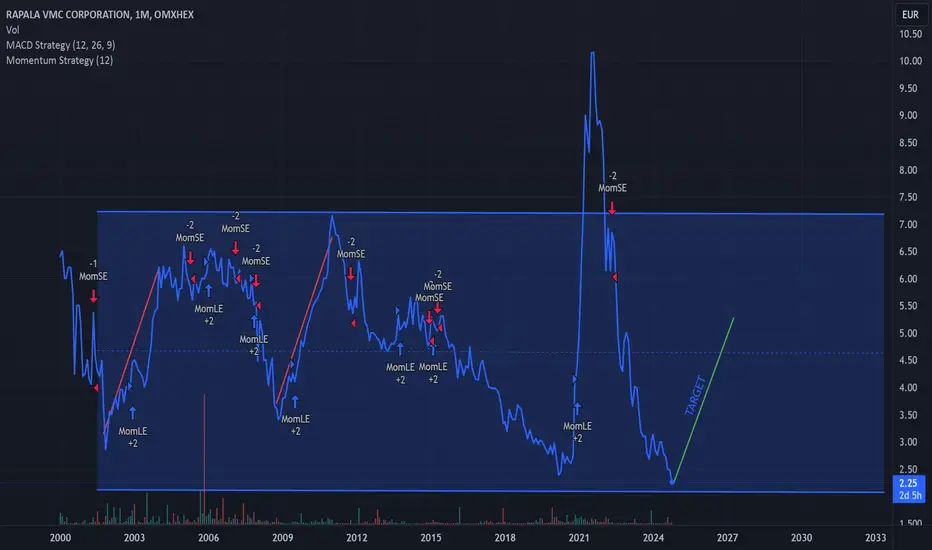
Upside potential 3 year long position Rapala Rapala stock has been under a lot of sales pressure and are currently trading 0.05 eur below all time low. Inventory are valued at 84.7MEUR while MCAP is 88 MEUR. As the worlds leading fishing equipment manufacturer I find the valuation to be very attractive. Trading volume is low, only 2 analysts cover Rapala and has a price target of 2.7EUR.
EBITDA H1 2024 was 16.9MEUR compared to 10MEUR for H1 2023.
Dept is sinking while cash and cash equivalents remains solid at 27.6 MEUR at June 30, 2024.
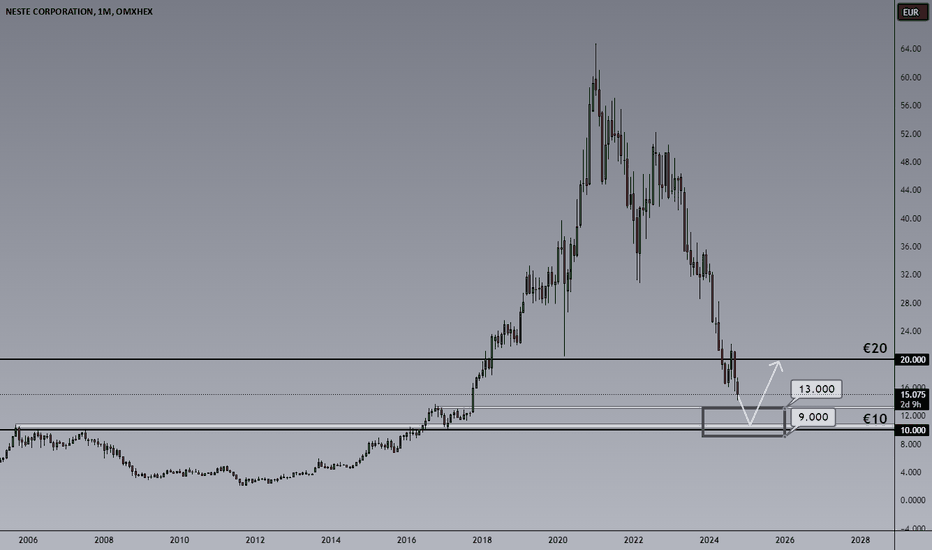
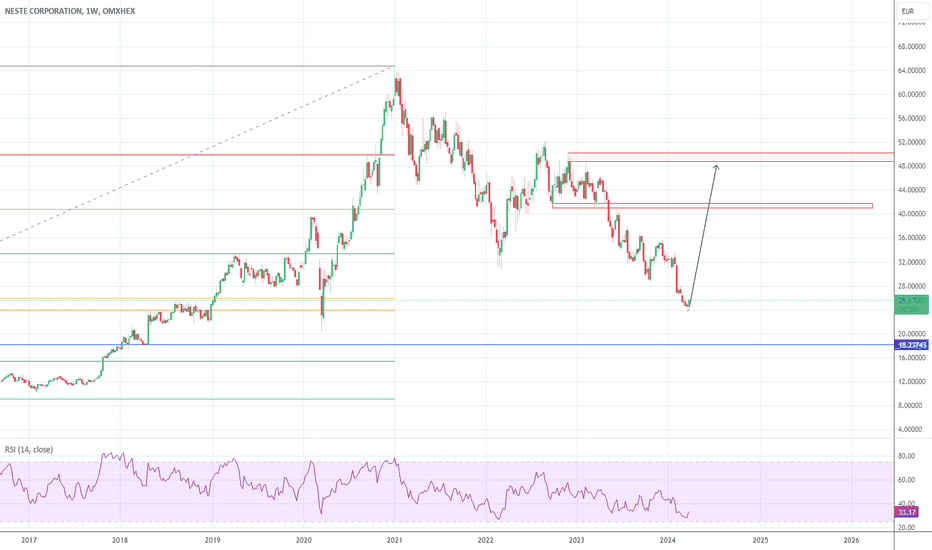
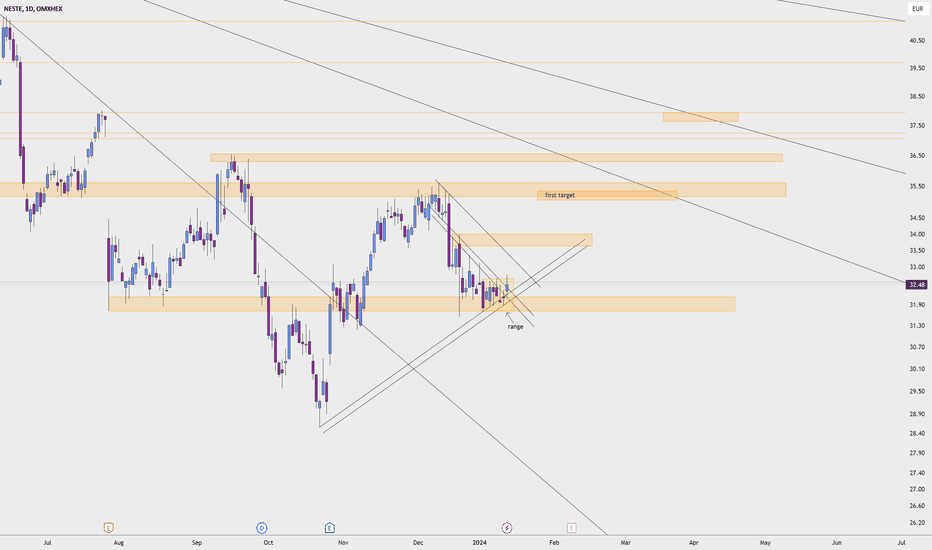
NESTE Corporation: Falling Knife! Put on The Steel Gloves!Neste Corp. is a Finnish company founded in 1948, headquartered in Espoo, that specializes in petroleum products and renewable diesel. It operates in four main segments:
Renewable Products: Produces and sells renewable diesel, jet fuel, solvents, and bioplastics raw materials.
Oil Products: Supplies a range of fuel products, including diesel, gasoline, aviation and marine fuels, oils, and solvents.
Marketing & Services: Sells petroleum products and services to end-users, including motorists, industries, transport companies, and heating oil customers.
Others: Includes Neste Jacobs (engineering and technology services), Nynas (joint venture), and corporate expenses.
Neste focuses on expanding renewable energy solutions alongside traditional oil products.
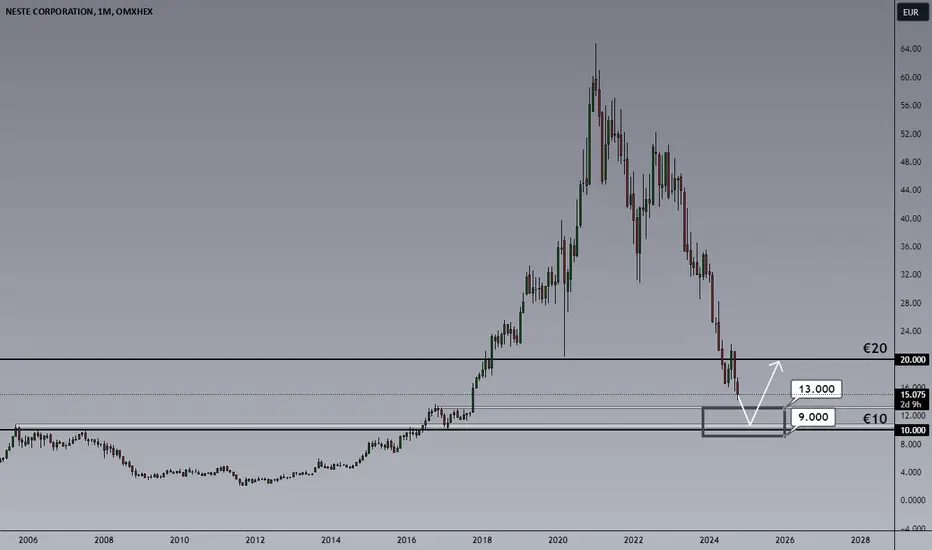
Fundamentally, the current price doesn’t present an ideal buying opportunity, as indicated by recent analysis. The chart, technically speaking, also suggests that key areas of interest lie slightly below the current price levels.
The steel gloves should be on because the downforce has been quite strong but still, I would like to try to catch it using my skills ;) Lezz see!
Good luck,
Vaido
WITH: Potential BuyCurrently in a range consolidating above the 1 EUR psychological level, we'll see if it holds supported by a trend line. Personally I'd consider WithSecure as a long term buy. S/R zones marked to look out for.
WLong
STERV - 10 months HEAD & SHOULDERS══════════════════════════════
Since 2014, my markets approach is to spot
trading opportunities based solely on the
development of
CLASSICAL CHART PATTERNS
🤝Let’s learn and grow together 🤝
══════════════════════════════
Hello Traders ✌
After a careful consideration I came to the conclusion that:
- it is crucial to be quick in alerting you with all the opportunities I spot and often I don't post a good pattern because I don't have the opportunity to write down a proper didactical comment;
- since my parameters to identify a Classical Pattern and its scenario are very well defined, many of my comments were and would be redundant;
- the information that I think is important is very simple and can easily be understood just by looking at charts;
For these reasons and hoping to give you a better help, I decided to write comments only when something very specific or interesting shows up, otherwise all the information is shown on the chart.
Thank you all for your support
🔎🔎🔎 ALWAYS REMEMBER
"A pattern IS NOT a Pattern until the breakout is completed. Before that moment it is just a bunch of colorful candlesticks on a chart of your watchlist"
═════════════════════════════
⚠ DISCLAIMER ⚠
The content is The Art Of Charting's personal opinion and it is posted purely for educational purpose and therefore it must not be taken as a direct or indirect investing recommendations or advices. Any action taken upon these information is at your own risk.