what doesnt kill you make youy stronger...?Is #nokia going to show back to the worLD how a phone is supposed to be?Longby salomonpezin1
OMXH - Dovre - Cent-stocksCompany in bad finance for a couple of years. Seems to be soon at it's last legs. Common pattern: Company stock drops to downtrend channel and bounces in average 26% up from there to commence yet another new drop to the abyss (average drops +-28-33%). It's a risky stock, but if charts are true, when oversold hits and price touches downtrend channel there is a possibility to get 25-30% gains. Average downtrend length: 308d Average uptrend impulse length: x+2 aka. 6, 8, 10, 12... Traditionalby scilentorUpdated 4
OUT1V - Bull div on daily. Not advice. Just showing bull div on much larger downtrend. Possibilities are high for us to test upper lines on the downtrend channel. by scilentor3
Extremely Bullish Set-up For NOKIAExtremely Bullish Set-up For NOK - Needs to Breakout & Retest To Be In Play: 2019 YE Target 8.5€ / 2020 Target 23€ (!!)Longby ArthaVidya23
monitor first before selling or buyingchart is changing now. might need to monitor first.by wuhsing2200
OUT1V forming an iH&S?See chart. Zoom in in you will. WIll update for a couple of weeks. No trading advice. Just a chart-pattern analysis. by scilentorUpdated 2
Omxh Fortum Corp - Triangle spottedNot trading advice. Let the chart speak for itself. DYOR b4 investing. by scilentor3
Nokia observations on Weekly (simple)Seems like in our current state Nokia is preparing for another touch of the upper line of the triangle. This seems to be further supported by Hull Macd. If volume is weak we will move sideways and eventually test the lower border of the triangle. Depending on the Q4 of the company we will either break up or down from the triangle. This will trigger hold or sell among investors. by scilentorUpdated 5
IFA1V - OMXH - Downtrend continuesDowntrend continues. Possible relief in June when news heard of current financial status and new deals. Caution: Low volume in daily Trading makes this stock vulnerable to manipulation. Iby scilentorUpdated 0
Last test of support on OutokumpuI have been working on the theory of the current price action being a smaller fractal of the last bull run from ATL 0.88% . A pitchfork can confirm the channel play occuring and a slight bullish divergence can give indication on a rally soon. Three tests of RSI support and vertical support from a major pitchfork . The volume is down almost 70 %. It's not going to stay like this for long. Buy levels have been around 5€ and I think a 30-40% gain is plausible. This major pitchfork followed by aLongby RoyalOakFIUpdated 32
NOKIA GRAPH ANALYSIS (trying new techn) - Multi path predictions*Note - this is my first graph of not using chart patterns but just trying to fit stuff together to predict. Please take the prediction with a grain of salt. The marked intersection point seems like the most likely point for a breakout with multiple conversions. Looking at the different paths, it should be possible to predict the future direction! Again, feedback would be awesome this is legit just a random graph I made.by rylest3701
NOKIA Long IdeaBuy NOKIA after the bounce on the confluence between the broken bearish trend line, the ascending line and the support zone. Also the price is trapped into an interesting fibonacci level. A good price action could be the trigger to buy the stock. Longby Acorcia3
OUT1V - OMXH - Possible bullish gartleyPossible bullish gartley spotted. Long term investment. Will write more some other day.by scilentorUpdated 0
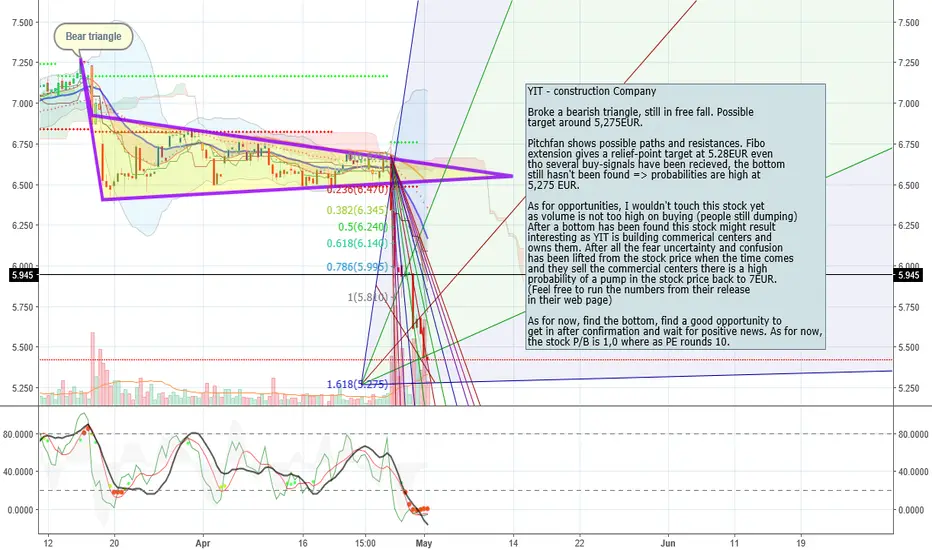
YIT - OMXH - Finding bottom.Target 5,275. Wait for reversal. Dump is almost done. by scilentorUpdated 12
VERK - OMXH - going for a breakout from the down trendThis one could be a good opportunity. We're going for the re-test of the downtrendline. In case of a breakout targets would be set at 7EUR. Entry at 6EUR and stoploss in case you want one would be 0.4EUR below your entry. Risk/profit ratio would be around 2.4. Note: Resistances at 100 and 200MA in case you wanna play midterm instead of long. Entry valid IF we break from downtrend.by scilentorUpdated 0
MARAS - OMXH - Hypetrain coming down, trying to find bottom.Do your own research, do not act based on mine as I take no responsabilities :) by scilentorUpdated 0
OUT1V - OMXH - Time to choose a bat to rideWill update this from time to time on smaller timescale.by scilentorUpdated 0
 LongLong

 Long


 LongLong