ISP: OPA, +44% and a new attack on the highs?Ion Jauregui – Analyst at ActivTrades
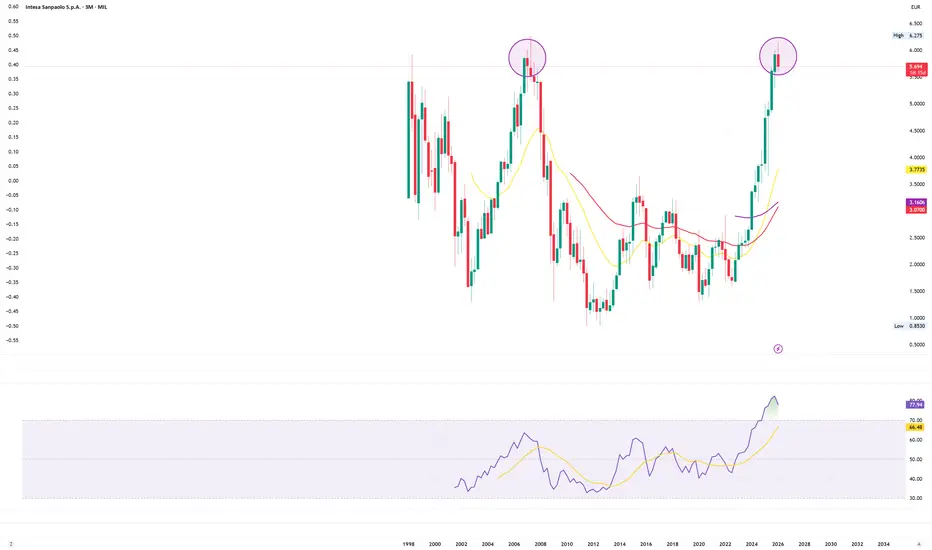
Intesa Sanpaolo faces a decisive week. The €30.6 billion offer for Monte dei Paschi di Siena could accelerate Italian banking consolidation, while ISP enters the event after rising more than 44% since March. The price has been moving sideways since the August highs, while indicators are beginning to show a loss of momentum.
An OPA that could change the Italian banking landscape
Intesa Sanpaolo is once again at the center of European banking consolidation with its offer of around €30.6 billion for Monte dei Paschi di Siena (MPS). The transaction aims to create a group with more than 27 million customers and close to €2 trillion in customer financial assets by 2029.
Intesa expects to obtain around €2.9 billion in additional financial benefits, combining cost savings and higher revenues. The bank expects to achieve approximately 60% of these synergies in 2028 and complete its target in 2029. Intesa shareholders will vote on the transaction on September 10.
The proposal comes at a time of strong reorganization in the Italian financial system. MPS has proposed defensive transactions involving Banco BPM and Banca Generali to preserve its independence, increasing the strategic importance of Intesa's offer.
For Intesa, the acquisition could strengthen its position in the domestic market and generate new economies of scale. However, the market will also have to assess the risks associated with integration, capital consumption and the ability to translate the expected synergies into higher earnings and profitability.
ISP: sideways movement after a rally of more than 44%
The share price of Intesa Sanpaolo (ISP) maintains a bullish medium-term structure. From the lows of March 26, at €4.81, the stock advanced to reach €6.933 in mid-August, accumulating an approximate 44% gain.
Since those highs, the price has entered a phase of sideways movement, currently trading around €6.68. Rather than a significant correction, the behavior reflects a pause following the strong move accumulated since March, with the price moving within a relatively narrow range.
Technical indicators show precisely this loss of momentum. The RSI has declined from its highs toward the middle range, while the MACD is close to entering negative territory. The histogram has remained red since August 18, signaling a progressive reduction in buying momentum.
This situation does not necessarily imply a change in trend. The price continues to move sideways while the indicators unwind part of the excess accumulated during the latest bullish leg. The key will be to determine in which direction this range is eventually resolved.
The first reference on the downside is located in the €6.60-€6.65 area. As long as ISP remains above this level, the sideways movement can continue to be interpreted as a pause within the main bullish trend.
In the event of a clear break below €6.60, the risk of a deeper correction would increase. In that scenario, the price-volume profile shows a second Point of Control (POC) area around €5.76, which would act as a relevant reference.
On the upside, the €6.90-€6.93 area represents the immediate resistance and coincides with the August highs. A clear breakout above this level could restart the bullish momentum and open the door to new highs.
The OPA meets a market waiting for confirmation
The fundamental and technical contexts are now converging. The MPS transaction represents a relevant catalyst for Intesa precisely as the stock enters a sideways phase after a rally of more than 44%.
The September 10 shareholder vote could become the next factor capable of increasing volatility. A positive reception of the transaction could provide the momentum needed to retest the August highs. Conversely, any doubts about execution, synergies or capital consumption could keep the price within the current range or increase selling pressure.
For now, the medium-term outlook remains favorable. The bullish structure remains intact, but momentum has weakened and the price needs to regain strength to challenge €6.93 again.
The equation is straightforward: €6.60 on the downside and €6.93 on the upside. A breakout of either extreme will likely determine ISP's next significant move.
After moving from €4.81 to €6.933 in less than five months, Intesa Sanpaolo is now entering a waiting phase. The OPA could provide the catalyst, but it will be the price that determines whether this sideways movement ultimately resolves into another bullish breakout or a deeper correction.
*******************************************************************************************
The information provided does not constitute investment research. The material has not been prepared in accordance with the legal requirements designed to promote the independence of investment research and such should be considered a marketing communication.
All information has been prepared by ActivTrades ("AT"). The information does not contain a record of AT's prices, or an offer of or solicitation for a transaction in any financial instrument. No representation or warranty is given as to the accuracy or completeness of this information.
Any material provided does not have regard to the specific investment objective and financial situation of any person who may receive it. Past performance and forecasting are not a synonym of a reliable indicator of future performance. AT provides an execution-only service. Consequently, any person acting on the information provided does so at their own risk. Political risk is unpredictable. Central bank actions can vary. Platform tools do not guarantee success.
 Long
Long
 Long
Long
RACE: Ferrari Bulls are in in control next target is 400 USD▪️ RACE / FERRARI — THE RECLAIM IS DONE. NEXT STOP IS THE 400 LIQUIDITY POOL. 🐎
▪️ Ferrari is pressing higher near 357, having already reclaimed its very-strong floor and turned it into a launch pad. Price is out of the base and climbing — this isn't a "will it hold" chart, it's a "how far does the run go" chart, and the answer sitting overhead is 400, where the biggest sell-side pool on the board rests.
▪️ Primary outlook: bullish continuation — reclaim confirmed, liquidity run in progress. The path of least resistance is up, with one intermediate wall to clear before the 400 target comes into range.
▪️ Key resistance zone: 376–384 — a ★★ 6.2/10 MODERATE wall leaned on 15 times, the one real speed bump between price and the target. Clear it and the lane to 400 opens.
▪️ Final target overhead: 400–408 — the Bear Liquidity Cluster (POWER 9/10, 13.81% depth), the "400 USD TP" for bulls. This is where trapped short liquidity and resting sell orders pool — in a bullish run, that cluster isn't resistance to fear, it's the magnet to aim at. Bulls hunt the sell-side.
▪️ Major defense line: 345–350 — a ★★★★ 8.1/10 VERY STRONG support at 10 retests, the freshly reclaimed floor and the line that keeps the bullish read alive. Lose it and the momentum thesis stalls.
▪️ Primary upside targets: clear 376–384 → 400 (Bear Cluster POWER 9/10).
▪️ Structural invalidation: a daily close back below 345 flips continuation into range, opening 329 → 305–313.
▪️ Bullish scenario (primary — yellow paths): hold above the reclaimed 345–350 floor → grind through the 376–384 moderate wall → drive into the 400–408 Bear Liquidity Cluster where the sell-side pool gets eaten. The staged run: floor → mid-wall → the pool. That's the 400 USD TP.
▪️ Bearish scenario (invalidation only): rejection before 376 and a loss of 345–350 → pullback into 329 (5.1 WEAK) and 305–313 (6.9 MODERATE). Deep invalidation is the 281–289 Bull Liquidity Cluster — the structural demand shelf that only comes into play if the whole reclaim unwinds.
▪️ KEY LEVELS
▪️ Current Price: ~357
RESISTANCES
▪️ 400–408 — Bear Liquidity Cluster · POWER 9/10 · 13.81% depth · final target / "400 USD TP BULLS" (sell-side pool)
▪️ 376–384 — ★★ 6.2/10 MODERATE · 15 retests · intermediate wall
SUPPORTS
▪️ 345–350 — ★★★★ 8.1/10 VERY STRONG · 10 retests · reclaimed floor / launch pad
▪️ 329 — ★ 5.1/10 WEAK · 5 retests
▪️ 305–313 — ★★ 6.9/10 MODERATE · 13 retests
▪️ 281–289 — Bull Liquidity Cluster · POWER 8/10 · 20.36% depth · deep demand magnet (structural)
▪️ 271–278 — ★★ 6.5/10 MODERATE · 12 retests
▪️ LIQUIDITY CLUSTER MAP
▪️ Overhead (sell-side pool): 400–408 — Bear Cluster POWER 9/10, 13.81% — the highest-value objective on the board and the target of this run. In an uptrend this is where price gets pulled: trapped shorts above 400 become fuel, and the resting sell orders are the liquidity bulls are driving toward. ~+12–13% from current.
▪️ Below (buy-side pool): 281–289 — Bull Cluster POWER 8/10, 20.36% — the deepest pool on the chart (biggest % depth) and the ultimate demand shelf. It's the catastrophe magnet, not an active level — only relevant if the reclaim fully fails. ~-20% from current.
▪️ The asymmetry: the active magnet is overhead (bear pool at 400), the safety-net magnet is far below (bull pool near 285). That's a bullish structure — the near-term pull is up.
🔍 THE SCENARIO PATH
▪️ Yellow legs (the run — primary): from 357, hold the 345–350 reclaimed floor → push through the 376–384 moderate wall (first checkpoint) → extend into the 400–408 Bear Liquidity Cluster (final TP). Two staged yellow arrows: the first clears the mid-wall, the second delivers into the pool. A multi-week traverse on the Daily, roughly +12% top to bottom of the move.
▪️ Invalidation leg (only if 345 breaks): step-down through 329 → 305–313, with the 281–289 Bull Cluster as the deep catch. Not the base case while the reclaim holds.
▪️ My read: The hard part already happened — reclaiming the 8.1 very-strong floor is what turns a bounce into a trend, and that's done. From here it's a liquidity run: the 400 Bear Cluster is a magnet, not a wall, because pools like that pull price in before they reverse. The high-value long is the continuation while 345–350 holds beneath; the 376–384 wall is the only friction between here and target. Structure stays bullish above 345 — that's the one number that matters. Lose it and this becomes a range again; hold it and 400 is the draw.
🔒 Levels and paths from the zone model. No signals, no repaint — a scenario, not a promise.
▪️ ProjectSyndicate Levels Desk — Overview of key S/R zones for XAUUSD, NVDA, NQ, ES & GC traders every week. Subscribe to stay up to date with the latest levels.
#RACE #Ferrari #Stocks #Trading  Long
Long
 Long
Long
BreakOn Group: Can Ethereum's Rally Continue Toward $2,000?Ethereum remains one of the most closely watched assets in the cryptocurrency market. After moving above the $1,800 level, renewed optimism has emerged among investors and analysts regarding the potential for further growth. At the same time, reports of a large investor opening a position worth approximately $24 million have fueled additional discussion about whether institutional activity could help Ethereum approach the important psychological level of $2,000.
At BreakOn Group, cryptocurrency market analysis is based on evaluating both technical indicators and broader market fundamentals. While large transactions often attract considerable attention, sustainable price trends typically develop through a combination of institutional participation, market liquidity, macroeconomic conditions, and overall investor confidence.
The recent movement in Ethereum demonstrates how rapidly market sentiment can change and why comprehensive analysis remains essential for traders and investors navigating digital asset markets.
Ethereum Regains Momentum
Breaking above the $1,800 level represents an important milestone for Ethereum after a period of market consolidation. Strong buying activity has renewed confidence among investors who believe the asset may be preparing for another upward move.
At BreakOn Group, analysts view major technical levels as indicators of changing market sentiment rather than guarantees of future price direction. Increased trading volume and stronger participation from both retail and institutional investors often contribute to improving market confidence.
As momentum builds, traders continue monitoring whether Ethereum can maintain support above recently established price levels while attracting additional market participation.
The Impact of Large Investors
Large cryptocurrency transactions frequently influence market sentiment because they may reflect confidence from experienced market participants. News of a significant investment can encourage increased attention from traders seeking confirmation of broader market trends.
The recently reported $24 million Ethereum position has generated discussion throughout the digital asset community. Although a single transaction does not determine long-term price direction, it may contribute to increased optimism when combined with improving technical conditions and favorable market developments.
At BreakOn Group, specialists emphasize that institutional activity should always be analyzed alongside liquidity, trading volume, macroeconomic trends, and overall market structure rather than viewed in isolation.
Could Ethereum Reach $2,000?
The $2,000 price level represents both a psychological milestone and an important technical resistance area for Ethereum. Many analysts consider this level significant because it may influence future market behavior depending on how buyers and sellers respond.
Supporters of a bullish outlook believe that continued institutional interest, positive sentiment across cryptocurrency markets, and improving blockchain adoption could create conditions for additional price appreciation.
However, financial markets rarely move in a straight line. Temporary pullbacks, profit-taking, and changing macroeconomic conditions remain normal features of cryptocurrency trading.
At BreakOn Group, analysts encourage traders to evaluate multiple market scenarios rather than relying exclusively on optimistic price targets.
The Role of Market Analysis
Successful cryptocurrency investing depends on understanding both technical and fundamental market factors. Price action alone rarely provides the complete picture required for informed decision-making.
At BreakOn Group, market analysis combines chart analysis, trading volume, blockchain activity, macroeconomic developments, and investor sentiment to build a broader understanding of market dynamics.
This comprehensive approach enables traders to identify potential opportunities while remaining aware of the risks associated with highly volatile digital assets.
Rather than reacting solely to headlines, disciplined analysis helps investors maintain consistency throughout changing market conditions.
Managing Risk in Volatile Markets
Cryptocurrency markets are well known for rapid price movements that can create both opportunities and challenges. Strong rallies are often accompanied by periods of increased volatility and temporary corrections.
At BreakOn Group, effective risk management remains a fundamental component of every investment strategy. Diversification, clearly defined trading plans, portfolio monitoring, and disciplined position management help investors navigate uncertain market environments.
Maintaining realistic expectations and avoiding emotionally driven decisions can be just as important as identifying potential market opportunities.
Long-term success often depends on consistency, preparation, and continuous evaluation of market developments.
Technology Supporting Better Decisions
Modern cryptocurrency markets generate enormous amounts of real-time information. Advanced trading platforms, analytical software, artificial intelligence, and market monitoring systems enable investors to process this information more efficiently than ever before.
At BreakOn Group, technology supports market research by helping traders organize data, identify emerging trends, and monitor changing market conditions through structured analytical tools.
Access to comprehensive market information enables investors to make more informed decisions while adapting to the rapidly evolving digital asset ecosystem.
As blockchain technology continues to mature, advanced analytics are expected to play an increasingly important role in cryptocurrency investing.
BreakOn Group's Market Perspective
At BreakOn Group, cryptocurrency analysis focuses on maintaining a balanced perspective that considers both opportunities and potential risks. Rather than predicting a single outcome, specialists evaluate multiple market scenarios and monitor key indicators that may influence future price movements.
Whether Ethereum continues advancing toward $2,000 or experiences additional consolidation, ongoing analysis remains essential for understanding changing market conditions.
By combining technology, disciplined research, and continuous market monitoring, BreakOn Group aims to provide investors with valuable insights that support informed decision-making in today's fast-moving cryptocurrency markets.
Conclusion
Ethereum's move above $1,800 has renewed optimism across the cryptocurrency market, while reports of significant institutional investment have strengthened expectations for further growth. Although the possibility of reaching $2,000 remains a topic of active discussion, market direction will ultimately depend on a combination of investor sentiment, liquidity, macroeconomic developments, and broader market participation.
At BreakOn Group, careful analysis, disciplined risk management, and continuous monitoring remain the foundation of navigating cryptocurrency markets. By evaluating both bullish and bearish scenarios, investors can better prepare for the opportunities and challenges presented by the evolving digital asset landscape. Long 
 Long
Long
Long 
 Long
Long
Long 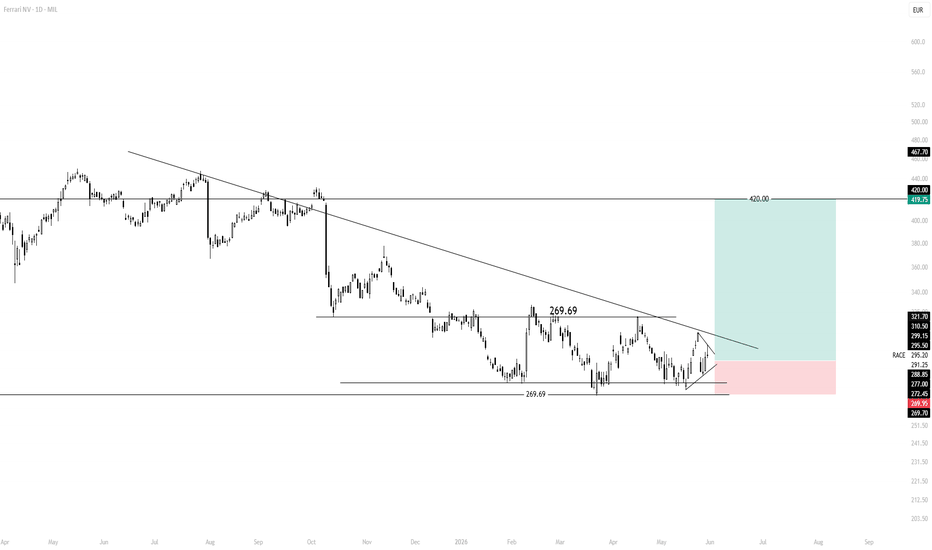
Short 
 Long
Long
E‑Mini S&P Futures Showing Liquidity Expansion to the UpsideCurrent Price: 7204.25 (Analysis was generated on Monday Morning)
Direction: LONG
Confidence level: 85%(Trader consensus remains unified across group metrics.)
Targets
Target 1: 7300.00
Target 2: 7385.00
Stop Levels
Stop 1: 7120.00
Stop 2: 7040.00
Key Insights:
ES futures are currently trading near the upper portion of their recent consolidation, which suggests buyers are maintaining control of the short‑term structure. Futures markets often reveal institutional intent earlier than ETFs, and right now ES isn’t showing signs of aggressive distribution.
One of the biggest clues is how the market reacted after the last selling wave. Instead of accelerating downward, the move slowed and reversed, suggesting buyers were waiting below to absorb liquidity. That’s usually a precursor to upward continuation.
Another factor is the visible liquidity sitting above the market. Futures traders frequently push price toward those zones before any meaningful retracement occurs. This week’s price action could easily turn into a slow but steady upward grind.
Recent Performance:
ES saw sharp volatility recently but quickly stabilized after testing lower liquidity levels. Since then, price has held above short-term averages and continues forming higher intraday lows.
Expert Analysis:
Professional traders on YouTube emphasized the concept of liquidity pools forming above recent highs. According to their analysis, markets tend to move toward these zones because they contain clustered stop orders and breakout entries.
Meanwhile, X sentiment shows traders waiting rather than aggressively shorting. That lack of strong bearish conviction often allows bullish momentum to build quietly.
News Impact:
Macro headlines in 2026 continue to influence futures markets, especially inflation data and interest‑rate expectations. But unless a major surprise hits this week, the current technical structure suggests the path of least resistance remains upward.
Trading Recommendation:
I’m tracking ES for a continuation move higher toward overhead liquidity zones this week, with pullbacks likely being bought by short‑term traders.
 Long
Long
Short 
 Long
Long
Long 
Short 
 Long
Long
Long 
S&P 500 E-mini Futures at major resistance as sellers press theCurrent Price: 6976 (Analysis was generated on Monday Morning)
Direction: SHORT
Confidence level: 62%(Based on repeated resistance references from professional traders, price sitting near a key ceiling, and limited upside conviction)
Targets
Target 1: 6970
Target 2: 6950
Stop Levels
Stop 1: 7010
Stop 2: 7020
Key Insights:
Here’s what’s really driving this setup. Multiple traders highlighted that ES is consolidating just under a well-defined resistance band between roughly 7,000 and 7,016. This zone has rejected price before, and traders keep emphasizing that the market failed to push cleanly through it. When price keeps stalling at the same level, that usually favors sellers in the short term.
Another thing that stood out is how often traders mentioned indecision and poor positioning at highs. ES is already near record levels, while participation and conviction look weak. Several traders explicitly said the index is getting choppy and struggling to sustain upside, which aligns with a short-term fade rather than a breakout chase.
Recent Performance:
You can see all of this clearly in the recent price action. ES has been hovering around the 6,980–7,000 area, with repeated intraday pushes higher failing to hold. The contract is slightly below recent highs and hasn’t shown the kind of follow-through you’d expect if buyers were in control. This sideways-to-slightly-down behavior near resistance often resolves with a pullback before any meaningful upside attempt.
Expert Analysis:
Looking at the collective trader commentary, support around 6,970 and then 6,950 comes up again and again. Several traders pointed to the 6,944–6,950 zone as an important area tied to moving averages and prior consolidation. On the flip side, the 7,010–7,016 region is consistently described as a ceiling that needs strong momentum to break, which just hasn’t shown up yet. When traders across different analyses keep circling the same levels, I pay attention.
News Impact:
The news backdrop isn’t giving bulls much help right now. Traders are clearly cautious ahead of major Fed communication, inflation data, and early earnings signals. Rate-cut optimism looks fragile, and any hawkish surprise could quickly pressure equities. In this kind of environment, markets often drift lower from resistance as traders reduce risk rather than press longs.
Trading Recommendation:
Putting it all together, I’m favoring a SHORT position while ES trades below the 7,000–7,010 resistance zone. I’m looking for an initial move toward 6,970, with a deeper push toward 6,950 if selling accelerates. Risk is clearly defined above 7,010, and a break above 7,020 would invalidate this short-term bearish view. This isn’t about calling a major top, it’s about respecting resistance and trading what the professional traders are actually seeing right now.
Short 
Long 
 Long
Long