ELong
Tesla10. 5. 22 I know how difficult it is to sell your favorite stock because it's done so well for you over a year or two. You even bought corrected lower and this increase your holdings, and now there are signs that the market is going considerably lower. I think Tesla is one of those companies that is going considerably lower.
T

TSLA11.3.22 I looked at a number of stocks here to show you certain behaviors to look for, and in particular the last higher...low If it is close to the high. When the market moves below the last high or low, this is where the Buyers exit the market and wait for the market to move to a lower support. This is A good tool when the last tire low is near the high. I went through some of the comparisons. TSLA Has a lower high and low pattern... and maybe set up for a 135 reversal pattern. but you can'
T

A

BMW SELL SETUPWe are selling this considering that price is expected to be retracing back to close below the previous low.
BShort

Trade tragedy How to trade in recession is very skill full job some thing extra and out of the way is very important


LDO Dont get fooledSpecial Request from one of my fellow followers again:
1) Dont get fooled by a 10% pump
2) Broke the neckline in 2021
3) Just now failed to reclaim it by a drop below and a backtest
Price action since the 2021 low fully corrective in a crystal clear 3-3-5 pattern (just confirmed by breaking 8.02)
=> Retest / Double Bottom 3.97 or lower inevitable
Take-Away:
1) If you can draw a flag, it is a flag.
2) If the 2nd bump fails to break the flag, its going lowaaaa
Hold my beer pls
----
No fi


ENEL (1W) Pottential reversal for Enel during winter ? Hello Folks,
Seems like Energy Sector is attractive right now.
Looking at many European companies (Producers and Electricity Suppliers) could reveal interesting bets for mid-term // or several months during Winter.
ENEL is one of Such companies. Need to dig deeper into Fundamentals. BUT for now considering Technical Analysis of Chart. Seems like Stock is down 50% from last year top.
A) If it Holds price around 4.5 and turn up. It could be last impulsive wave UP (Wave 5 of bigger TimeFrame)


AZIMUT SHARES WILL BE PUMMELED DOWN -27.5%Azimut stock price chart on a monthly scale provides a clear view of the structural price range channel. The stock price has drifted well below the middle line and breaking all support, with a clear SELL SIGNAL where the stock price has drifted below the IKH A/B cloud. The repricing of AZIMUT stock will see AZIMUT pummelled down by -27.5% to €12 euro stock price.
 Short

 Long

 Long

LDO Leonardo: War over?Special request for one of my fellow followers LDO Leonardo
Has been in a bloody downtrend for over 20 years (!)
Lets look at the chart: We are expecting a big ABC correction where as the C wave possibly could have been completed at the yellow arrow but that would be very much truncated.
The recent red (bear) flag most likely is going to resolve to the bottom dictating prices of 4€-6€
One would also argue there is a head n shoulders formation where the neckline just got tested and is headin

Moncler bull-flag BO setupLooking for bullish BO of bull-flag above 50.40 € for an entry and possible follow-through.
 Long

je recommende to Long AppleHello traders, Everything is clear on the chart for you like always. Good luck. If you like the idea, do not forget to support with a like and follow me for next analysis :) Write your comment and opinion below to me.
ALong

Italian "public companies" at crossroads An (equal weight) basket of Unicredit, Intesa, Enel, Eni, Telecom, Poste Italiane, Leonardo ha collapsed to the lowest levels in years.

Long idea on LeonardoPossible long on Leonardo, with a possible test in the supply zone.
SL below the supply zone.
Long
Looking for buys from the bottomHello,
Will be looking for buys from the bottom.
This is a good stock for Juventus fans to pick at this price just for prestige. The stock does not have dividends since it has a negative EPS
Good luck.
 Long

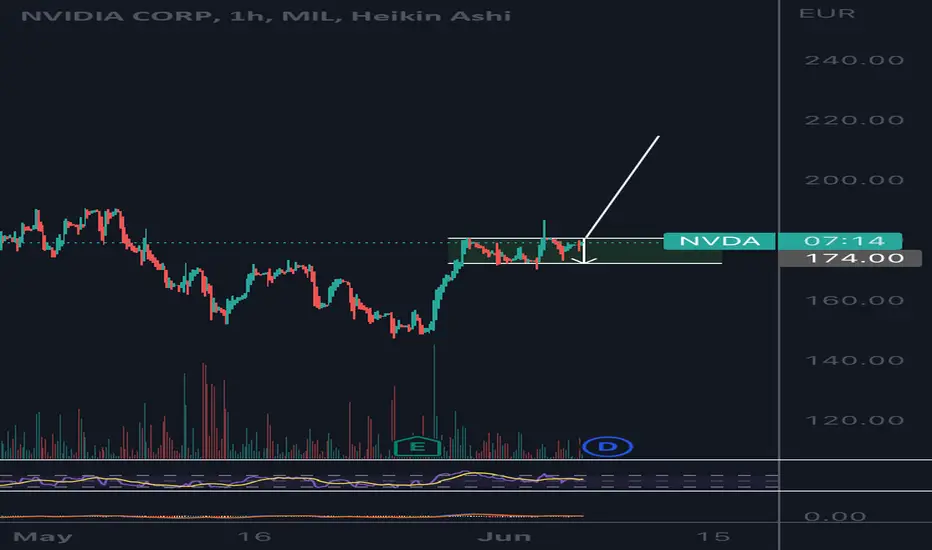
Nvda If we could confirm and flip 180.40 to new support this could take some consildation on top. This could be a bull flag. Reistance 180.40 and support 172.40 target would be 213$
NLong
💎Resurrection of Risk 👑 Join the MC House of LV🕊️Old Money Never
Goes Out Of
Style
www.lvmh.com
LVMH is home to 75 distinguished
Houses rooted in six different sectors
True to tradition, each of our
Brands builds on a specialty legacy
While keeping an unwavering focus on
The exquisite caliber of its products.
In The Words
Of
Chairman Bernard Arnault
"Our objective to strive for solid financial performance and our relentless drive for excellence remind us of our daily commitment to act in such a way as to make the world a better
LLong

GENERALI ASSFor having a better understading of what is happening on this stock about my last idea, on the Montly chart we see a clear break of structure and a retest of it after testing an important trendline(formed in Oct 07).The price has been bouncing over the last 12 years and now finally we see a strong candle formed in March this year breaking all structure and showing us bullish pressure. We can expect more bullish continuation the next months if price manage to break this trendline. Important moni
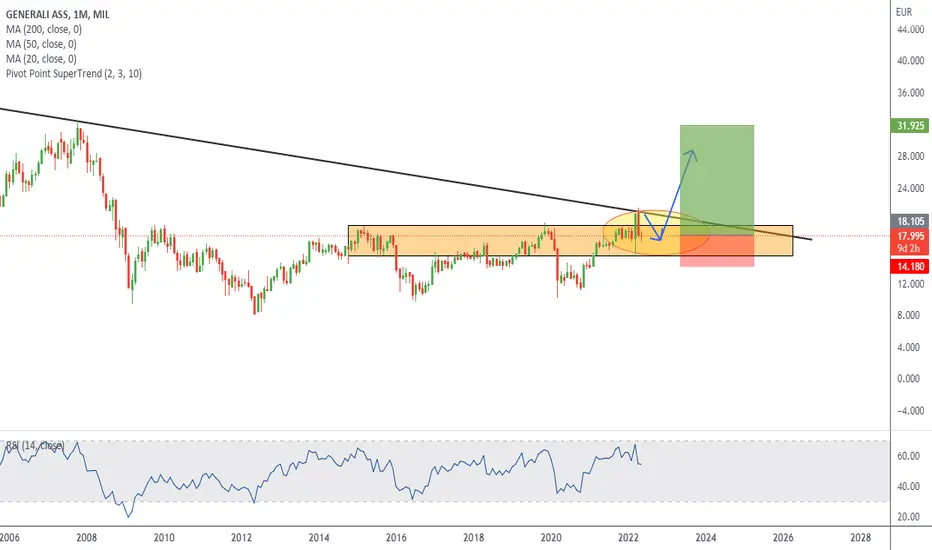
LONG GENERALI ASSGood opportunity to go long. Bullish pressure. I expect the break of the trendline and the continuation higher.
1:3 risk to reward

TSLA....1hThe analysis is based on the price channel analysis only
Waiting for an uptrend to enter a buy or a bearish crossover to enter a sell
T
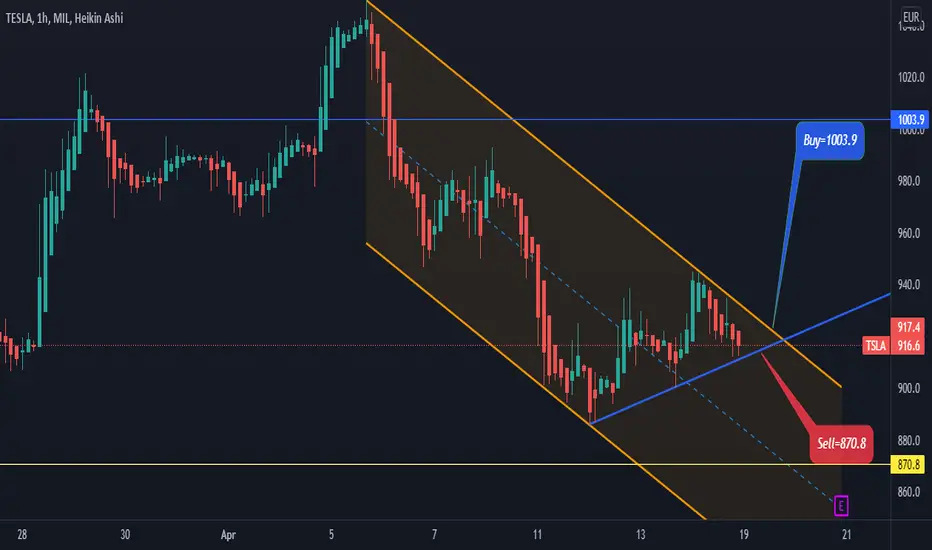
Simple Trend following SetupThis is a simple trend following setup! The trendline gives us enough resistance, that the market should make at least another downmove!
 Short

Moncler (MONC.mi) bearish scenario:The technical figure Pennant can be found in the Italian company Moncler (MONC.mi) at daily chart. Moncler is an Italian luxury fashion brand with French origin mostly known for its skiwear. The Pennant has broken through the support line on 02/04/2022, if the price holds below this level you can have a possible bearish price movement with a forecast for the next 6 days towards 46.860 EUR. Your stop loss order according to experts should be placed at 52.86 EUR if you decide to enter this positio
Short