Long
Long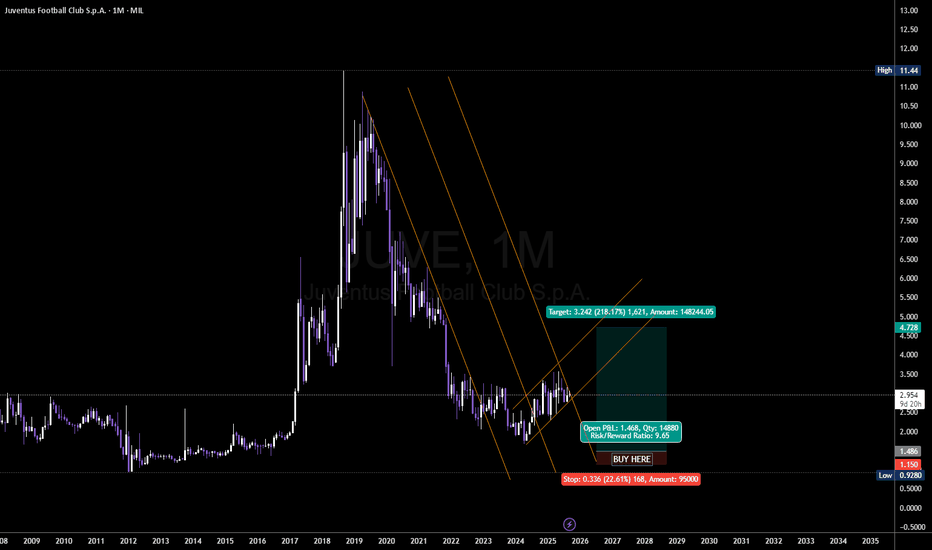
 Short
Short
Spain and the European Automobile Industry Under PressureSpain and the European Automobile Industry Under Pressure: China Tightens the Grip as Exports Sink
Ion Jauregui – Analyst at ActivTrades
The engine of the Spanish economy is starting to stall. The automotive industry, which represents 13% of national exports, is facing in 2025 a downturn driven by both external and internal factors: weaker demand across Europe and the rise of Chinese brands offering aggressively priced vehicles.
Exports Falling, Surplus at Lows
Between January and June, sector exports dropped 8.9% year-on-year to €25.66 billion. The trade surplus collapsed 55%, down to just €2.14 billion. Spain produced 111,601 fewer vehicles compared to the same period last year, reflecting weaker demand in Germany (–4.7%), France (–7.9%), and Italy (–3.6%).
Manufacturers warn that the pressure is becoming unsustainable and are calling for “strong measures” to safeguard the competitiveness of the country’s 18 car plants.
Europe: Mixed Results Among Giants
First-half sales figures paint a mixed picture for Europe’s automotive leaders. Volkswagen regained the top spot in the continent with 1.8 million units sold (+3%), while Stellantis slumped to 1.04 million (–9%). Renault, meanwhile, managed a 6% increase to 700,000 units, supported by the strong performance of SUVs and electric models.
In Spain, Stellantis (Vigo, Zaragoza, Madrid), Renault (Valladolid, Palencia), and Volkswagen/SEAT (Navarra, Martorell) plants concentrate nearly all production. Yet, not even the arrival of Chery—starting assembly at Barcelona’s Zona Franca with Ebro—managed to reverse the trend: export volumes dropped 10.8% to 1.04 million vehicles.
Chery and the Chinese Offensive
Chery’s arrival symbolizes a broader movement: Chinese carmakers, already selling massively in Europe, are now seeking to manufacture within the continent to avoid the tariffs imposed by the EU on imported EVs since October 2024. At the same time, Brussels is negotiating a minimum pricing system to ease downward pressure on European manufacturers.
Stock Market: Three Distinct Strategies
Financial markets reflect the industry’s fragmentation:
Stellantis (NYSE: STLA) trades around US$10, after a semester marked by falling revenues and margin pressure.
Renault (RNO.PA), at €33.5, offers one of the highest dividends in the sector (~6.5%). Analysts set its potential at around €47, implying 40% upside.
Volkswagen (VOW3.DE), at €102.5, maintains a defensive profile with a low P/E (~6x) and a dividend yield of 6%. Within the group, SEAT/CUPRA remains pivotal: revenues rose 2.4% in Q1, though tariff tensions weigh on models like the Tavascan, built in China.
Stellantis (Ticker AT: STLA)
Current trend: consolidating, with a long-term bearish outlook but a short-term upward correction since early August. Moving averages (50, 100, 200) remain bearish, though a bullish crossover between the 50 and 100-day averages seems imminent.
Mixed signals: In July, price crossed above the 20- and 50-day averages, with positive MACD and slightly above-average volume, suggesting a possible technical rebound. Key resistances at US$10.25–10.61; supports at US$9.89–9.53.
Recent indicators:
RSI at 58.81%, pointing to early overbought conditions.
MACD suggests upward momentum, though still below the histogram.
POC around €8.299, last week’s close at €8.646.
Strong supports at €7.133 and the recent low at €6.890.
Conclusion: Technicals indicate a balanced market with potential medium-term recovery if resistance at €9.812 and €11.488 is broken. For now, moving averages and oscillators advise caution.
Renault (Ticker AT: RNO)
Current trend: long-term bearish, short-term rebound forming a consolidation band between €31.13 (lows) and €35.59 (highs). A breakout above this could shift directionality.
Supports/Resistances: Supports at €30.87–31.13. Resistances at €35.59, POC at €39.40, followed by €40.36, €44.59, and February’s high at €52.90.
Recent indicators:
RSI at 46.90%, recovering from deep oversold territory.
MACD hints at upward momentum, though still below histogram.
POC at €39.40, well above current price.
Conclusion: Renault shows signs of technical recovery from oversold levels, but key ceilings remain. A move above €35–40 would be decisive, otherwise resistance could stall momentum.
Volkswagen (VOW3.DE)
Current trend: long-term neutral, forming a possible bullish pennant. Short-term outlook is positive, while medium to long term remains flat.
Supports/Resistances: Supports at €78.86–79.82. Resistances at €114.20, €120.65, and €127.85.
Recent indicators:
RSI at 68.67%, suggesting strong bullish momentum with extended overbought conditions.
MACD remains bullish, both signal and MACD above histogram in positive territory.
POC at €120.65, far above current price.
Conclusion: Volkswagen maintains short-term strength, but strong resistances and high volatility warrant caution, especially if it fails to surpass POC levels.
The Challenge: Sustaining a Strategic Sector
Spanish and European automotive face a decisive 2025: exports falling, trade surplus shrinking, and Chinese competition intensifying. With Stellantis still consolidating, Renault attempting a rebound, and Volkswagen showing limited strength, the sector’s survival hinges on institutional support, competitive electrification, and market diversification. Spain’s industrial and export engine risks losing traction without decisive adaptation.
*******************************************************************************************
The information provided does not constitute investment research. The material has not been prepared in accordance with the legal requirements designed to promote the independence of investment research and such should be considered a marketing communication.
All information has been prepared by ActivTrades ("AT"). The information does not contain a record of AT's prices, or an offer of or solicitation for a transaction in any financial instrument. No representation or warranty is given as to the accuracy or completeness of this information.
Any material provided does not have regard to the specific investment objective and financial situation of any person who may receive it. Past performance and forecasting are not a synonym of a reliable indicator of future performance. AT provides an execution-only service. Consequently, any person acting on the information provided does so at their own risk. Political risk is unpredictable. Central bank actions can vary. Platform tools do not guarantee success.
BAMI FOLLOWING UP
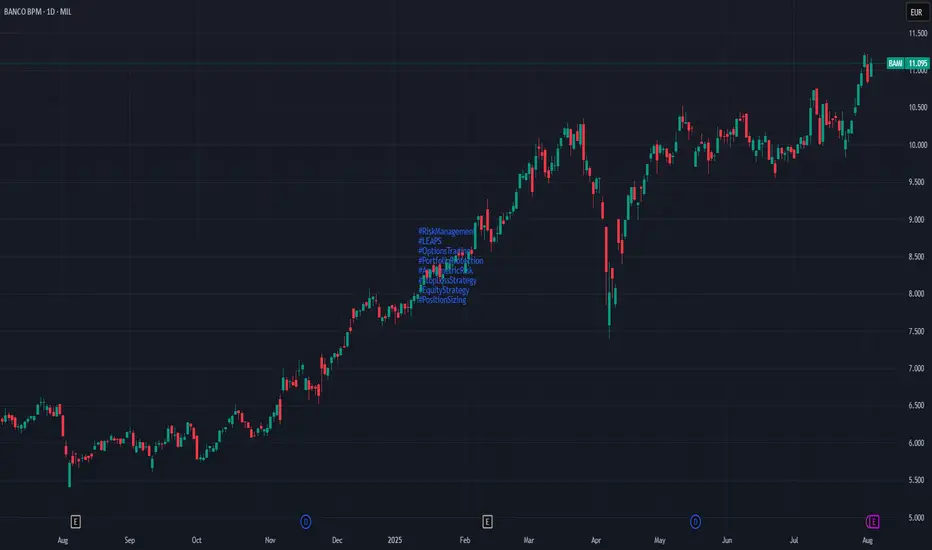
Bought more shares – now holding 560 total
Placed a stop-loss at 10.65 on the first 310 shares (average price 10.54)
Remaining shares are protected by long-dated LEAPS puts
No stop needed on those, as they are insured against major drops
How It Works:
If price falls, I secure a gain on the initial position via the stop-loss.
Then I let the rest ride, knowing the LEAPS puts cover the downside.
In case of a crash, I exit with profits from the puts and potentially re-enter lower.
If price goes up, I stay in, collect dividends, and benefit from price appreciation.
Core Philosophy:
This is position structuring, not stock picking.
Tight risk on the front-end, unlimited time on the back-end.
Currently: 310 shares with stop at 10.65, 250 shares protected by puts
 Long
Long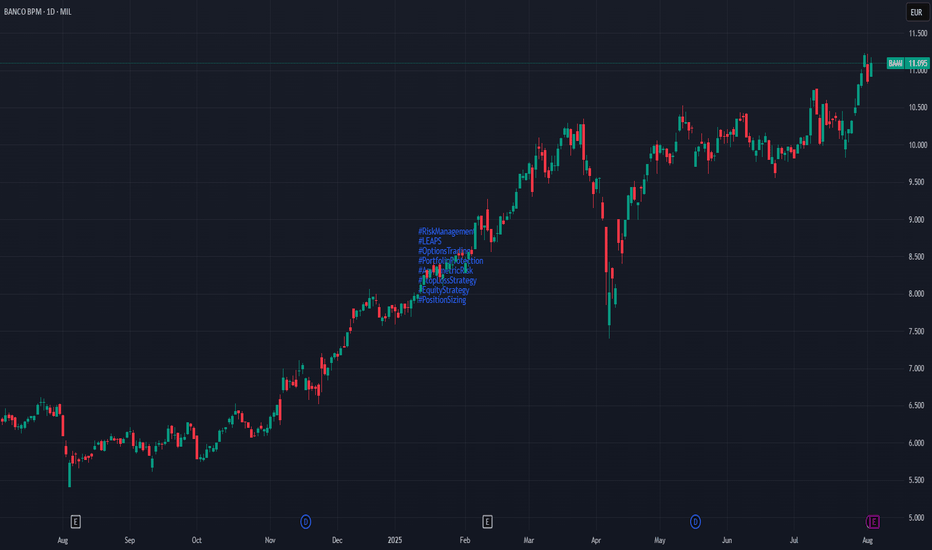
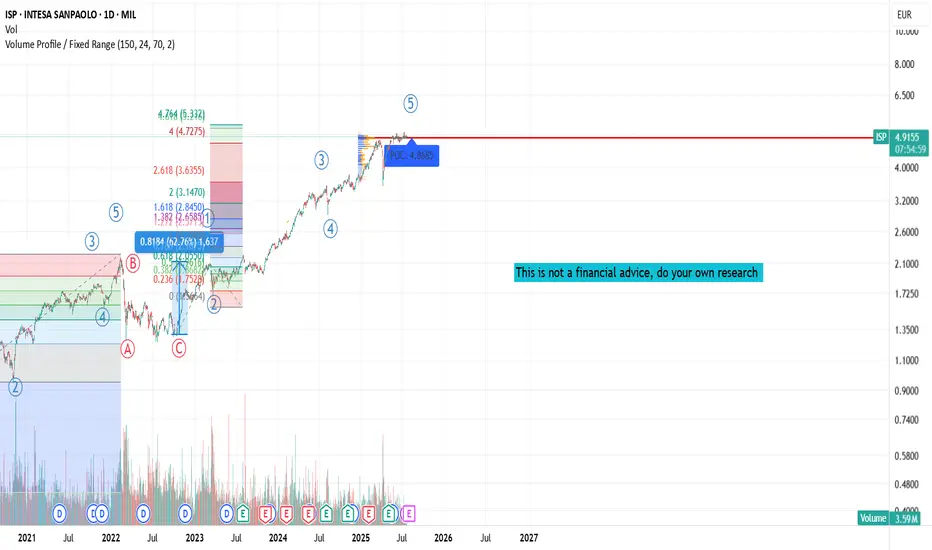
Isp - one of the best ! I've been following Intesa Sanpaolo closely for years.
I started out as an observer, then became a dedicated analyst, and eventually it turned into an investment opportunity.
Between 2018 and 2020, I bought and sold the stock several times, always guided by objective analysis and medium-term strategies.
Over time, I’ve shared my research with more than 2,000 people, many of whom have purchased my studies and used them to inform their own financial decisions.
After nearly 18 years the stock could realistically return above €5. This wasn’t a personal wish, but rather the result of a rigorous analysis of financial statements, management strategy, and long-term technical market patterns.
Financial Performance 2022–2024: Solid and Consistent Growth
✦ 2022
Net profit: €4.35 billion
Despite the inflationary environment, the Group maintained a solid structure, supported by revenue diversification and the resilience of its core business.
✦ 2023
Net profit: €7.7 billion
Growth was driven by a sharp increase in net interest income and strong cost discipline. Dividend payouts increased, further boosting investor appeal.
✦ 2024
Record net profit: €8.7 billion
Net interest income grew by 6.9%, and the cost/income ratio remained around 52%. The bank confirmed its ability to deliver strong results even in complex market conditions.
Outlook for 2025 and Beyond: Sustainable Growth and Strong Shareholder Returns
Guidance for 2025 includes:
Expected net profit > €9 billion
Expansion in core sectors (wealth management, insurance, digital innovation)
Over €4 billion in technology investments
A strategy focused mainly on organic growth, with a cautious approach to extraordinary operations
In Q1 2025, the bank reported a net profit of €2.6 billion (+14% YoY), with an exceptionally low cost/income ratio of 38%.
In addition to operational growth, Intesa Sanpaolo continues to pursue a generous dividend and buyback policy, supported by one of the strongest capital positions among European banks.
This is a financial technical study and not a financial advise. Please do your own research before make any decision.  Long
Long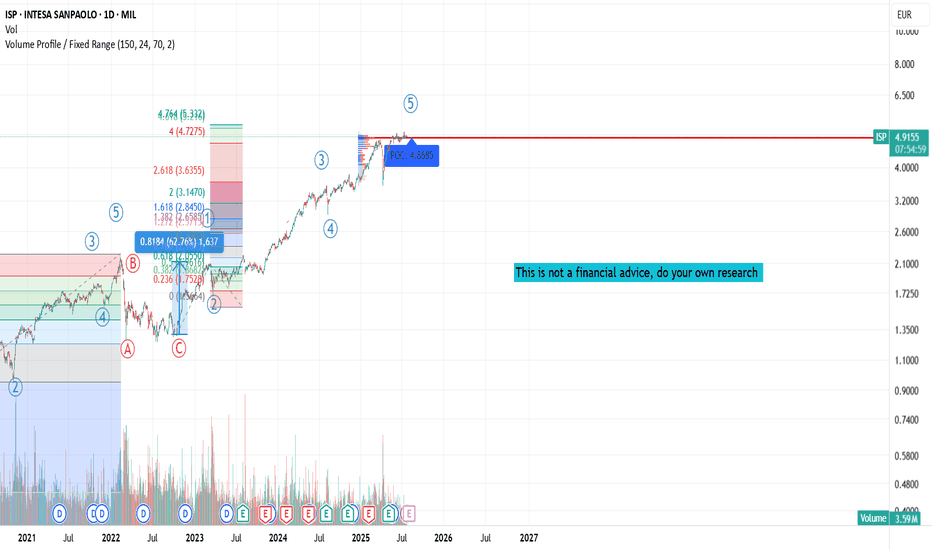
 Short
Short
Football season comes to end. Will Juv and Man U be good?Following this season and the last few seasons, we have seen both clubs drop in form. Man U finishing 15th in the prem and Juv finishing 7th in 2022-2023 season, are signs that these 2 clubs are not in the best shape. Currently, we have seen how PSG managed to become the best team in Europe after their first Champions League trophee. So could both teams make a U-turn and become dominat as they once used to be? Both teams are listed on the stock market and if one beleives that they have seen their worst season so far, could they perform even worse? Because personally, I have never witnessed Man U being ranked 15th in the premier league ever. So, would it be a good investment to speculate on Man U's or Juventus's future, or are both teams far gone from their prime and a return to a new prime is far fetched?
Let's also analyse their stock, depsite their bad few seasons (even though Juventus were 3rd and 4th in Seria A this year and last year):
1)Juventus
Revenue
For the 2023–24 fiscal year, Juventus reported revenues of approximately €395 million. This figure represents a decline from previous years, primarily due to the club's absence from European competitions, which significantly impacted broadcasting and matchday income.
Football Italia
Debt
As of the latest reports, Juventus's total debt stands at around €242 million, a reduction from the previous year's €329 million. The club has undertaken measures to reduce its debt, including cost-cutting strategies and seeking shareholder suppor
2)Manchester United
Revenue
In the 2023–24 season, Manchester United generated revenues of approximately £661.8 million. Despite on-pitch struggles, the club's strong commercial operations and global fanbase have sustained its revenue levels.
Debt
Manchester United's total debt is reported to be around £731.5 million. The club continues to manage its debt obligations, which include servicing interest payments and addressing long-term financial commitments.
-Disclaimer: This analysis is for informational and educational purposes only and does not constitute financial advice, investment recommendation, or an offer to buy or sell any securities. Stock prices, valuations, and performance metrics are subject to change and may be outdated. Always conduct your own due diligence and consult with a licensed financial advisor before making investment decisions. The information presented may contain inaccuracies and should not be solely relied upon for financial decisions. I am not personally liable for your own losses, this is not financial advise.
Long 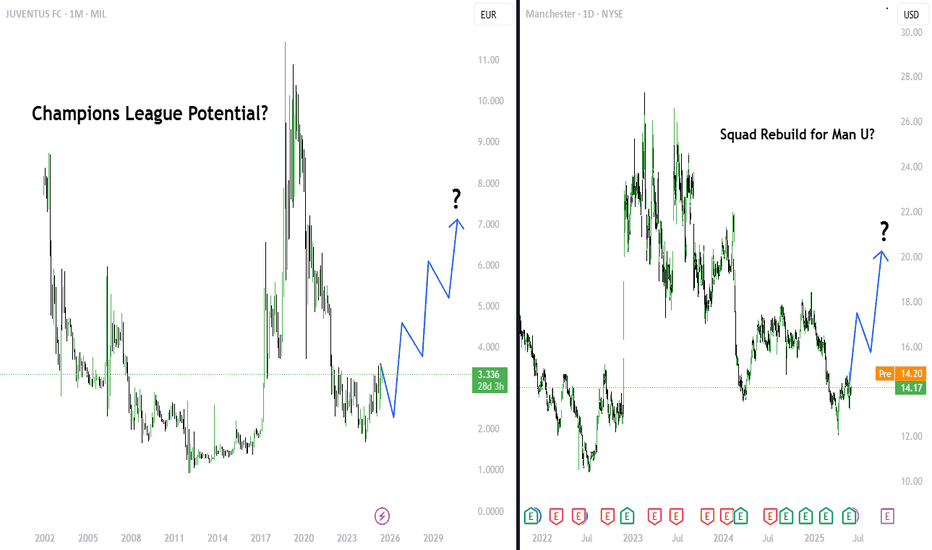
 Long
Long
 Long
Long
 Long
Long
 Long
Long
 Long
Long
 Long
Long
ISP | Intesa SanpaoloScreener Buy Idea
Intesa Sanpaolo SpA engages in the provision of financial products and banking services. It operates through the following segments: Banca dei Territori, IMI Corporate and Investment Banking, International Subsidiary Banks, Private Banking, Asset Management, Insurance, and Corporate Centre. The Banca dei Territori segment oversees the traditional lending and deposit collection activities in Italy. The IMI Corporate and Investment Banking segment deals with corporate and investment banking; and acts as a partner for corporates, public administration, and financial institutions. The International Subsidiary Banks segment operates on international markets through subsidiary and associated banks. The Private Banking segment specializes in the asset management of private and high net worth individuals. The Asset Management segment develops solutions targeted at the firm's customers, commercial networks, and institutional clientele. The Insurance segment includes Intesa Sanpaolo Vita, Fideuram Vita, Intesa Sanpaolo Assicura, and Intesa Sanpaolo Assicura. The Corporate Centre segment comprises of the group's treasury and the Capital Light Bank. The company was founded in 1931 and is headquartered in Turin, Italy.
Long 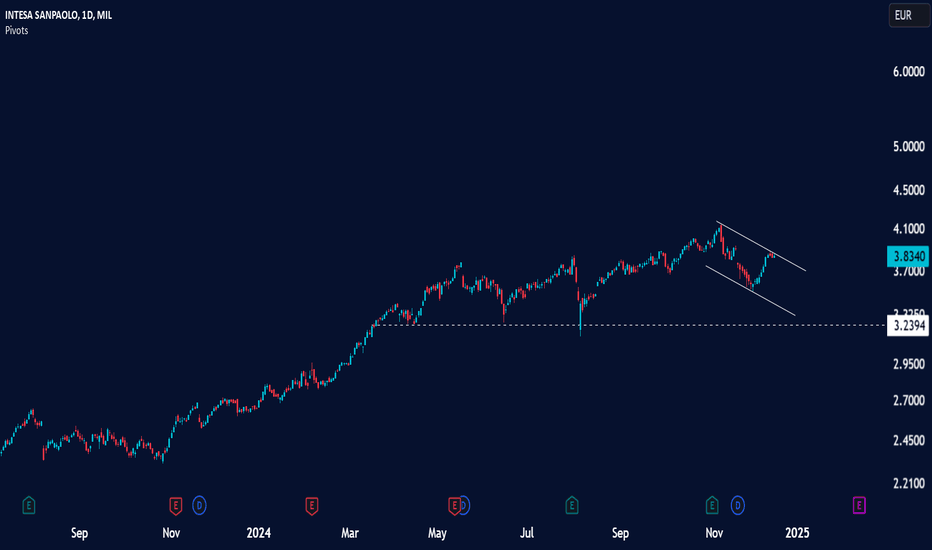
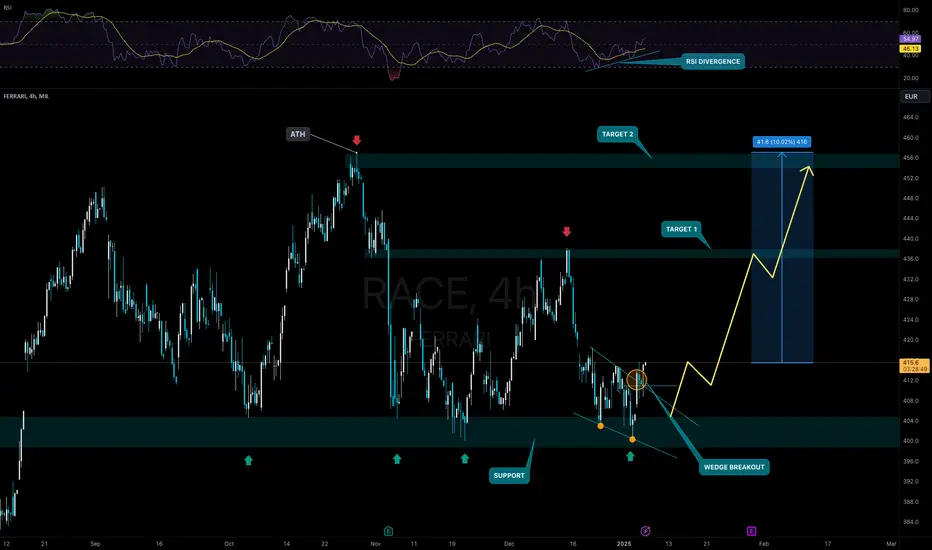
Ferrari - Don't Miss Out on 50% ROI!Very strong setup here. Ferrari respects the SMA200 for years and did touch the SMA200 and bounce from it. It also respected the current trendline and the SMA200 and trendline bounce did happen at the 23rd Fib retrace level. Very bullish setup.
--
🐂 Trade Idea: Long - RACE
🔥 Account Risk: 20.00%
📈 Recommended Product: Stock
🔍 Entry: +/- 426,00
🐿 DCA: No
😫 Stop-Loss: 390,00
🎯 Take-Profit #1: 600.00 (50%)
🎯 Trail Rest: Yes
🚨🚨🚨 Important: Don’t forget to always wait for strong confirmation once possible entry zone is reached. Trade ideas don’t work all the time no matter how good they look. Do not get a victim of FOMO, there is always another trade idea waiting. 🚨🚨🚨
If you like what you see don’t forget to leave a comment 💬 or smash that like ❤️ button!
—
Ferrari is a super strong brand. Backlog is huge and current waiting time is measured in years not months. Luxury stocks were punished during the last months because of fear of growth and a weak consumer but Ferrari is somewhat else. Misconceptions regarding shipments and China are putting pressure on Ferrari's shares since the third-quarter announcement. Nevertheless, the shipments' decline is a result of an ERP transition, and the reduction in China is intentional.
Don't forget, people who buy Ferraris do not care about inflation or the economic situation of a country. Also, you can't lease a Ferrari, you can only buy it. This gives the manufacturer a strong cashflow. In addition, Ferrari's unique market position, strong brand, and prudent management justify its high valuation and promise market-beating returns.
—
Disclaimer & Disclosures pursuant to §34b WpHG
The trades shown here related to stocks, cryptos, commodities, ETFs and funds are always subject to risks. All texts as well as the notes and information do not constitute investment advice or recommendations. They have been taken from publicly available sources to the best of our knowledge and belief. All information provided (all thoughts, forecasts, comments, hints, advice, stop loss, take profit, etc.) are for educational and private entertainment purposes only.
Nevertheless, no liability can be assumed for the correctness in each individual case. Should visitors to this site adopt the content provided as their own or follow any advice given, they act on their own responsibility. Long 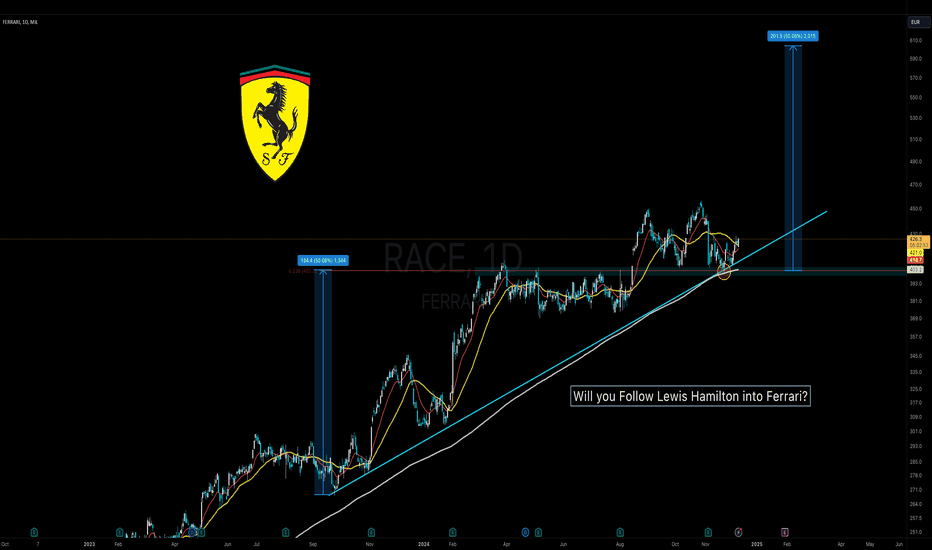
 Short
Short
Coinbase Momentous Swing: Trade Idea Greetings Everyone ,
Today, we are diving into the ticker symbol NASDAQ:COIN , representing Coinbase.
For this analysis, I’ve charted the Euro ticker for Coinbase ( MIL:1COIN ), which mirrors the same price action.
Quick Facts About Coinbase:
• Coinbase is an online trading platform where users can buy and sell cryptocurrencies, often referred to as “coins” or “altcoins.”
• The stock is heavily influenced by the cryptocurrency market. Historically, during Bitcoin bull markets, Coinbase’s price has shown a tendency to surge.
Trading Plan Setup
There is two sides to a Coin 🪙 .
Similarly this pennant setup has two possible outcomes. I have charted the zones where I would expect price to break above or reject in order to continue in its path.
Point 1: Optimal Entry
We are currently underneath that major resistance price level. If you were to go long here with a close stop loss & aim for the primary zone / green line - In the event that price does continue higher you would have the best entry & area to take more risk.
However, Is this the most optimal way to trade a pennant? Not at all.
The recommended setup is a break above the green line (peak) potentially a hold and then continuation higher.
It begs the question what rules do professional traders follow in this scenario? Are you using option strategies like Long Straddle, Long Strangle or Iron Condor?
I would love to know please drop a comment below.
Point 2: Consolidation
Price is consolidating this can continue for days or another week? Monitor price action with alerts one higher one lower.
Point 3: Breakout without Volume
A breakout without volume confirmation is doomed to fail. Be careful of this scenario.
Second subject:
In my previous post, I have created a quick survey - please feel free to complete it so that I can provide relevant information to you.
Best,
C - Lemard
 Long
Long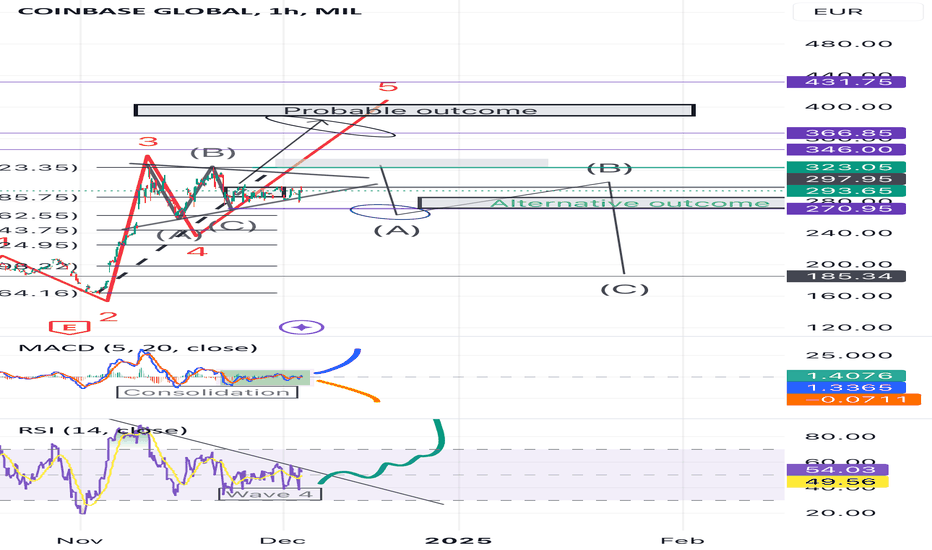
 Long
Long
 Long
Long
 Long
Long