Long
Long
 Long
Long
 Long
Long
 Long
Long
 Long
Long
 Long
Long
Bullish Divergence: BUY signal?If you're planning on buying Jollibee ( PSE:JFC ) stocks looks like this might be a good time to buy. However do not go buy all in, buy in spreads. Word of caution; there are current political or national issues currently going on in the country, so it might even go a bit lower and head for the next support.
If you believe Jollibee ( PSE:JFC ) will be there in the long term then do peso-cost averaging; it is possible it might take a while before it recovers as well. Treat this as the time to invest (we're talking about investing monthly with your extra money) while the price is still low, and possibly lower before the US listing. Just a reminder -repeat after me - NEVER invest what you cannot afford to lose.
The recent bounce you were seeing? Those are the investors upon hearing that Jollibee will be listing their stock soon in the US Market with ticker JFCI.
Here's the news about it from Jollibeegroup.com
" JFC Plans U.S. Listing for an International Company, Keeps PH Business on PSE
MANILA, Philippines. January 6, 2026 – Jollibee Foods Corporation ( PSE:JFC ), a homegrown Philippine company, announces a historic step toward global expansion: it plans to create a standalone international business with the intent to list the international company on a U.S. securities exchange. The Philippine business will remain listed on the Philippine Stock Exchange, and existing shareholders will own both the Philippine and international companies, giving them the opportunity to participate in the growth of two strong and complementary enterprises.
“As a proudly homegrown Philippine company, we carry our heritage and express our national pride into this next chapter of our journey. Our move toward an international listing demonstrates the strength of the Jollibee Group, a company with Filipino roots competing on the world stage,” said Ernesto Tanmantiong, Jollibee Group Global President and Chief Executive Officer.
Jollibee Foods Corporation, which will include all Philippine operations and businesses, will represent a focused domestic consumer platform anchored on a resilient, strongly growing, cash-generative Philippine food-service business with leading brands, dominant market presence, and loyal customers. It offers stable earnings and continued opportunity for domestic expansion, and will remain listed on the Philippine Stock Exchange, offering investors access to the Philippine market’s growth.
The proposed Jollibee Foods Corporation International (JFCI), which will include all operations and businesses outside the Philippines, will represent a global growth company with a portfolio of fast-growing international concepts across multiple categories and geographies. Built on a capital-light model with significant whitespace for expansion, it is positioned to operate in markets that support companies pursuing international scale, innovation, and long-term global growth.
Once implemented, the transaction is expected to result in JFC shareholders receiving shares in JFCI in line with their existing ownership in JFC, subject to taxes and regulatory approvals. Shareholders may then decide whether to hold or sell their shares in each company separately. This structure is designed to give investors more choice, enabling them to engage with the business profile most aligned with their investment preferences, whether a resilient and growing domestic platform or a high-growth international company.
Execution and Timeline
JFC has engaged both local and international advisers and has begun work on the proposed structure and potential U.S. listing, including determining the appropriate structure, timeline, and any required internal reorganization. The transaction is targeted for completion in late 2027, subject to market conditions, regulatory approvals, and the completion of customary reviews.
The details outlined above remain preliminary and may change. There is no certainty that the separation or listing will proceed as described, or at all. This announcement does not constitute an offer to sell or a solicitation to buy securities. Further disclosures will be made as required."
--
Good luck!  Long
Long
Long 
 Long
Long
 Long
Long
 Long
Long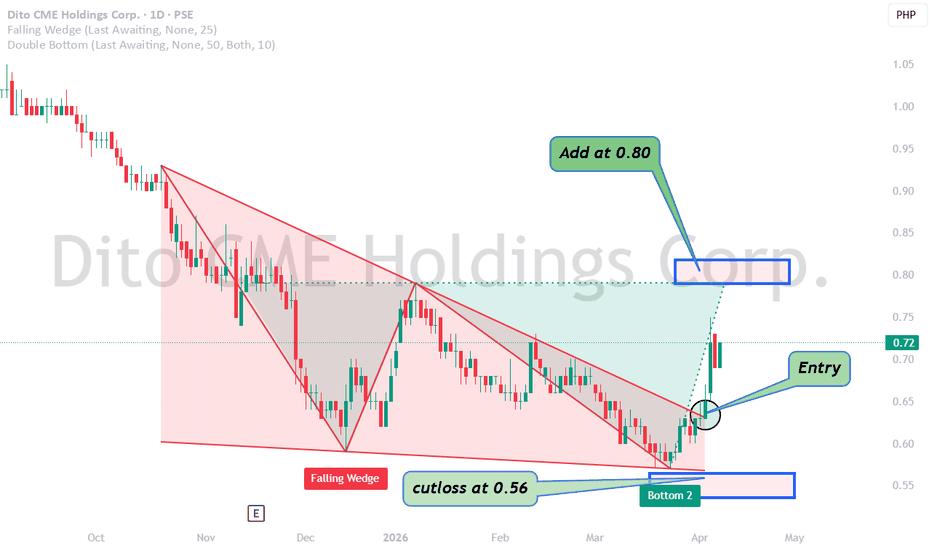
 Long
Long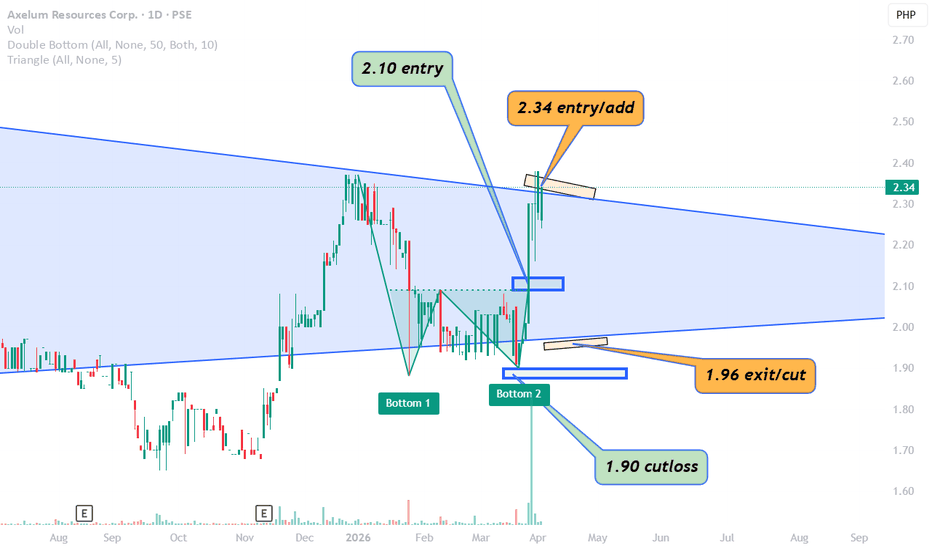
 Long
Long
 Long
Long
Long 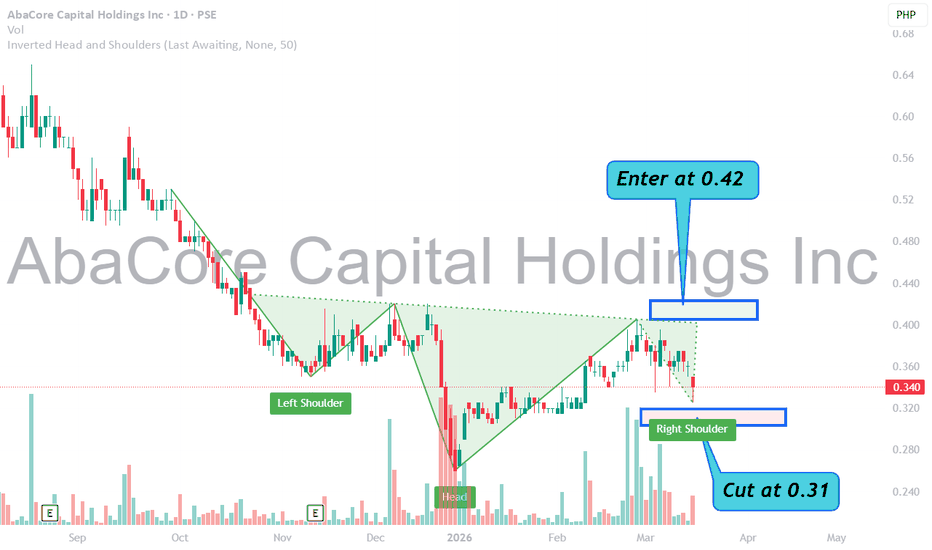
 Long
Long
 Long
Long
 Long
Long
 Long
Long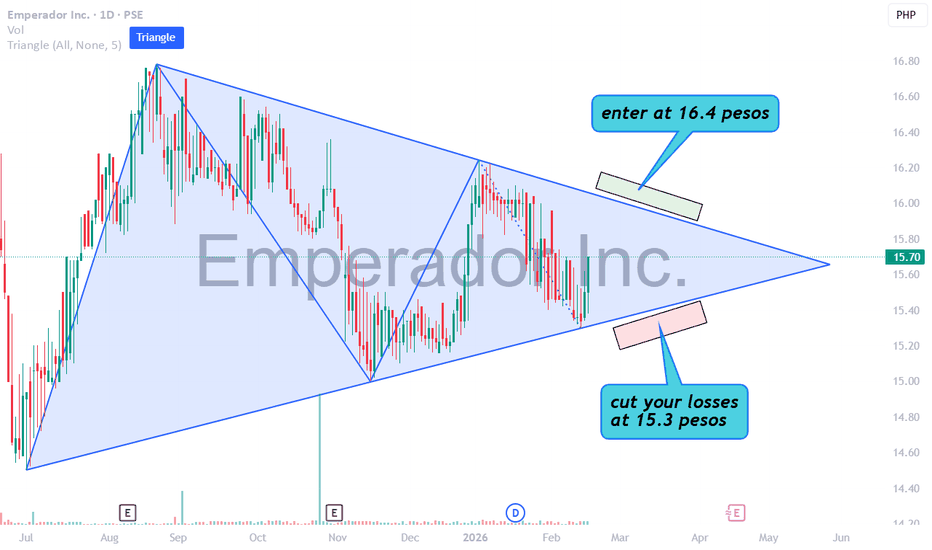
 Long
Long
 Long
Long