• Products
  • Community
  • Markets
  • Brokers
  • More
Get started
  • Markets
  • /Philippines
  • /Stocks
  • /Ideas
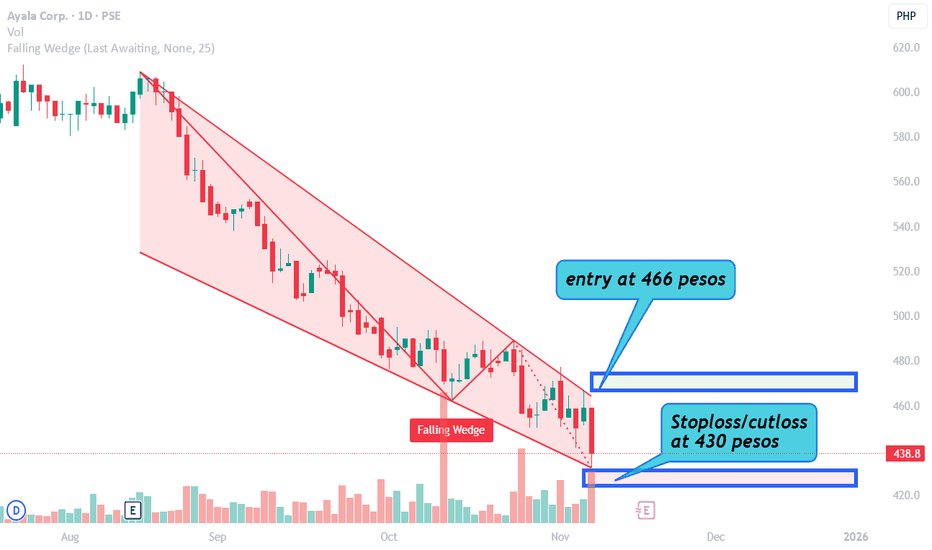
AC Reversal Trade (Bluechip Stock)Wait until AC's price is at 466 pesos then make an entry (breakout from upper line of falling wedge pattern). After your entry, put a stoploss (cutloss) at 430 pesos. Goodluck on your trades. May you trade well.
PSE:ACLong
by tradersdenph
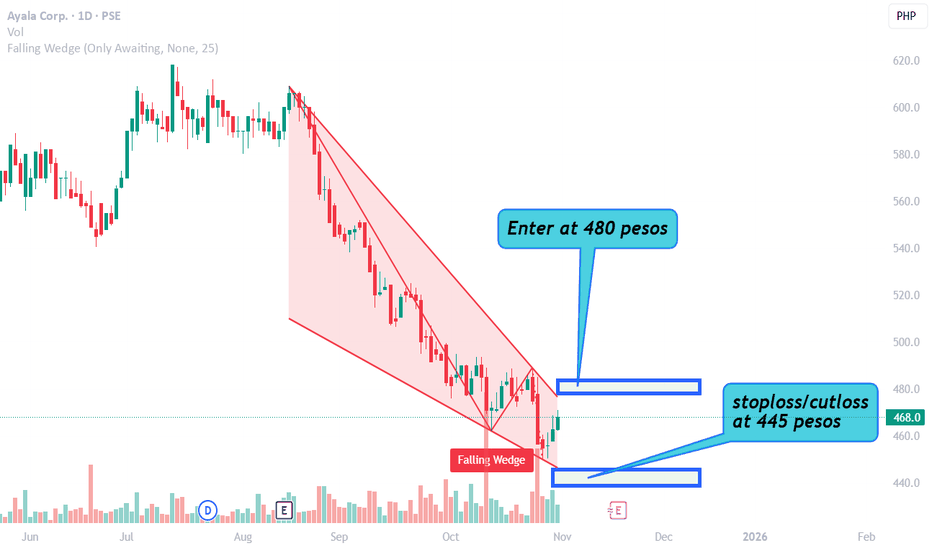
AC Reversal Trade (Bluechip Magic)This is a very straightforward trade. A falling wedge pattern appeared on AC's price. It is a bullish reversal pattern. You enter at at 480 pesos. Your stoploss or cutloss point is on 445 pesos. Simple. Good Plan. Bluechip Stock.
PSE:ACLong
by tradersdenph
CBC Bank Stock Recovery TradeIf the market is down, recovery will aways start with banks. That is where money flows from new business being created to salary of employees being given a job. They all need the bank to function. This is a simple Pivot Trade. The concept is pretty basic. You let the price bottom at S4. If the price do not break S4 meaning it respected that support level then wait for the price to break S3. Enter upon S3 breakout at 55.6 pesos and put a stoploss or cutloss point at S4 break around 52.4 pesos. Your risk is around 6 percent. I hope this helps. Goodluck on your trades.
PSE:CBCLong
by tradersdenph
MBT (Bank Stock Bullish Reversal Trade)An inverted head and shoulder is being formed on MBT. This is a pretty straightforward pattern. You buy upon the breakout of the neckline. You put a stoploss point below the right shoulder. The idea here is to let the price break its swing high then cut your losses once the price go back down and breaks support or swing low. Entry is at 71 pesos or above it. Your cutlloss point is below 67.5 pesos so around 67.45 pesos is okay. This is a low-risk trade. Your risking close to 5 percent on this trade.
PSE:MBTLong
by tradersdenph
Buy on pullbackAlready bougth on breakout. Add on pullback on upside reversal off support.
PSE:MRC
by Oliver1002
11
Bank Stock Reversal Trade (UBP)This stock used to be a star. It fell to earth hard. Now, its showing some potential reversal trade. Enter at 31.5 or a little above it. Cut your losses at 28.80 or a little below it. Your potential risk here is close to 9 percent. May you trade well.
PSE:UBPLong
by tradersdenph
GMA7 Bullish Reversal TradeThis stock is giving a silent bullish reversal vibe. Falling wedge pattern appeared on this stock. Enter at 5.45 or a little above it. That is a zone above the pattern's resistance/upper line. You are basically entering on breakout. Cut your losses at 3.69 or a little below it. That shows a break on support/lower line of the pattern. There is a 14 percent plus potential loss on this trade. May you trade well.
PSE:GMA7Long
by tradersdenph
ACEN Bullish ReversalACEN created a bullish reversal chart pattern. A double bottom pattern. Entry is on the break of the neckline. Put a stoploss or a cutloss point below the second bottom. If you have entered on the breakout then you have more or less 10 percent risk. (Measured from entry to stoploss) Lets see how this trade works out.
PSE:ACENLong
by tradersdenph
SM Sitting At Support Zone (5% Potential Loss Trade?)SM is currently sitting at support zone. Support levels are breakable. You can trade this stock based on how much loss you can tolerate. A 5 percent risk is tolerable. You can enter around 745 pesos area and put a stoploss at 5 percent or 707 pesos. This trade is not about the support level being a magic level where price will stop going down. The 745 pesos level can be broken. This is more about risking 5 percent on a bluechip stock. Goodluck!
PSE:SMLong
by tradersdenph
CNVRG Price Action/Chart Pattern TradeThis is pretty straightforward trade. Entry on a bullish reversal pattern and exit on a bearish reversal pattern. The entry pattern is Double Bottom. Entry point is above the neckline. When price broke the neckline, that is where you enter. Put a stoploss or cutloss point below the second bottom after entry. The exit pattern is Rising Wedge. Exit when the lower line or the support line of the pattern was broken. Over 83 percent gain. Bonus avoidance of a massive downtrend as well.
PSE:CNVRG
by tradersdenph
SMPH Chart Analysis Aug 26, 2025First off, SMPH is a bluechip stock in PSE. The price of SMPH made a triple bottom chart pattern. Triple bottom is a bullish reversal pattern. The entry is on the break of the neckline. You put a stoploss below the right (3rd) shoulder after entry. Triple bottom chart pattern is a "prove me your strong by breaking out" type of pattern. Most traders confuse triple bottom as a pattern to buy near the bottom. You do not buy near the bottom on this type of pattern. You buy on breakouts. Any chart pattern can either succeed or fail. Near bottom buying is a step closer to the chart pattern failing so avoid that. Calm yourself down and wait for the breakout. BER months is coming and that might trigger some movement on this stock. Goodluck on your trades. Trade well.
PSE:SMPHLong
by tradersdenph
NOW Bullish Reversal/Bounce Trade Using Chart PatternA falling wedge pattern which is a bullish reversal pattern showed up in NOW's price movements on a daily timeframe. There is a more or less 15 percent risk from entry to stoploss. This trade made around 60 percent profit currently. Your exit is either a bearish reversal pattern or you can just trail your profits using some moving average that is moving closer to the price.
PSE:NOWLong
by tradersdenph
PLUS TRENDLINE TRADE IDEA Aug 18, 2025There is a trendline resistance and trendline support on 30-minute timeframe. If the price breaks the trendline resistance then you may execute a buy (Long) trade. You put your stoploss below the trendline support. If the price breaks the trendline support instead of breaking the trendline resistance then you avoid PLUS. Either the price goes up or it goes down. Do not predict. Just react whatever movement the price does. Hope this helps. Trade well.
PSE:PLUS
by tradersdenph
11
DITO Inverted H&S Trade Idea Aug 18, 2025DITO is trying to create an inverted head and shoulders pattern. There is a lot to unpack here so let me go through it one by one. The first is the inverted head and shoulders pattern. The price needs to go to a downtrend for it to be able to create an inverted head and shoulders pattern. This pattern shows up at the end of a downtrend that is why it is being considered as a bullish reversal pattern. The downtrend is for the creation of the first shoulder. It needs to come from a higher price sliding down. Contrary to what others think, there is no perfect head ans houlders or inverted head and shoulders pattern. Its not about the pattern being perfect. Its all about what the pattern shows you. There should be a downtrend then the price bottoms. It stops going down. It starts going up again from that first bottom then it will hit some form of resistance that it cannot break. It will slide down again. The second slide is deeper. It will find its bottom but that bottom is lower than the first bottom. It will again start to go up. It will hit some form of resistance again, It will go down for the third time. The third slide down is not as deep as the second slide hinting at some form of buying pressure that is present. After the third slide, it will go up again and it will finally break that "unbreakable" resistance level which we call "the neckline." When the neckline is broken then and only then is the time you make an entry. Your stoploss should be placed below the last bottom or what we call the "right shoulder." In fairness to DITO, there is still some room for the price to go down before it starts to go up and break that neckline (If this is indeed a successful inverted head and shoulders pattern). The price to watch is 1.20 pesos. If the price breaks 1.2 pesos then you enter. Put a stoploss at 0.99 pesos upon entry. Neckline break is the only thing that matters to an inverted head and shoulders. Wait for it to happen before any entry. Do not try and enter early. Be patient. Lets see what happens to this tarde.
PSE:DITO
by tradersdenph
ABS Reversal Trade And Analysis Aug 16, 2025A Falling Wedge pattern showed up on ABS chart. It is a tradeable bullish reversal pattern. A falling wedge pattern is all about trendline resistance and trendline support. ABS price has been going up and down creating this narrowing range. If it breaks the trendline resistance then you have a bullish breakout. If it breaks the trendline support then you have a bearish breakout. Bearish breakout or what we call "breakdown" is useless right now in PSE market since there is no shorting available to retail traders yet as of writing this analysis. This trade is very simple. There is a trendline resistance at 4.2 pesos. If the price breaks it or if the price goes up to 4.21 or higher then you can enter. You are entering on a breakout of the upper line of the Falling Wedge pattern. Upon entry, you set your stoploss at 3.94 pesos. That is the price below the lower line of the pattern. That gives you an exit if the price ever breaks the lower line. Lets talk about risk. How much risk are you taking on this trade? Well, to do that, you measure from 4.21 pesos down to 3.94 pesos. That is over 6 percent. If you take this trade then you are looking at a potential 6 percent loss. The risk will vary depending on what price you have entered. This is a bullish reversal trade. I gave you an entry price and a cutloss price. Your exit with gain will come from a different chart pattern. A bearish reversal one. Thank you. Goodluck on your trade. May you trade well.
PSE:ABSLong
by tradersdenph
ACEN Trading Idea Aug 10 2025ACEN made a triangle chart pattern. A triangle chart pattern can be bullish or bearish depending which direction the breaks happen. In CAEN's case, it has broken the support side of the triangle. It is a bearish break. After that break, ACEN's price made a downtrend from October 2024 to June 2025. Almost 8 months of its price just slowly sliding down. The downtrend took a pause around June. You can clearly see that some form of range and sideways movement took place after that long downtrend. A pause on an uptrend is just a pause unless some form of reversal pattern appears. A pause in a downtrend is just a pause unless some form of reversal pattern appears. The pause itself is insignificant for it can either be a lack of interest from buyers/sellers or a little exhaustion from the previous trend. The reversal pattern that the price creates after a downtrend or an uptrend matters. In ACEN's case, after a long downtrend, the price created a FALLING WEDGE pattern. Falling Wedge pattern is a bullish reversal pattern. This pattern does not magically appear from heaven. Haha! It was created by the price when the price moved up and down creating a trendline support and resistance. Think of it this way. ACEN's price went 5.16 pesos to 2.42 pesos on a steady downtrend. From 2.42 it went up to 2.75. From 2.75 it went down to 2.39. From 2.39 it went up again to 2.63. From 2.63 it went down again to 2.36. It is moving up and down creating a narrow range. The range gets closer and closer. This happened from June to Aug. It went from an 8-month downtrend and suddenly it kept moving up and down on a narrow range in a matter of two months. Its a clear change of behavior to the price movement. That is basically what this "reversal pattern" is trying to show you. There is no magic involved. Its a change on the price behavior/movement. Lets talk about The Falling Wedge. Its basically a trendline resistance and trendline support. Your entry is on the breakout of the trendline resistance or the upper line of the falling wedge. You put a stoploss below the trendline support or the lower line of the falling wedge after your entry. Currently, you enter if it breaks 2.60 pesos with a stoploss on 2.33 pesos. This is a Falling wedge pattern. Take note of the word "falling" which means the movement is dynamic. If it does not break 2.60 pesos then you will have other price to enter on depending which part of its trendline resistance is broken. If you plan to trade this stock then you must measure from your entry price down to your stoploss price. That is basically your risk. That is the percentage you are risking in trading this pattern. If it breaks 2.60 pesos and you have your stoploss at 2.33 then you are risking a 10 percent loss. No entries should be made unless the price breaks the upper line/ trendline resistance. As the price keep moving on a narrow range, the risk will keep getting smaller and smaller. Put this stock on your watchlist. Observe what happens to it. I hope this analysis helps you. May you trade well.
PSE:ACENLong
by tradersdenph
Momentum Trade On PLUS (The Why And The How)I managed to trade PLUS twice due to its Momentum. Let me share an insight on how I did it and why. My first trade was on July 18. PLUS has been on a downtrend for almost two weeks prior to that. From 65 pesos (1.15 usd) down to 19 pesos (0.33 usd). There was a steady decline in its price when it was on a downtrend. There was no volatility. The price was just steadily decreasing. Sellers just overwhelmed buyers. There was just to much selling pressure. July 18 came and there was volatility on that day. The price did not just steadily decrease. It went up and down. It went down to 15 pesos at open then pushed back up to 20 pesos then down again to 16 pesos then up again. There was momentum. At the first hour of the market opening, PLUS set a range. The bottom was 15 and the top was 22. As soon as the range was established, I bought near the bottom. I sold near the top for the price was still going up and down. I closed my computer and called it a day that time. For a few days, PLUS was on a steady climb. Buyers kept overwhelming sellers. The buying pressure was there. The price climb was steady. There was no volatility. There was no momentum. I stayed away from PLUS. On the 1st of AUG, the price of PLUS went volatile again. It went up and down. It made a range of 28 pesos as top and 18 pesos as the bottom. It went up hard then it went down hard. On and on and on. There was volatility. There was momentum. I bought near the bottom of the range again and sold it above 25 pesos. I made two very successful trade on PLUS. I gave you and idea on how I traded it and why. Philippine market is illiquid. There is no liquidity. You seldom see volatility and momentum on a Philippine stock. Its so illiquid that when one stock managed to have momentum then almost everyone takes notice. Everyone joins in. That makes the stock price even more volatile. Everyone is hungry for that scalping or day trade. When I talk about momentum and volatility, most traders misunderstood it as "explosive" or high volume. Momentum and volatility is the rate of the price change. It has very little to do with volume. There are volume-less volatility and volume-less momentum. Think about a stock going from 1 dollar to 10 dollars in a year. That steady rise in price is called an uptrend. Its steady. It takes a lot of days. Its takes a lot of candles. Now, think about a stock that goes from 1 dollar to 10 dollars in one day. That is momentum. Trend is a direction. Momentum is a rate of price change. If you want to follow a trend then you use trend-following tools like moving averages,Williams Alligator, etc. When you are looking for momentum then you use tools like bollinger band, RSI, etc. These are tools that will not tell you which direction the price is going yet it tells you that there is an unusually high momentum going on. Volume is a product of volatility and momentum. The more traders get in, the more volatile the price swings become then the more volume is registered. It is not a predictor of which price will have momentum. The same way that the volume is not a predictor of which price will have a successful breakout and which price will have a failed breakout. There are volume-less successful breakouts and there are high-volume failed breakouts. I hope you learn a little on my post. I will try to post more here. I apologize if my post do not have that proper structure yet. I seem to be jumping from one idea to the next. I'm just typing as i recall the trade. I will try to post better on my next posts. Thank you.
PSE:PLUSEducation
by tradersdenph
33
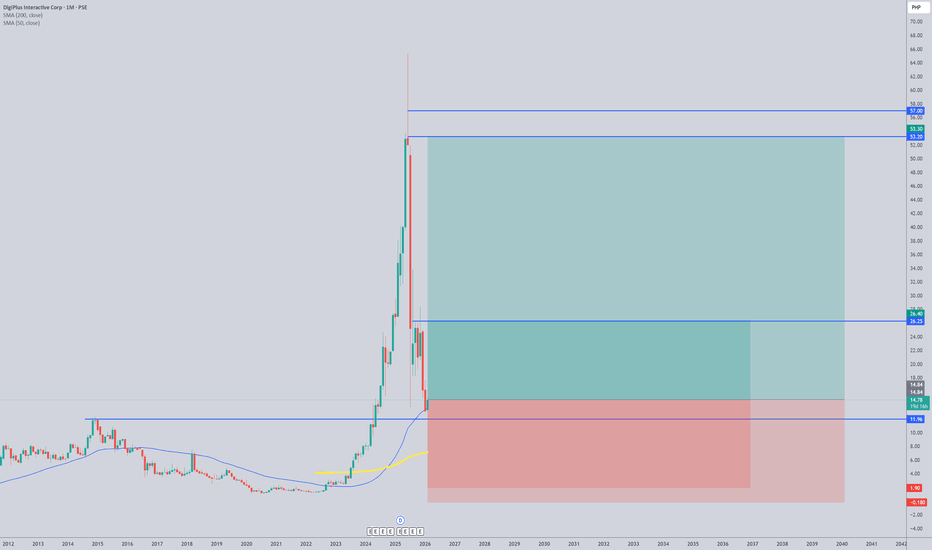
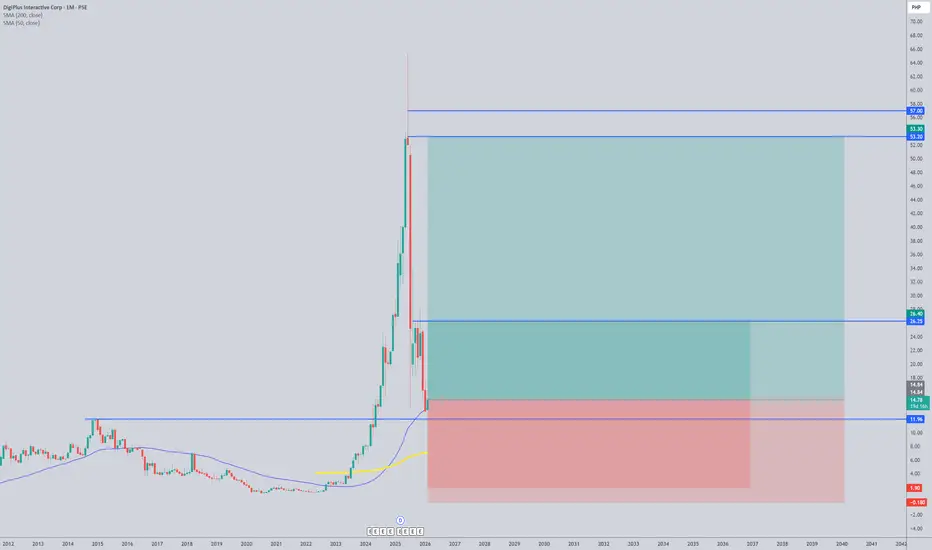
$PLUS Shows a Strong Uptrend: Long at $16.66!DigiPlus Interactive Corp ( PSE:PLUS ) is in a “Strong Uptrend” on a 1-week chart. 📈 We bought at $8.24 and sold at $10.35 previously. Now at $39.45, we’re in a long position at $16.66. With a Trend Score of 6/8 and 66.7% signal alignment, the short-term projected price is $44.2 (+19.1%) , but bearish MACD suggests caution. How to Trade This Setup: • Hold the Trend: The uptrend is strong with high volume—hold the long position from $16.66 for now. • Set Targets: Aim for Resistance 1 at $43.27; Support 1 at $26.51 is key if a pullback occurs. • Manage Risk: With bearish MACD, consider tightening stops or taking partial profits near $44.2. What’s your next move on PSE:PLUS ? Let’s discuss in the comments! 💡 #Trading #PLUS #Analysis
PSE:PLUSLong
by StockMarketInsights77
Buy and holdA good business may at times be priced wrong. And when it is, that's when you buy. Learn to put a value on things even if it's just book value over market price per share and when you see there is a discrepancy and a discount and when you believe something will continue to go up over time especially if the fundamentals are solid. Buy Buy and hold and wait. The boring but good of it.
PSE:SPCLong
by LittleSovi
Fib at buyI like how the fib is at fair price. Where fundamentals show so much increase in free cash flow this quarter. Company is growing smart and lessening their expenses. Excited for the dividends.
PSE:SPCLong
by LittleSovi
SMPH Possible Trend ReversalAfter months of downtrend, SMPH seems to be somehow recovering from its bearish sentiment. From downtrend to sideways Confluence Macro: Shift from downtrend to sideways Daily chart: higher lows RSI: higher lows Short term outlook: Looking like a 1 month short term uptrend. Other Notes Possibly looking to make a DB MB BO and hopefully a DB BT BO Coming from a macro downtrend, sentiment shifting to defensive stocks. Property sector may not be the first mover post bearish sentiment since its not a defensive sector but perhaps the speculated rate cuts may help. Earnings also released and looking good.
PSE:SMPHLong
by grailforce
$ALIPrice on support, looking for a bounce up, 41% upside at least.
PSE:ALILong
by dothaxxxx
33
At demand zone. Fundamentally sound. At the discount price. Best place to buy and hold. We all need electricity as it is the life blood of the nation.
PSE:SPCLong
by LittleSovi
1122334455667788991010
…999999

Made by humans

Select market data provided by ICE Data Services. Select reference data provided by FactSet. Copyright © 2026 FactSet Research Systems Inc.Copyright © 2026, American Bankers Association. CUSIP Database provided by FactSet Research Systems Inc. All rights reserved. SEC filings and other documents provided by Quartr.© 2026 TradingView, Inc.

More than a product
  • Supercharts
Screeners
  • Stocks
  • ETFs
  • Bonds
  • Crypto coins
  • CEX pairs
  • DEX pairs
  • Pine
Heatmaps
  • Stocks
  • ETFs
  • Crypto coins
Calendars
  • Economic
  • Earnings
  • Dividends
  • IPOs
More products
  • News Flow
  • Portfolios
  • Fundamental Graphs
  • Yield Curves
  • Options
  • Macro Maps
  • Pine Script®
Apps
  • Mobile
  • Desktop
Community
  • Social network
  • Wall of Love
  • Refer a friend
  • House Rules
  • Moderators
Ideas
  • Trading
  • Education
  • Editors' picks
Pine Script
  • Indicators & strategies
  • Wizards
  • Freelancers
  • Paid Spaces
Tools & subscriptions
  • Features
  • Pricing
  • Market data
  • Gift plans
Trading
  • Overview
  • Brokers
  • Brokers comparison
  • The Leap
Special offers
  • CME Group futures
  • Eurex futures
  • US stocks bundle
About company
  • Who we are
  • Space mission
  • Blog
  • Help Center
  • Careers
  • Media kit
Merch
  • TradingView store
  • Tarot cards for traders
  • The C63 TradeTime
Policies & security
  • Terms of Use
  • Disclaimer
  • Privacy Policy
  • Cookies Policy
  • Accessibility Statement
  • Security tips
  • Bug Bounty program
  • Status page
Business solutions
  • Widgets
  • Charting libraries
  • Lightweight Charts™
  • Advanced Charts
  • Trading Platform
Growth opportunities
  • Advertising
  • Brokerage integration
  • Partner program
  • Education program
Community
  • Social network
  • Wall of Love
  • Refer a friend
  • House Rules
  • Moderators
Ideas
  • Trading
  • Education
  • Editors' picks
Pine Script
  • Indicators & strategies
  • Wizards
  • Freelancers
  • Paid Spaces
Business solutions
  • Widgets
  • Charting libraries
  • Lightweight Charts™
  • Advanced Charts
  • Trading Platform
Growth opportunities
  • Advertising
  • Brokerage integration
  • Partner program
  • Education program
Look FirstLook First