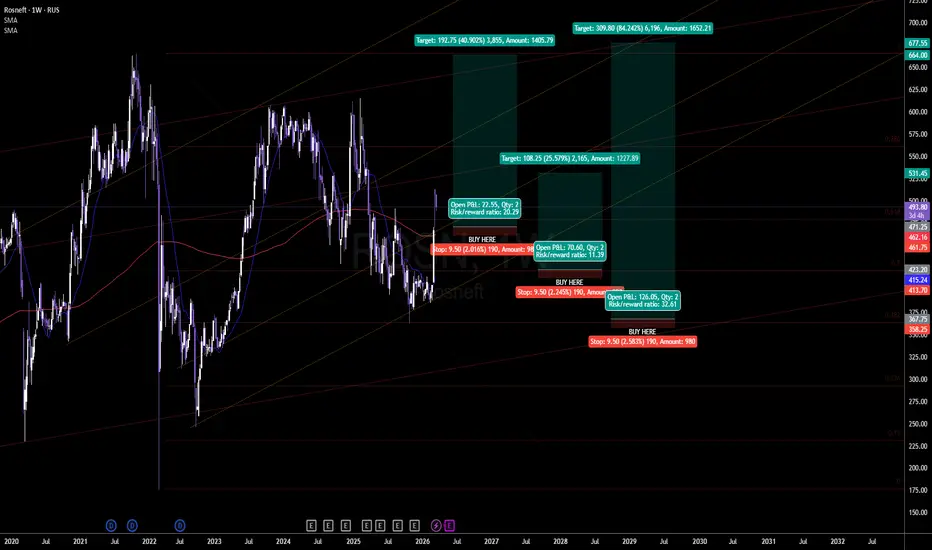
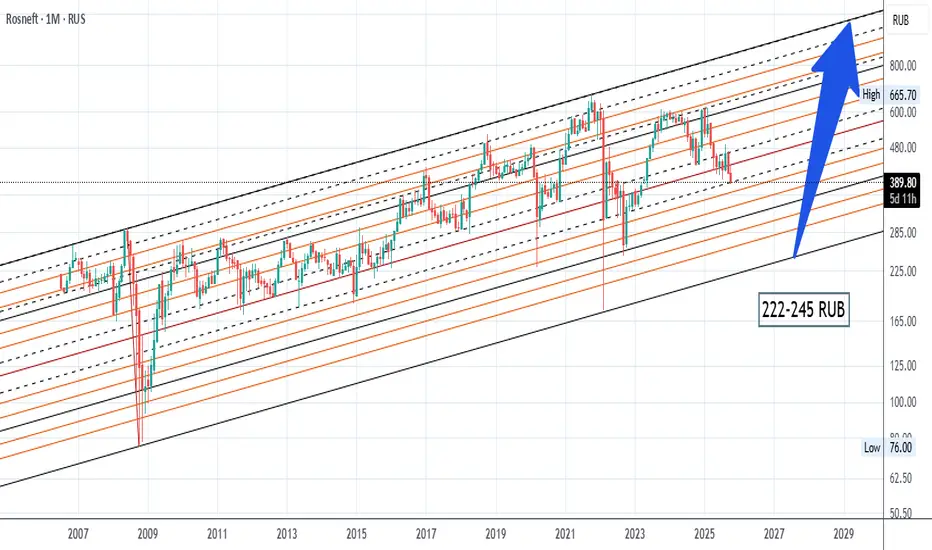
Rosneft Multi-Year Reversal Setup + Macro Channel Support!The weekly chart shows the full picture. After an extended corrective phase, price has retraced directly into a multi-year ascending channel support, aligning with key Fibonacci retracement zones and historical demand. This area has repeatedly acted as a base for expansion, and the current reaction suggests accumulation rather than continuation lower.
The structure is clean, with trendline confluence supporting a potential shift from bearish correction into bullish continuation. The move off this level shows early strength, with price attempting to reclaim momentum and build higher.
🟢 Buy Zone 1 (423 area)
0.618 Fibonacci retracement aligned with channel support and prior structure.
Stop: 9.50 below entry (2.01%) / 980 position
Qty: 2
Risk/Reward Ratio: 20.29
Target: +40.90% (664 area / 1,405.79)
🟢 Buy Zone 2 (462 area)
0.5 Fibonacci retracement with deeper channel support and stronger demand.
Stop: 9.50 below entry (2.24%) / 980 position
Qty: 2
Risk/Reward Ratio: 11.39
Target 1: +25.57% (531 area / 1,227.89)
🟢 Buy Zone 3 (367 area)
0.382 Fibonacci retracement approaching lower trendline support and final demand zone.
Stop: 9.50 below entry (2.58%)
Qty: 2
Risk/Reward Ratio: 32.61
Target 1: +25.57% (531 area / 1,227.89)
Key Levels:
🔑 Current Price: 493
🔑 Buy Zone 1: ~423
🔑 Buy Zone 2: ~462
🔑 Buy Zone 3: ~367
🔑 Channel Resistance: ~677
🔑 Major Resistance: ~700
🎯 Target 1: 531 (+25%)
🎯 Target 2: 664–677 (+40% to +84%)
⚠️ Hard Stop All Zones: 9.50 below entry
The bear case is clear. Continued downside in oil prices could weaken the entire sector. Geopolitical risks surrounding Russia remain elevated, and sanctions or policy shifts could impact long-term valuation. A breakdown below the channel would invalidate the structure entirely.
The bull case is equally strong. Energy demand remains persistent, and supply-side constraints continue to support higher pricing environments. The technical structure shows strong historical respect for this channel, and each prior touch has resulted in significant upside expansion.
This is not a short-term trade. It is a macro structure play based on multi-year support, trendline integrity, and high time frame confluence. The opportunity lies in positioning at key demand while maintaining tight, controlled risk against a large potential upside move.  Long
Long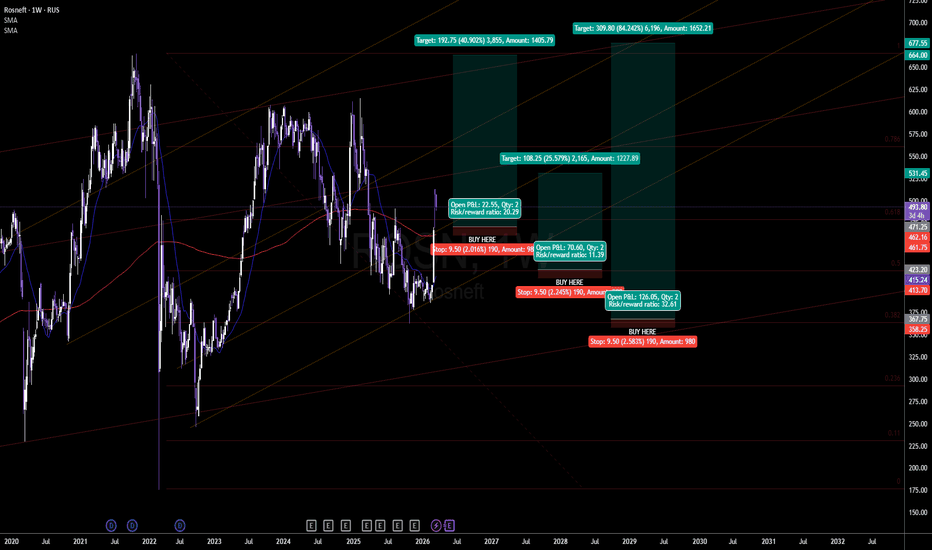
 Long
Long
 Long
Long
$LUKOIL The Sanctioned Oil Giant Nobody Can Ignore!This is the most contrarian trade on this entire watchlist and potentially the most explosive. Lukoil is trading at 5,385 on the weekly chart, sitting near multi-year lows while oil prices are surging globally. This disconnect is the trade.
Here is why the Iran war changes everything for Lukoil specifically:
The Strait of Hormuz is effectively closed. Middle East oil flows are disrupted. And the world's two biggest oil buyers India and China are suddenly scrambling to find alternative supply.
With Middle East barrels facing logistical disruption, both India and China face strong incentives to deepen reliance on Russian supply. That supply goes through Lukoil.
Russia's oil revenues, which had hit a four-year low in January, are about to explode higher. Russian crude is now trading above the $59 per barrel benchmark assumed in Russia's federal budget plan for 2026 meaning every dollar above that goes straight into Russian oil company profits. Oil and gas tax revenues account for up to 30% of the Russian federal budget, and the government needs Lukoil producing and profitable.
Here is the wild card catalyst almost nobody is talking about: The US Treasury's OFAC just extended the deadline for potential deals involving Lukoil's international assets to April 1, 2026, pausing asset sales to use them as leverage in Russia-Ukraine peace talks. Chevron is reportedly in exclusive talks to take over Lukoil's stake in Iraq's giant West Qurna 2 oilfield. Any peace deal or asset transaction of that scale reprices this stock immediately and violently to the upside.
This is a weekly chart with two tiered buy zones targeting a move into 2026 and 2027.
🟢 Buy Zone 1 Current Level (5,385 area)
Price is testing a major long-term support zone with the weekly candles showing capitulation wicks. This is the aggressive entry for those who see the macro thesis clearly.
Stop: 197.5 below entry (4.451%) / $450,000 position
Qty: 253
Risk/Reward Ratio: 7.95
Target 1: +35.392% (6,955 area / Amount: $897,594)
Target 2: +118.466% (8,831 area / Amount: $1,353,654)
🟢 Buy Zone 2 Deep Demand (4,240 area)
The ultimate patient entry near the 4,240 level. If geopolitical uncertainty keeps pressure on the stock short term before the macro thesis plays out, this deep zone offers an extraordinary R/R.
Stop: 280.5 below entry (6.939%) / $450,000 position
Qty: 178
Risk/Reward Ratio: 17.07
Target 1: +35.392% (6,955 area)
Target 2: +118.466% (8,831 area / Amount: $1,353,654)
Key Levels:
🔑 Current Price: 5,385
🔑 52-Week High: 8,175
🔑 52-Week Low: 3,482
🎯 Target 1: 6,955 (+35%)
🎯 Target 2: 8,831 (+118%)
🎯 Full Extension Amount: $1,353,654
⚠️ Hard Stop Zone 1: 197.5 below entry
⚠️ Hard Stop Zone 2: 280.5 below entry
The world is trying to cut Russia off. But when Hormuz shuts and Middle East oil disappears, India and China don't have a choice. Russian oil becomes indispensable overnight and Lukoil is the company sitting on top of that supply at multi-year lows.
High risk. High reward. Define your position size and let the energy crisis do the work.  Long
Long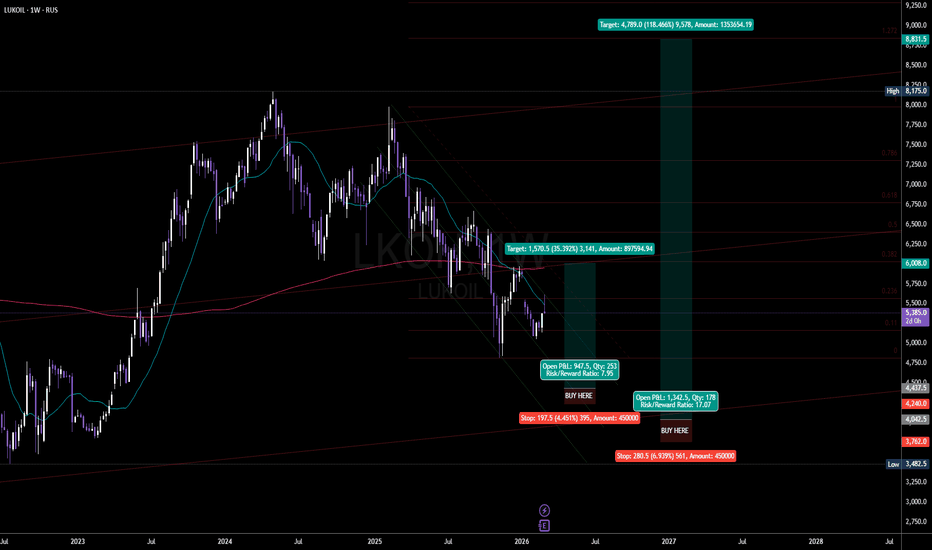
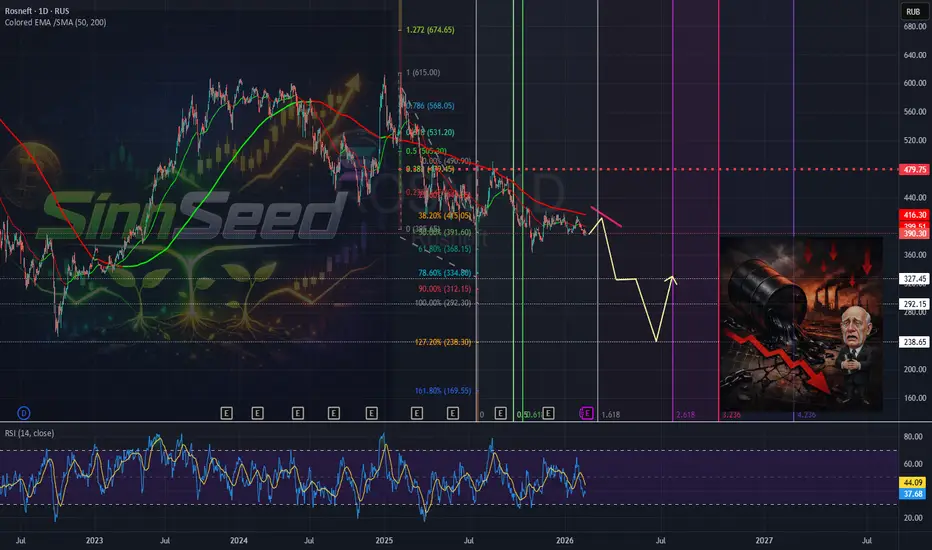
SinnSeed | ROSNEFT (ROSN) | Overview - 15.02.2026🛢 #SinnSeed | ROSNEFT (ROSN) | Overview: News, Financials, Forecast 🔗
🖥 Latest Developments & Impact on Stock Price
⚠️ Sanctions & Exports . In October 2025, the US included #Rosneft (along with #Lukoil ) in a new sanctions package. The consequences are already being felt:
🔴 Exports plunged ~32% by December 2025 — the Urals discount widened to 25 USD/bbl 🔴 Oil volumes stuck on tankers at sea — shares dropped 3.8–5.6% depending on the exchange 🔴 India's imports of Russian oil fell to the lowest since 2022 — ~1.1M bbl/day in January 2026
⚠️ The PCK Schwedt Problem. The German refinery, held under trust management, remains a point of tension. Sanctions threaten fuel supplies to Berlin. Rosneft has officially warned of the risks — deadline April 29, 2026.
💥 Incidents & Production. A series of #drone attacks in November–December 2025 damaged oil depots and #refineries . The result — a loss of 350K bbl/day in January 2026. No major new contracts. The company is pivoting to the domestic market and counting on tax incentives of ~10B RUB/year for 2026–2030.
📉 Combined effect: shares have lost 12–15% since October 2025. Financial crisis. H1 2025 profit collapsed by 68%. #CEO Sechin publicly blames Western restrictions. 🤥
📊 Financial Analysis | 9M 2025 (IFRS)
🔻 Revenue → 6,288B RUB (−17.8% YoY) 🔻 EBITDA → 1,641B RUB (−29.3% YoY) 🔻 Net Income → 277B RUB (−70.1% YoY) ▪️ Free Cash Flow → 591B RUB 🔻 Net Debt / EBITDA → 1.3x ▪️ Total Debt → ~36B USD
Quarterly Profit Dynamics: Q1 → 170B ▸ Q2 → 74B ▸ Q3 → 32B RUB The trend is clear — an accelerating decline. 🔽
Key Pressure Drivers:
🔻 Low oil prices + market surplus (~2.6M bbl/day) 🔻 Ruble appreciation eating into RUB-denominated revenue (thanks to the NWF and the fiscal rule) 🔻 High CBR key rate → debt servicing costs +2.5–3.8B USD 🔻 Declining gas production (−13.1%) and refining (−7.8%)
🔮 Forecast Through August 2026
The base case assumes continued sanctions pressure and a market surplus of ~2.4M bbl/day in 2026.
Выручка: −10–15% YoY → ~8T RUB/year, assuming Urals doesn't hold above 50 USD Net Income: stabilization or −20% → ~300–350B RUB/year
🔸 Upside support — tax incentives and the Vostok Oil project (launch in 2026, target capacity up to 2M bbl/day by 2030)
Debt load: Net Debt / EBITDA → 1.5–1.7x, with risk of increased borrowings
Stock: — if oil > 60 USD → rebound potential +5–10% — if oil < 60 USD → further decline likely −5–10%
Technical Picture 👨💻
📉 A correction to the 38.2% level indicates a strong downtrend.
By 20.03.2026, I expect a drop to 325 RUB. Followed by a continuation to 290 RUB. A potential impulse move toward the 260–240 RUB zone is possible, after which a local reversal could be considered.
No buying before 260 RUB .
What do you think about the forecast? Share in the comments. Short 
 Long
Long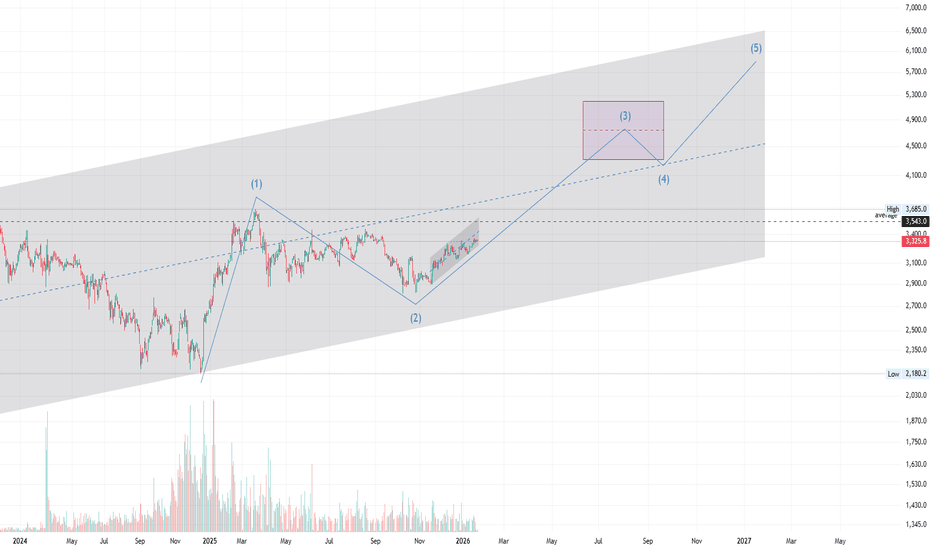
 Long
Long
 Short
Short
Short 
 Long
Long
 Long
Long
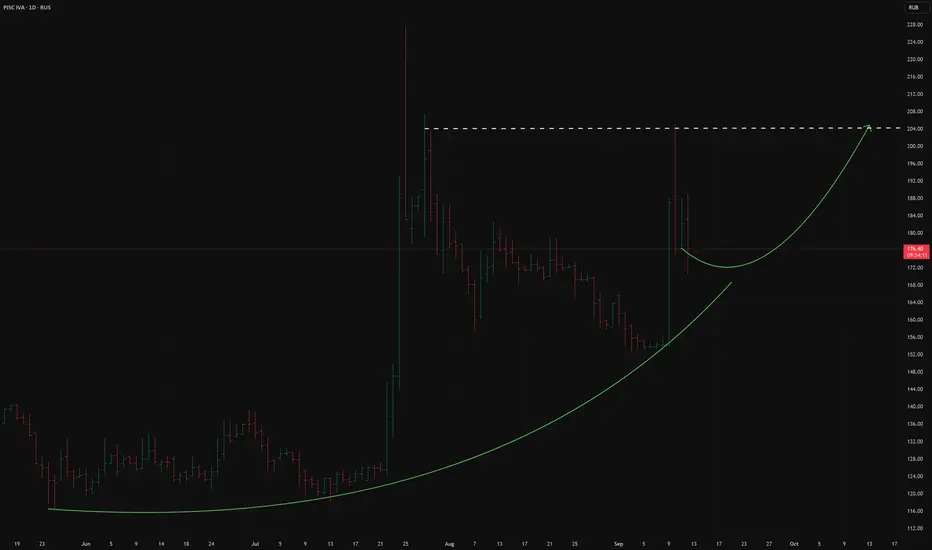
IVAT RU ( IVA Technologies) Long#Invest #Russia #IVAT
IVA Technologies offers a wide range of products united in a single ecosystem:
IVA Connect: Corporate messenger for fast communication between teams.
IVA MCU: Video conferencing platform, which is the leader among Russian solutions for the corporate sector
VKurse: Cloud platform for video conferencing.
IVA GPT: AI assistant for business, providing automation of tasks and analytics.
IVA CS: Corporate telephony server.
IVA Room and IVA Largo: Video terminals for negotiations.
VA SBC: Session Controller for Secure Communications
Other Products: IP Phones, Management and Monitoring Systems
IVA Technologies is the leader in the Russian video conferencing market with a 33% share in the corporate segment
The company plans to increase its market share to 91% in 2028
In July 2025, IVA Technologies announced a partnership with the Physicotechnical Institute, which acquired a minority stake (about 1%) from existing shareholders
The news caused a stir in the market, and the shares rose by 75% in four days
IVA Technologies actively invests in the development of new products and technologies. In the first half of 2025, capital expenditures (CAPEX) increased by 75% to 973 million rubles
The company created an artificial intelligence laboratory that focuses on the development of video analytics systems, business process automation and AI tools for developers
Partnership with the Physics and Technology Institute can help IVA Technologies enter international markets
The fund has the resources and expertise to support international expansion
Although revenue for the first half of 2025 remained at the same level as last year (1.07 billion rubles), EBITDA increased by 11% to 2.3 billion rubles, and cash flow from operating activities increased by more than 3.5 times
The company has a small debt
net debt/EBITDA 0.2
The downside is low NAV with high capitalization, i.e. high P/B.
The market believes in the success of the company, its further expansion and growth of financial indicators  Long
Long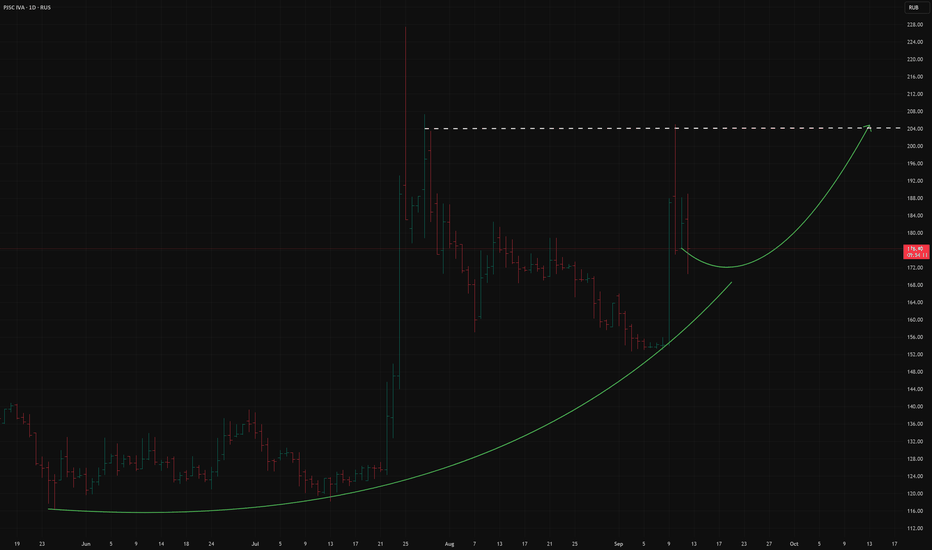
 Long
Long
Long 
 Long
Long
 Long
Long
 Long
Long
Long 
 Long
Long
Long