TradingView IPO Calendar: master upcoming offerings
The IPO Calendar is a financial tool that lets you track private companies going public. Every month, numerous businesses begin offering their stock to a broader audience through an Initial Public Offering (IPO). This calendar helps you identify the most promising new listings so you can capture early market momentum.
CONTENTS:
What is IPO
An Initial Public Offering (IPO) is the process of a private company selling its shares to the public to raise capital for production, development, expansion, and other strategic activities. An IPO is a crucial milestone in a company's lifecycle — it can either rapidly propel the business forward or expose it to significant public market challenges.
Publicly traded companies are often highly capitalized, with valuations that can exceed the GDP of some countries. This is because going public allows a massive audience to invest, ranging from retail traders buying a few shares to institutional funds managing billions of dollars. Because the stakes are so high, executive management teams carefully aim to go public at the perfect macroeconomic moment.
Before an IPO, a company must prepare all necessary legal filings and meet strict financial requirements, such as maintaining a healthy debt-to-equity ratio and demonstrating a well-managed, profitable business model with a leading position in its niche.
Once public, the company faces rigorous ongoing regulations. It must comply with criteria set by the SEC and other regulatory authorities, and its internal financial statements become publicly accessible — allowing you to examine them directly on TradingView.
What is the IPO Calendar
As part of the TradingView Calendars suite, the IPO Calendar helps you plan your trades and long-term investments. It allows you to view a schedule of upcoming public offerings, monitor the performance of previous IPOs, and access detailed information and corporate statements for each listing.
How to access the IPO Calendar
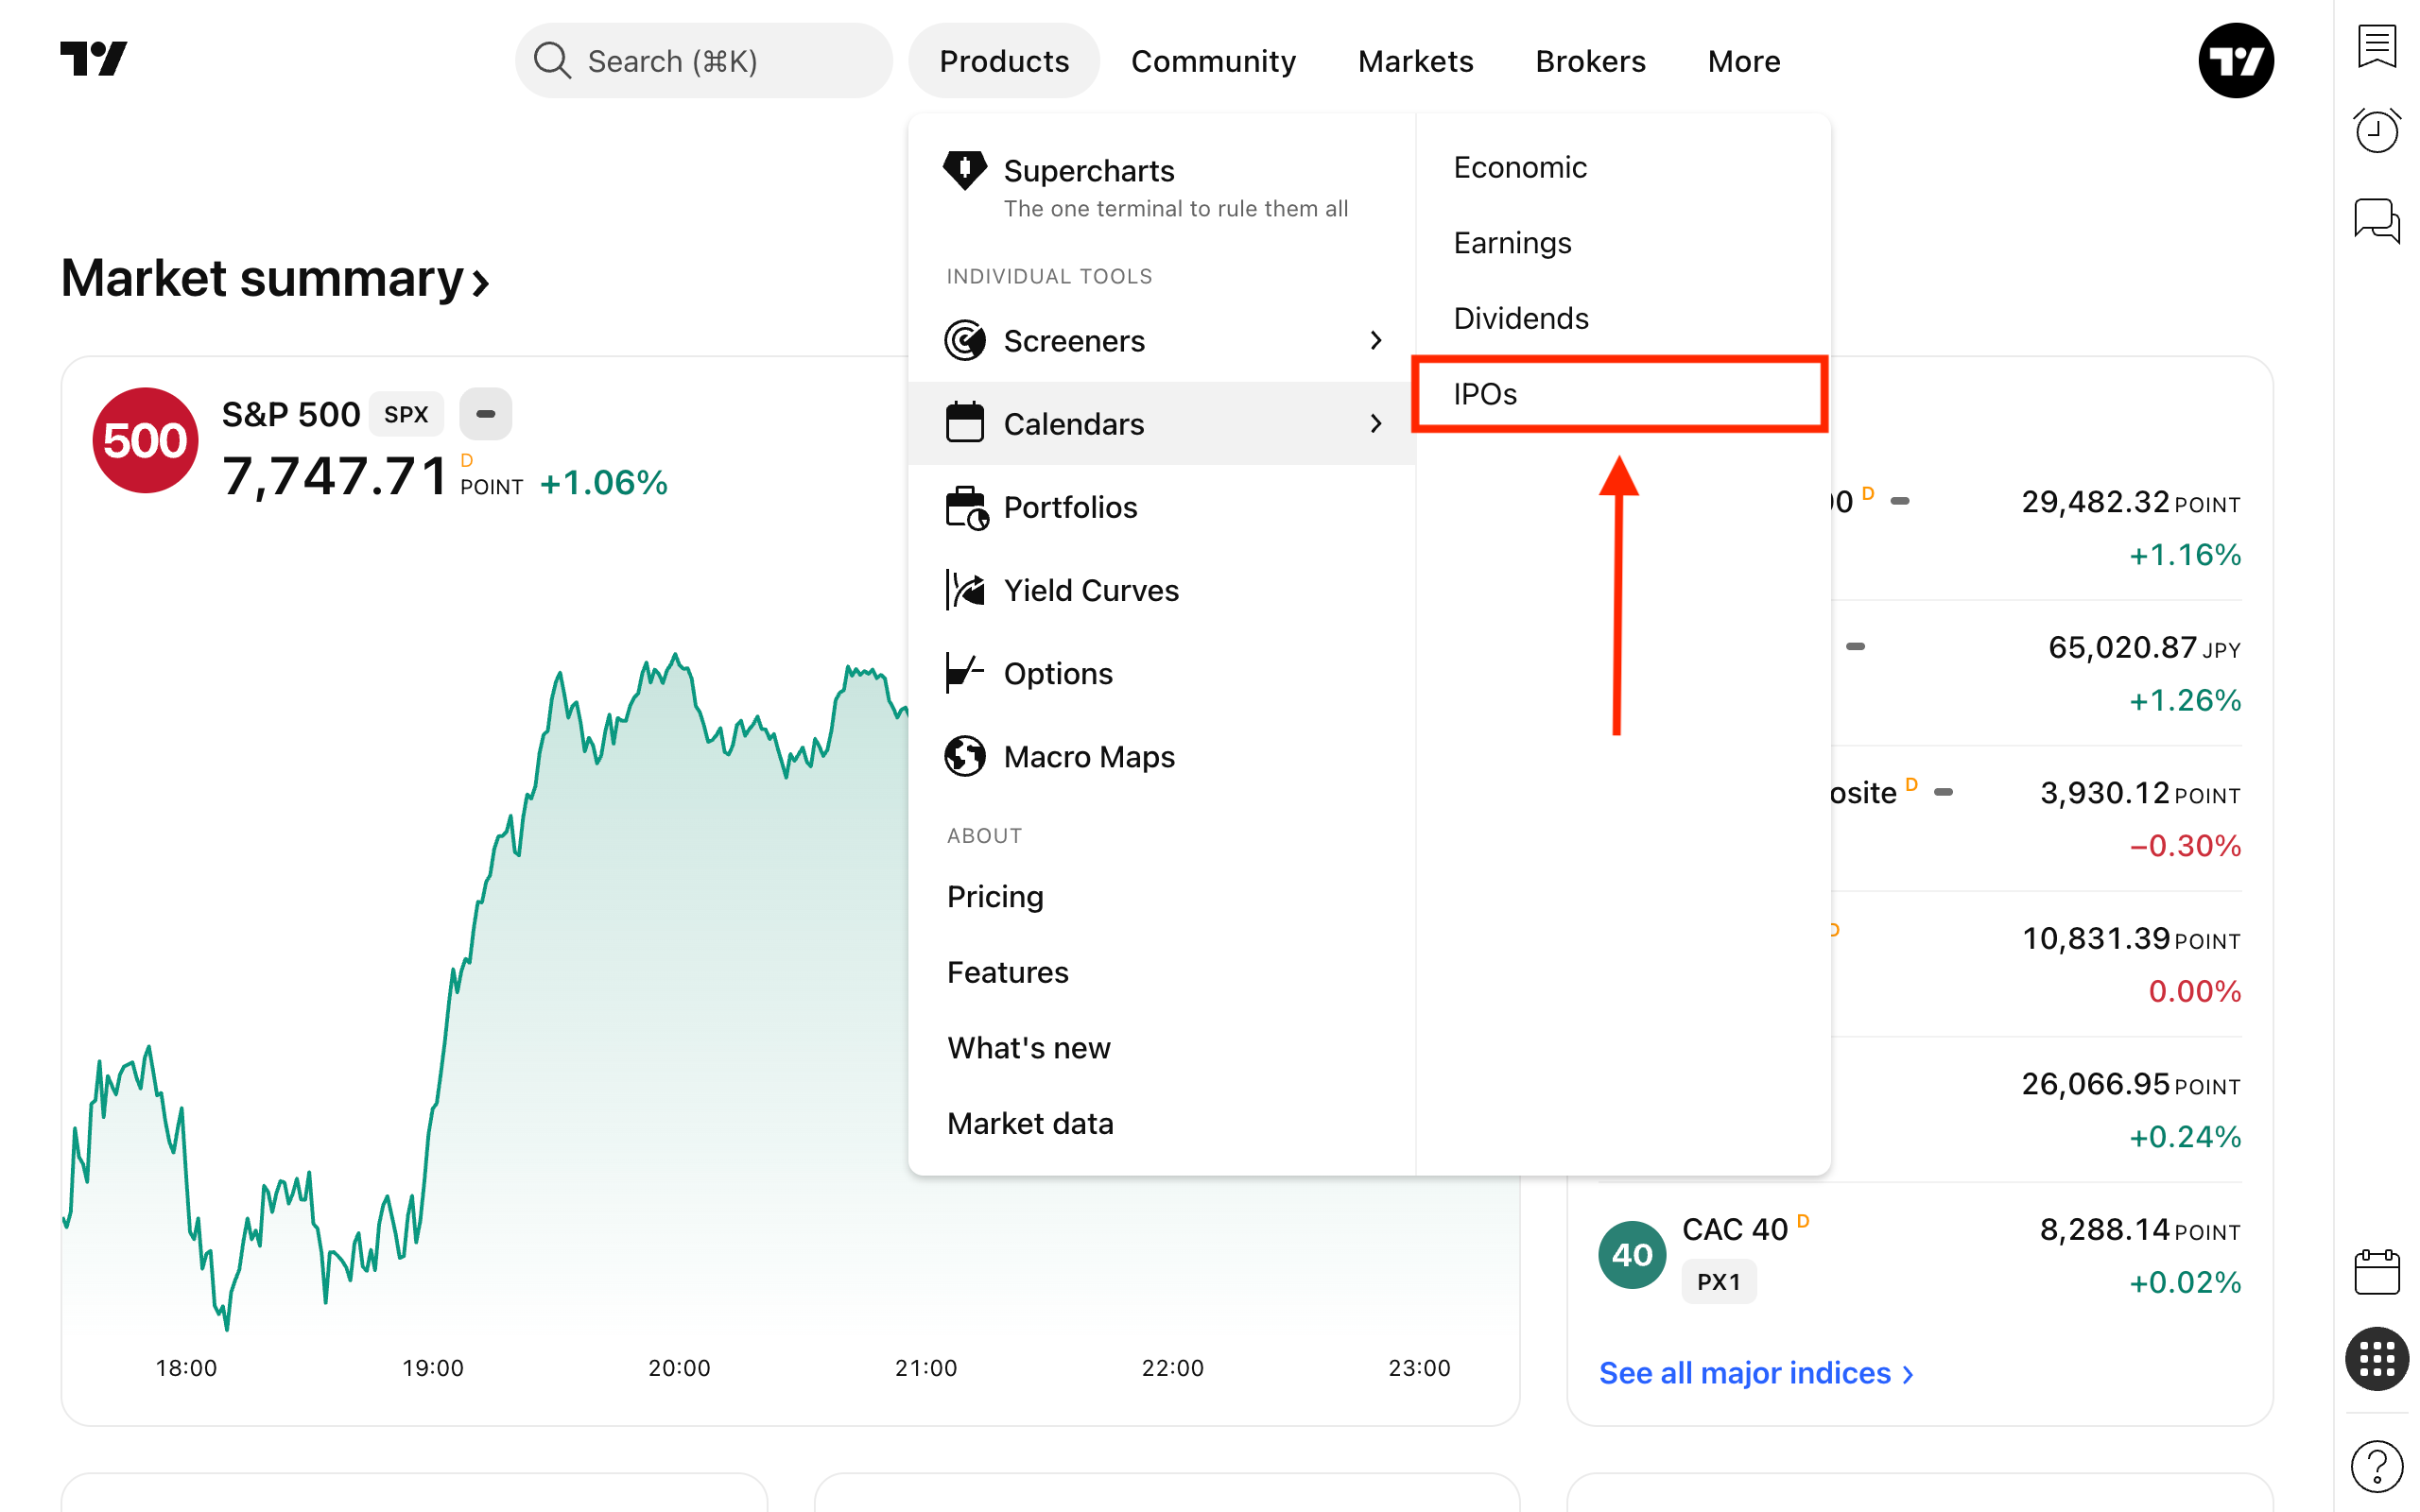
From the main page, open the Products dropdown menu, hover over Calendars, and select IPO.
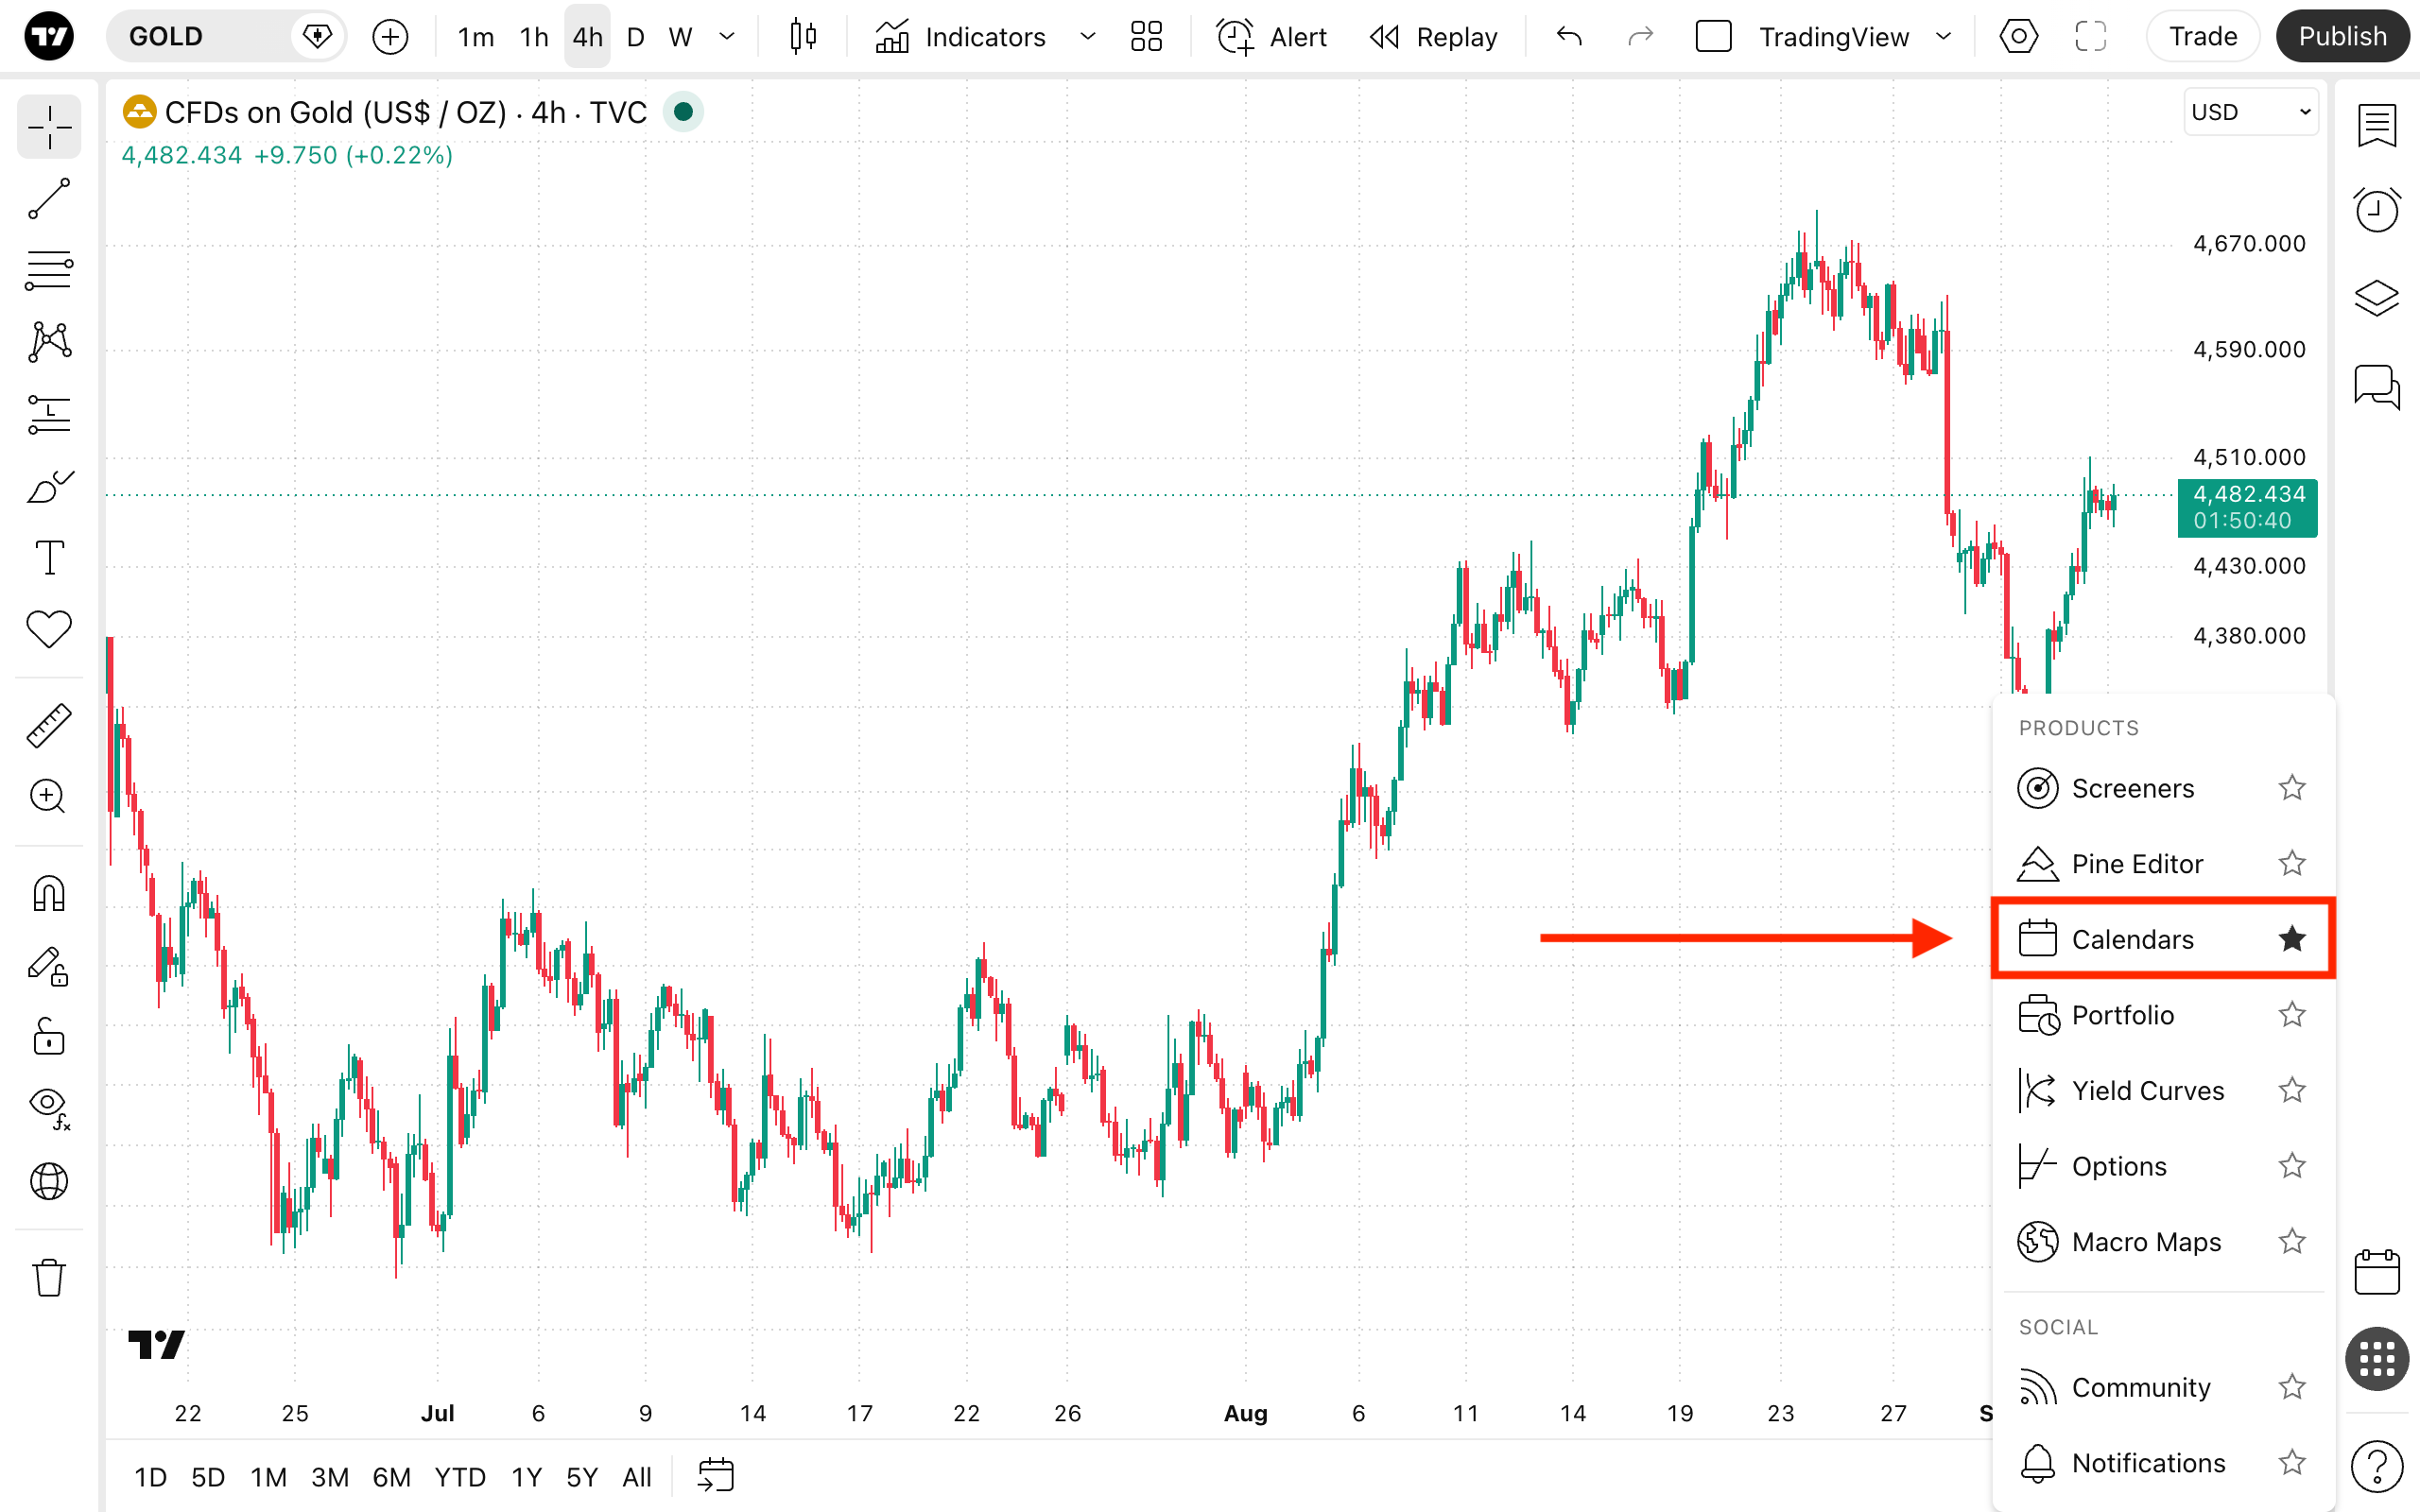
Alternatively, you can use the Overlay Sheet available on any TradingView page, even while you are actively charting. Just click the Products menu on the right-hand toolbar and select Calendars.
 How to read the IPO Calendar
The interface is intuitive and functions similarly to other TradingView calendars. Key IPO statistics include:
- Date: The day the IPO officially takes place. You can scroll to view both past and upcoming offerings.
- Exchange: The marketplace where trading begins (e.g., NYSE, Nasdaq). The choice of exchange can influence the number of shares outstanding, shareholder requirements, and other listing factors.
- Offer price: The initial price at which the company sells its shares to the public.
- Shares offered: The total number of new shares the company is selling.
- Deal amount: The total capital raised (Offer price × Shares offered).
- Market cap: The company's total valuation immediately post-IPO (Offer price × Total shares outstanding, which includes existing shareholder stakes).
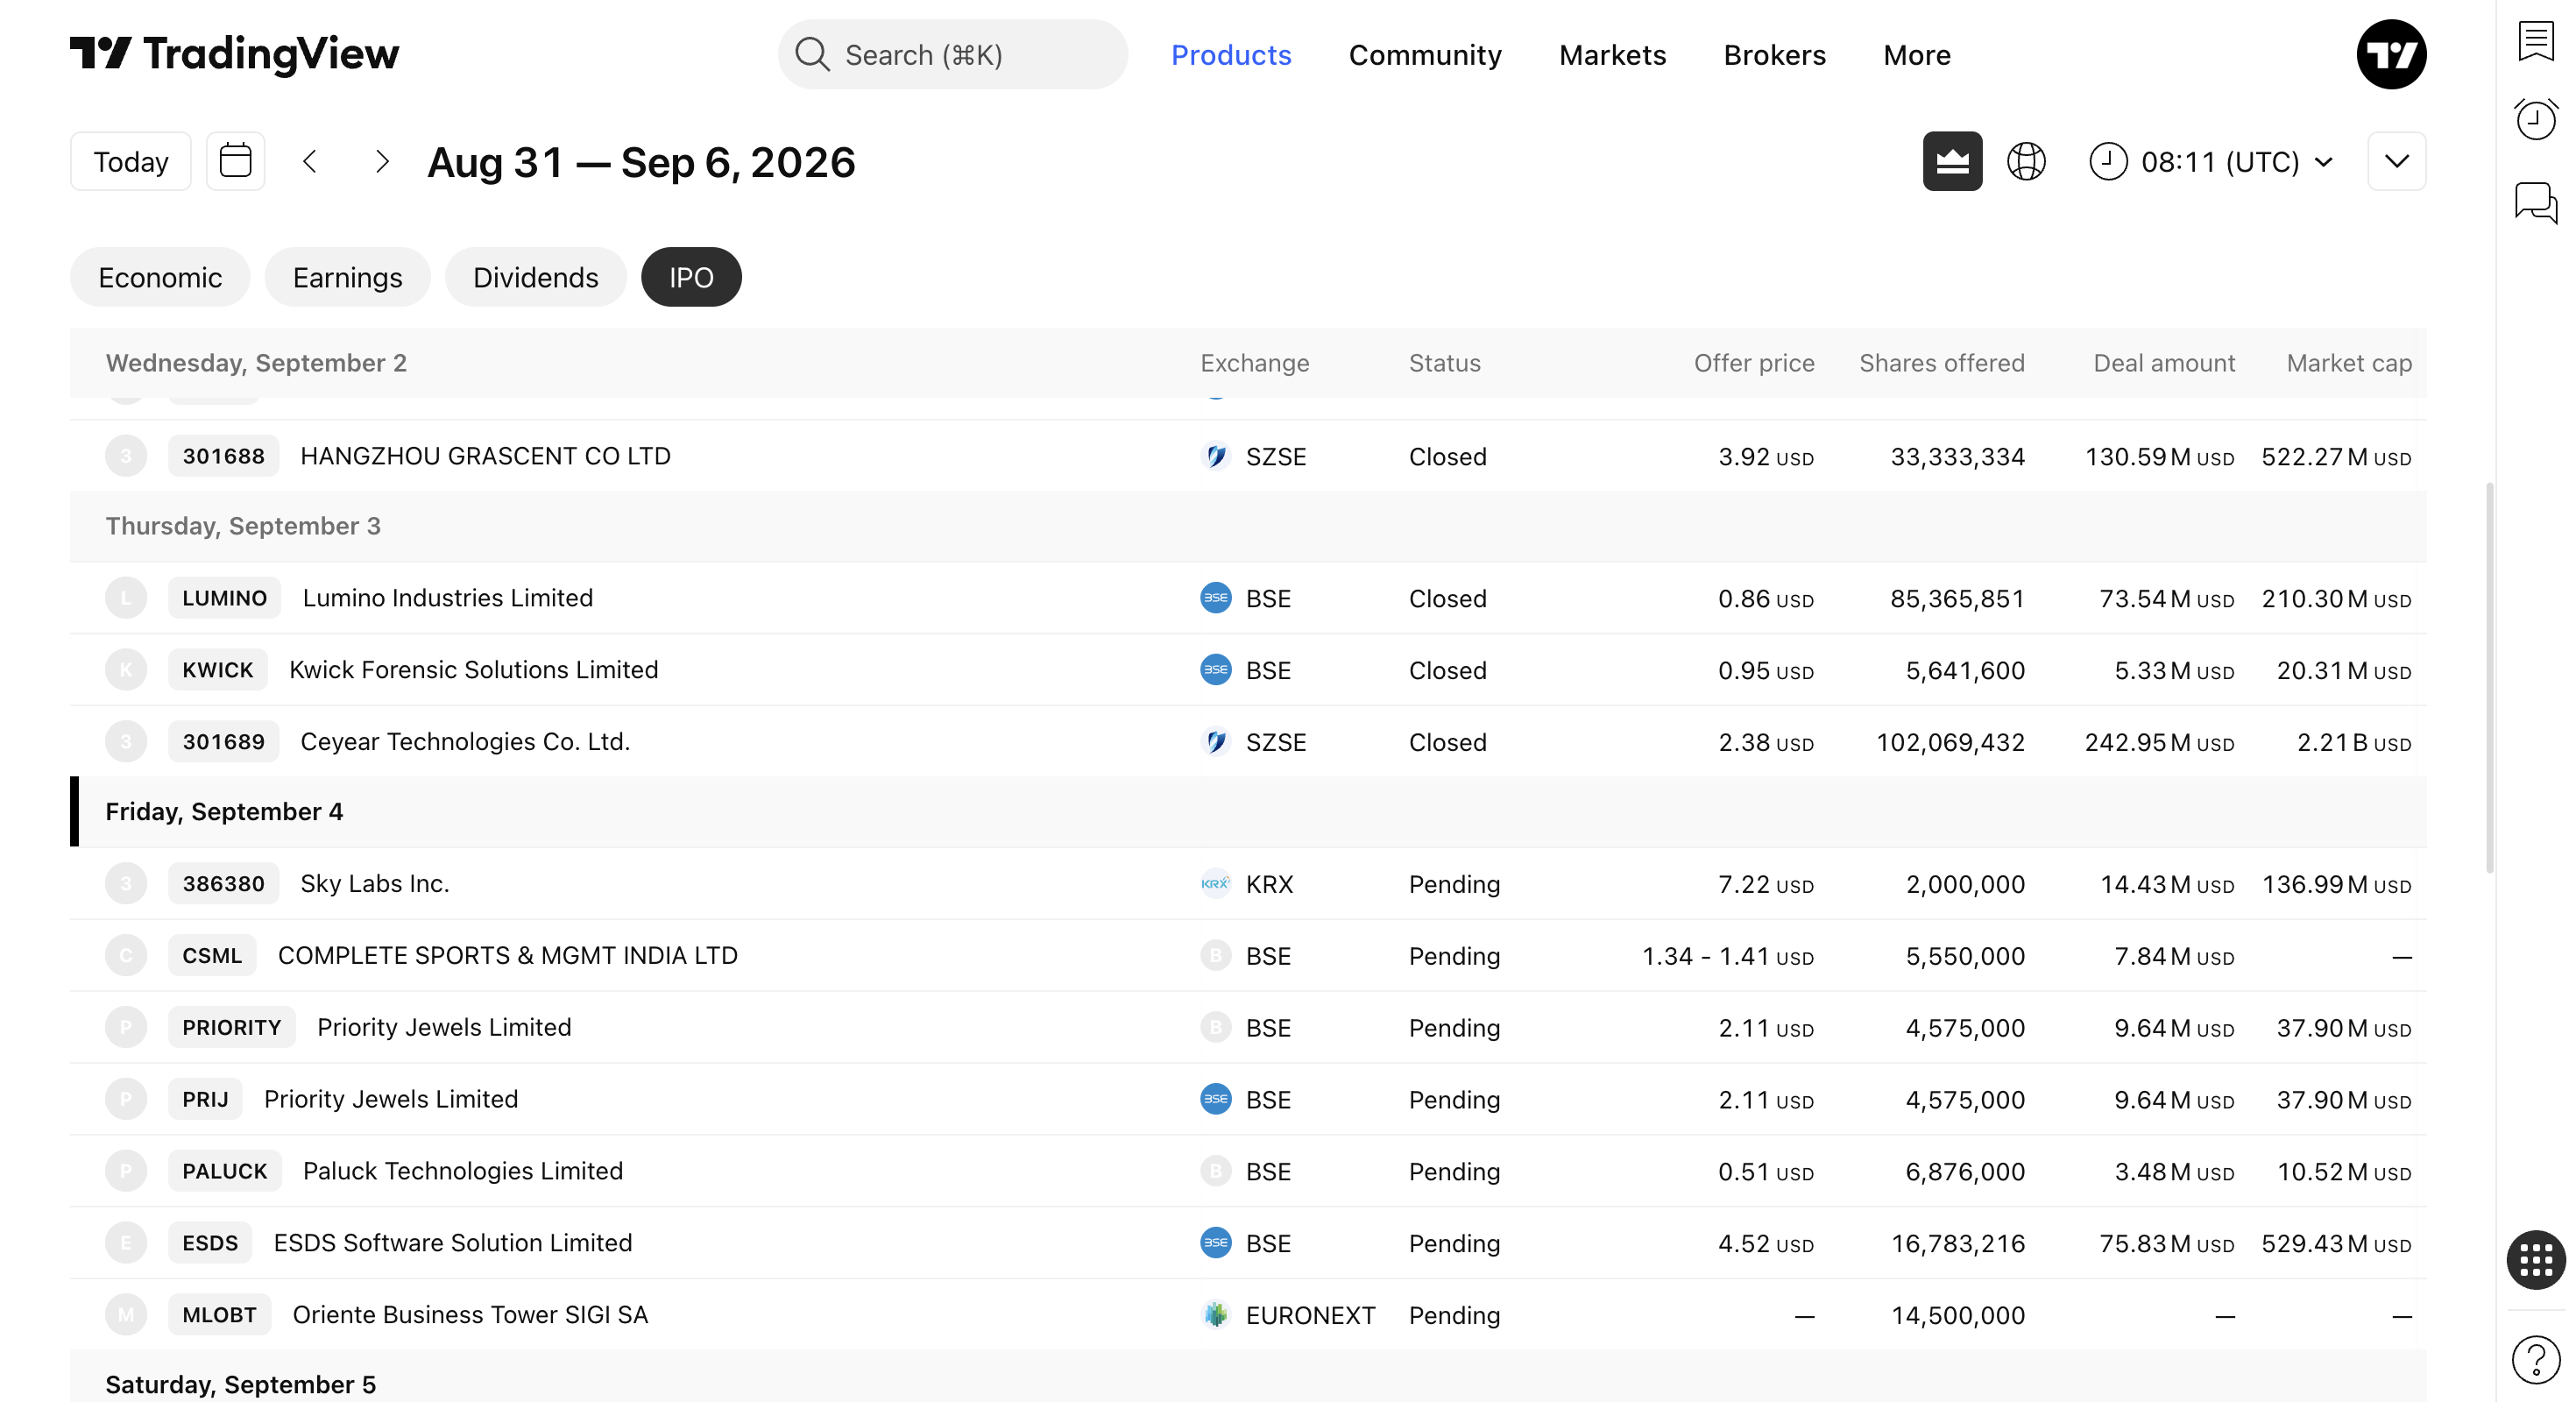
These statistics indicate the financial position a company aims to establish right out of the gate. Comparing the offer price, initial trading price, and market capitalization can help you gauge broader market expectations and management's specific objectives.
However, remember that market cap and initial stock price alone do not guarantee future growth — they often reflect short-term market sentiment rather than long-term fundamentals. To assess an IPO's true prospects reliably, you must also dive into the company’s financials, business model, and competitive environment.
Oh, and one more scheduled thing…
Careful planning and preparation are the cornerstones of successful trading and investing, and long-term sustainability always requires diversification. While newly listed IPO stocks offer high potential gains, they are notoriously volatile and carry significant risk. To balance your portfolio, it is wise to complement high-growth equities with safer investment alternatives, like bonds. We highly recommend exploring our Yield Curves tool to identify government-issued securities that can help you reduce overall portfolio risk while safeguarding your capital.
Also read: