Mini Ibovespa Futures ($WIN1!) Daily: Bullish Rebound Testing 72Mini Ibovespa Futures ( BMFBOVESPA:WIN1! ) Daily: Bullish Rebound Testing 72-SMA Barrier Toward $185,820 and $190,140 Fibonacci Targets
### 🇧🇷 Bovespa Index-Mini Futures ( BMFBOVESPA:WIN1! ) Daily Technical Structure (Ref: WIN1!_2026-07-23_09-46-23.png)
We are deploying a daily (1D) structural framework for the Mini Ibovespa Futures ( BMFBOVESPA:WIN1! ). Following a strong reaction off the institutional baseline floor, the index is attempting a trend recovery, breaking above local descending r
In-depth trading ideas
Mini índice BOVESPA quer voltar para os 130,000 para cair forteMini BOVESPA index seems to want to return to the region of 130,000 points on the daily chart despite strong sell signals on the weekly, indicating a possible pullback for an even stronger fall towards 112,560 points where the point of control has been located since 2005.
In this region of the point of control there will be a reaction possibly up to the region of 120,000 points again and then moving towards the final target between 92,000 and 90,000 points.
My Analisys Under the Wave Princilpe at Bovespa Mini Futures
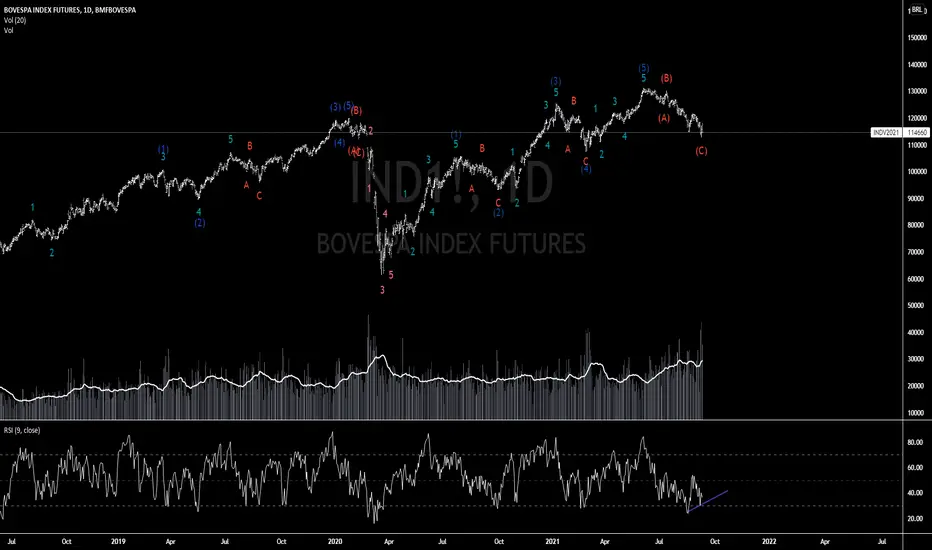
Summary on the Elliott Wave Principle Theory Applied to the Ibovespa Index
The Elliott Wave Principle is a form of technical analysis used to predict financial market trends by identifying repetitive patterns in market prices, known as "waves." Developed by Ralph Nelson Elliott in the 1930s, this theory is based on the belief that market prices move in predictable cycles or waves driven by investor psychology and crowd behavior.
In the context of the Ibovespa Index, the Elliott Wave Theory can
Divergence Unveiled: Ibovespa & S&P500“Emerging markets conclude 2023 on better note than developed markets” – S&P Global Market Intelligence.
How much of this has been reflected in the respective market indices?
Figure 1: Ibovespa and E-mini S&P500 Index Futures
Figure 1 presents a retrospective view of the Ibovespa Index Futures (IND1!) and E-mini S&P500 Index Futures (ES1!) since the onset of the pandemic. While the indices initially traded in tandem, a noticeable deviation emerged since the middle of 2021. The IND Future
Long Ibovespa indexAfter this week's candle, the market has refused to go lower and the bulls answered by buying with high volume and high momentum, closing its candle above the previous higher. The 10 EMA is likely to reverse its doen pattern to up indicating a very strong signal to buyers with a risk reward ratio of 1:2.