BTCFDUSD | Elliott Wave Analysis 📅 July 27, 2026 | 🕖 7:22 PM WIB (UTC+7)
Wave (a) appears to be complete, and I am currently expecting the market to develop Wave (b) within the ongoing ABC corrective structure.
My primary downside target for Wave (b) is the 0.618–0.764 Fibonacci retracement zone, located between:
📍 $61,420 – $60
Compare with Bitcoin / FDUSD
Mastering:How to Predict the Perfect Entry Point in Crypto?Analyzing BTC/USD in multiple time frames:
22-day time frame, weekly time frame, daily time frame, and 4-hour time frame.
Key Trend Observed:
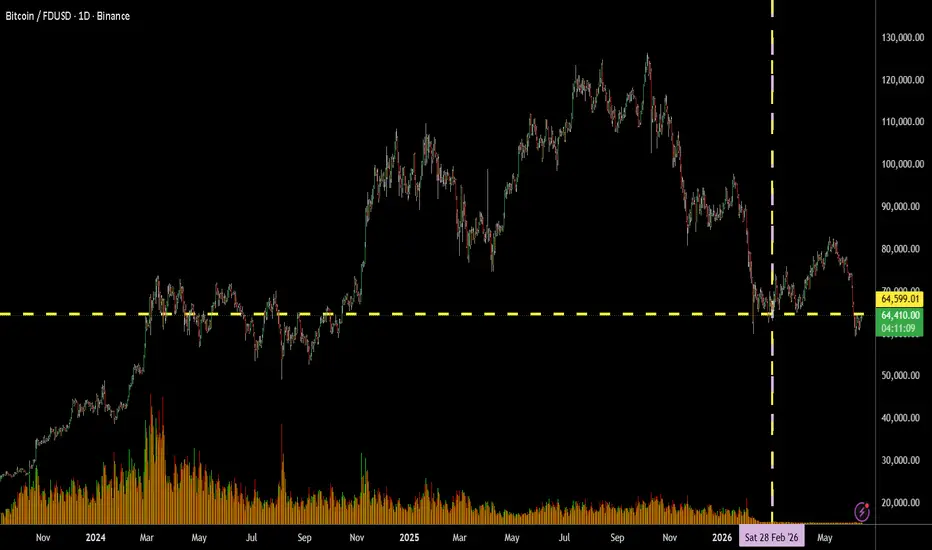
In the period from May to September 2024, BTC/USD traded in the range of 70,000 to 64,000. After February 28, 2026, the price initially surged to 85,000
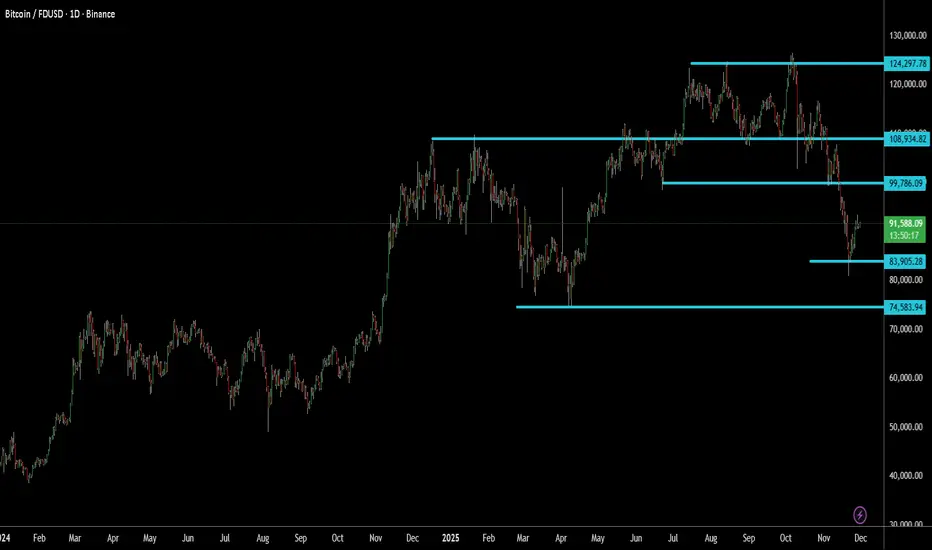
BTCFDUSD:Support and Resistance Levels Indicate Potential Move
Title:
BTCFDUSD: Key Support and Resistance Levels Indicate Potential Moves
Greetings, Traders!
🌟 Hello everyone,
As we analyze BTCFDUSD, we observe critical support and resistance levels that could shape the upcoming price action. Understanding these levels can help traders navigate the mar
Psychological Trap That Costs You More Than Just Money — KnowHow🎯 Psychological Trap That Costs You More Than Just Money — Know the "Profit Illusion Trap"
“The biggest cost in trading is not just losing money; it’s losing control of your mind.”
Let’s break down a common yet dangerous psychological trap that derails even experienced traders—“Profit Illusion T
BTCFDUSD appears downtrend📊 Analyzing **FDUSD** across multiple timeframes:
**22-day time frame**, **Weekly time frame**, **Daily time frame**, and **4-hour time frame**.
📉 FDUSD appears to be in a downtrend and showing signs of further decline.
If the key support level fails to hold, we may see an extended drop
BTC Crypto 4h chart looks falling -long later📊 Looking at the analysis of **BTCFDUSD** across multiple time frames:
**22-day time frame**, **Weekly time frame**, **Daily time frame**, and **4-hour time frame**.
🚀 BTCFDUSD is currently at **$104,688** and is expected to pull back before resuming an upward move.
A better entry point
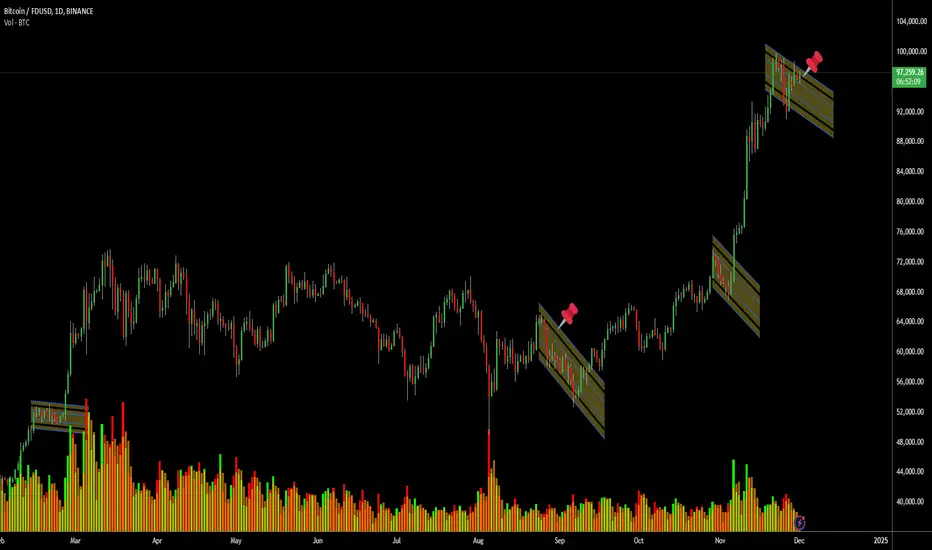
BTCUSD Channel Formation - Targeting $69,000 to $72,000 in Two W📈 📈
In this setup, BTCUSD is showing strong momentum within a defined upward channel, aiming to reach the $69,000 to $72,000 range within the next two weeks. Given recent price action and underlying support, Bitcoin appears ready for a solid breakout within this range, providing an attractive risk
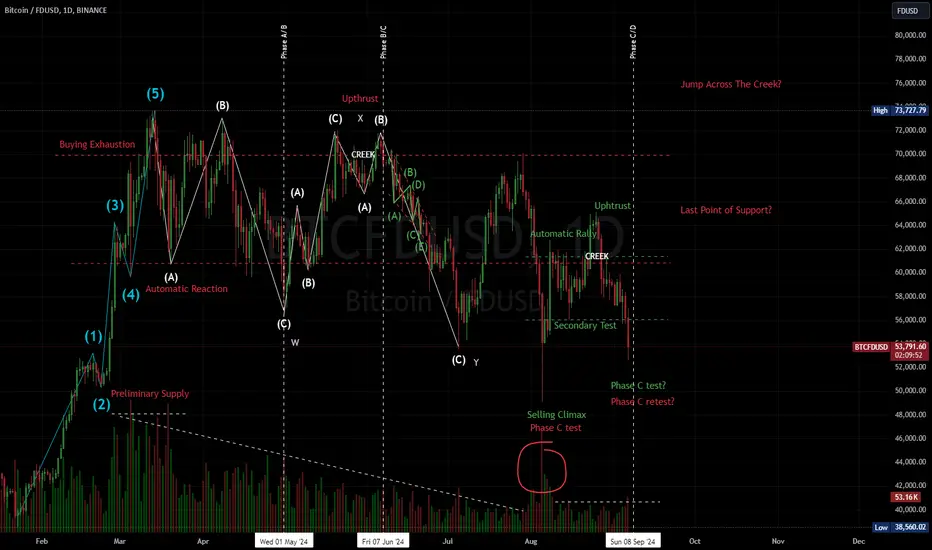
Bitcoin - Technical AnalysisDear Analysts and Traders,
Looking at the Bitcoin price chart, I notice a variety of structures described by Technical Analysis. My attention is particularly drawn to elements related to the Elliott and Wyckoff methodologies. The market appears chaotic yet orderly at the same time.
I must mention
See all ideas
Summarizing what the indicators are suggesting.
Oscillators
Neutral
Oscillators
Neutral
Summary
Neutral
Summary
Neutral
Summary
Neutral
Moving Averages
Neutral
Moving Averages
Neutral
Displays a symbol's price movements over previous years to identify recurring trends.