BTCFDUSD | Elliott Wave Analysis ๐
July 27, 2026 | ๐ 7:22 PM WIB (UTC+7)
Wave (a) appears to be complete, and I am currently expecting the market to develop Wave (b) within the ongoing ABC corrective structure.
My primary downside target for Wave (b) is the 0.618โ0.764 Fibonacci retracement zone, located between:
๐ $61,420 โ $60,090
This area will be closely monitored for signs of a potential completion of Wave (b).
Key Levels
๐จ Wave (b) Target: $61,420 โ $60,090
๐ด Resistance: $66,500 โ $67,000
โ ๏ธ This Elliott Wave coun
In-depth trading ideas
๏ปฟMastering:How to Predict the Perfect Entry Point in Crypto?Analyzing BTC/USD in multiple time frames:
22-day time frame, weekly time frame, daily time frame, and 4-hour time frame.
Key Trend Observed:
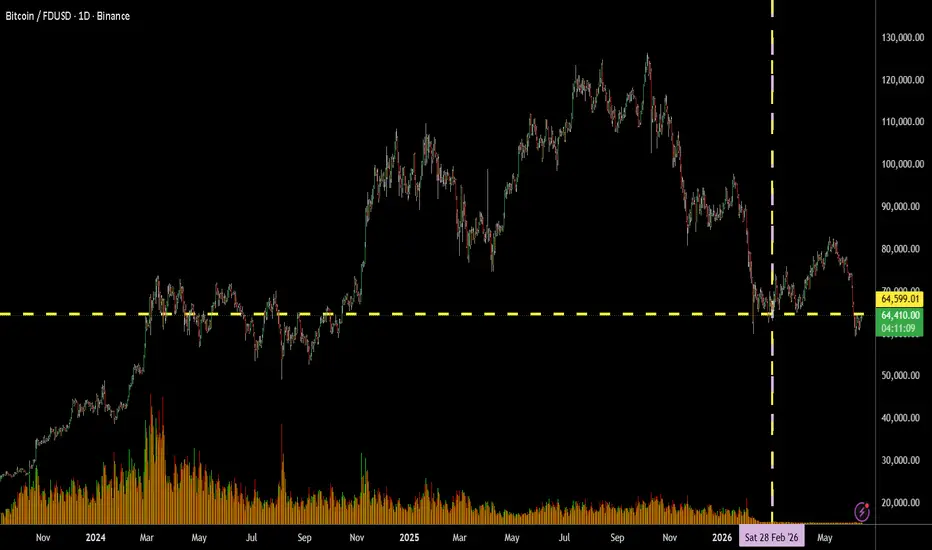
In the period from May to September 2024, BTC/USD traded in the range of 70,000 to 64,000. After February 28, 2026, the price initially surged to 85,000 but then reverted back to 64,000 by June.
Insight & Strategy:
This price action highlights an important lesson: patience is key. Rather than reacting to FOMO (fear of missing out) and jumping in,
BTCFDUSD:Support and Resistance Levels Indicate Potential Move
Title:
BTCFDUSD: Key Support and Resistance Levels Indicate Potential Moves
Greetings, Traders!
๐ Hello everyone,
As we analyze BTCFDUSD, we observe critical support and resistance levels that could shape the upcoming price action. Understanding these levels can help traders navigate the market effectively.
BINANCE:BTCFDUSD
Key Observations:
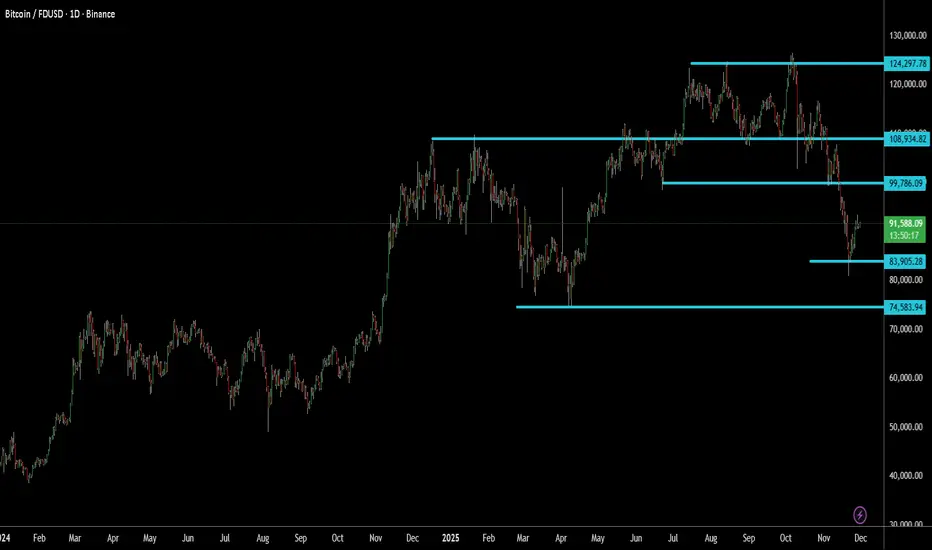
- The strongest support level is identified at 74583 , with an immediate support level at 83905 . Currently, the price stands at 91635 , s
Psychological Trap That Costs You More Than Just Money โ KnowHow๐ฏ Psychological Trap That Costs You More Than Just Money โ Know the "Profit Illusion Trap"
โThe biggest cost in trading is not just losing money; itโs losing control of your mind.โ
Letโs break down a common yet dangerous psychological trap that derails even experienced tradersโโProfit Illusion Trapโ (you can rename this as per your idea, but this name captures the concept well).
๐ Real Trade Scenario: What Went Wrong?
You took a long position at 108500.
Soon, the price dropped by 300 poin
BTCFDUSD appears downtrend๐ Analyzing **FDUSD** across multiple timeframes:
**22-day time frame**, **Weekly time frame**, **Daily time frame**, and **4-hour time frame**.
๐ FDUSD appears to be in a downtrend and showing signs of further decline.
If the key support level fails to hold, we may see an extended drop.
๐ป Key Levels to Watch:
๐น **Immediate Support:** Key demand zone holding price.
๐น **Resistance Levels:** Any bounce should be monitored for rejection zones.
๐ Stop Loss should be placed
BTC Crypto 4h chart looks falling -long later๐ Looking at the analysis of **BTCFDUSD** across multiple time frames:
**22-day time frame**, **Weekly time frame**, **Daily time frame**, and **4-hour time frame**.
๐ BTCFDUSD is currently at **$104,688** and is expected to pull back before resuming an upward move.
A better entry point would be around **$102,550** for an optimal risk-reward setup! ๐๐
๐ Stop Loss can be set below the support level to manage risk effectively.
๐ We are utilizing key support and resistance le
BTCUSD Channel Formation - Targeting $69,000 to $72,000 in Two W๐ ๐
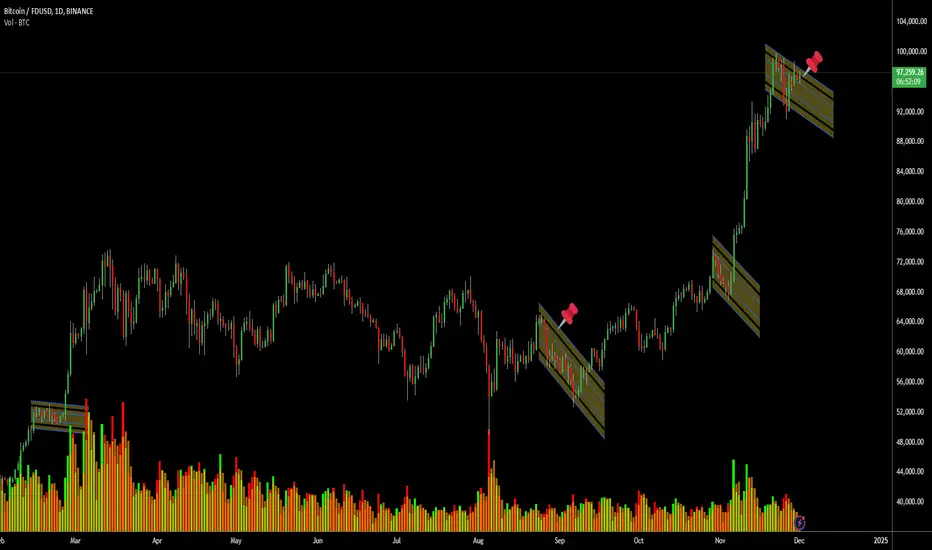
In this setup, BTCUSD is showing strong momentum within a defined upward channel, aiming to reach the $69,000 to $72,000 range within the next two weeks. Given recent price action and underlying support, Bitcoin appears ready for a solid breakout within this range, providing an attractive risk-to-reward opportunity for traders.
Key Highlights:
Channel Resistance: Target range sits at $69,000 - $72,000.
Support Levels: Recent lows suggest strong support within the current trend channel, ad
Bitcoin - Technical AnalysisDear Analysts and Traders,
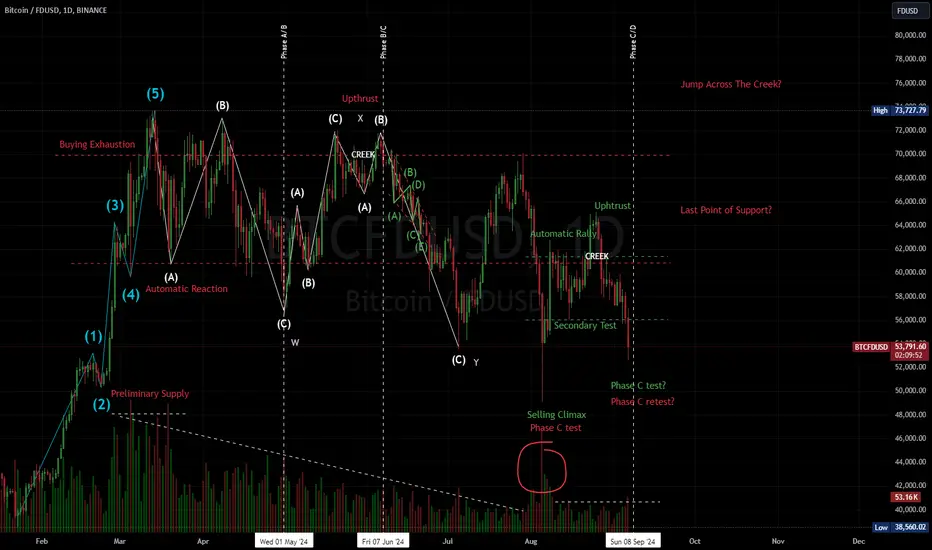
Looking at the Bitcoin price chart, I notice a variety of structures described by Technical Analysis. My attention is particularly drawn to elements related to the Elliott and Wyckoff methodologies. The market appears chaotic yet orderly at the same time.
I must mention that I am not someone with formal education in this field. I am self-taught, placing a strong emphasis on using Technical Analysis as the main component of my decision-making process. This stems from
Bitcoin (BTC): Witnessing Support, Potential Long Opportunity Ah
Title:
Bitcoin (BTC): Witnessing Support, Potential Long Opportunity Ahead
Overview:
Hello Traders,
Bitcoin (BTC) is currently finding support, signaling a potential long opportunity on the horizon.
CRYPTO:BTCUSD
Key Points:
- Bitcoin (BTC) is encountering support at current levels, indicating a potential reversal of the recent downtrend.
- Traders are closely monitoring BTC's price action for confirmation of the support level and potential entry points for long positions.
- Po
BTC far outside it's main channel, needs correctionBTC is outside it's main channel and needs to either come back down to it and bounce off or break back into it and continue lower.
Can first rise to the 69,600 region before retesting the support at 65,700
If the support breaks the next support to test will be at 61,000 then 57,600
If the price bounces off the support, then it's likely to continue higher to resistance at 76,500 then 81,500