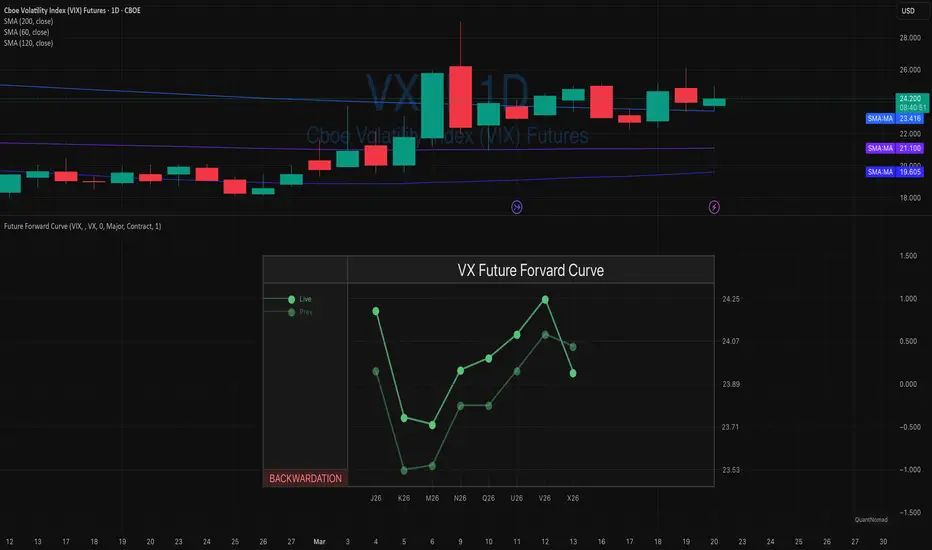
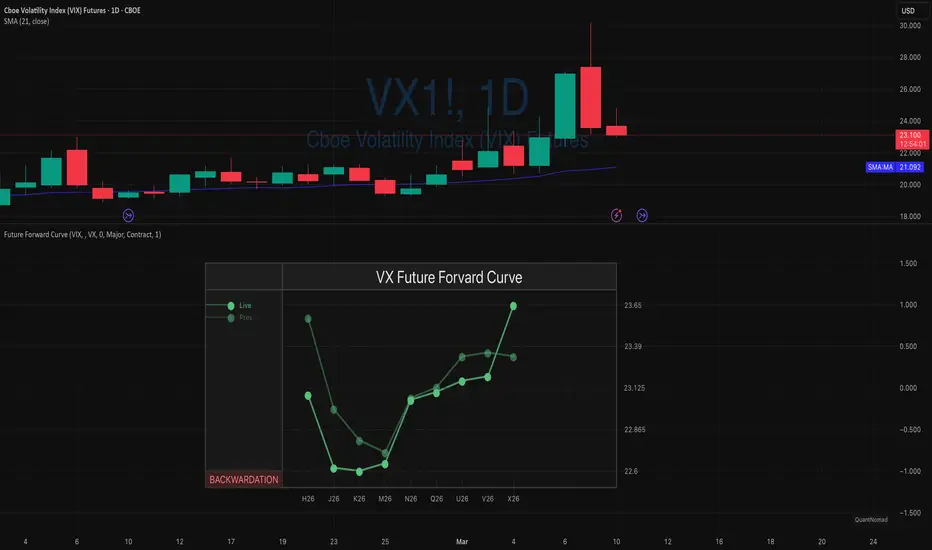
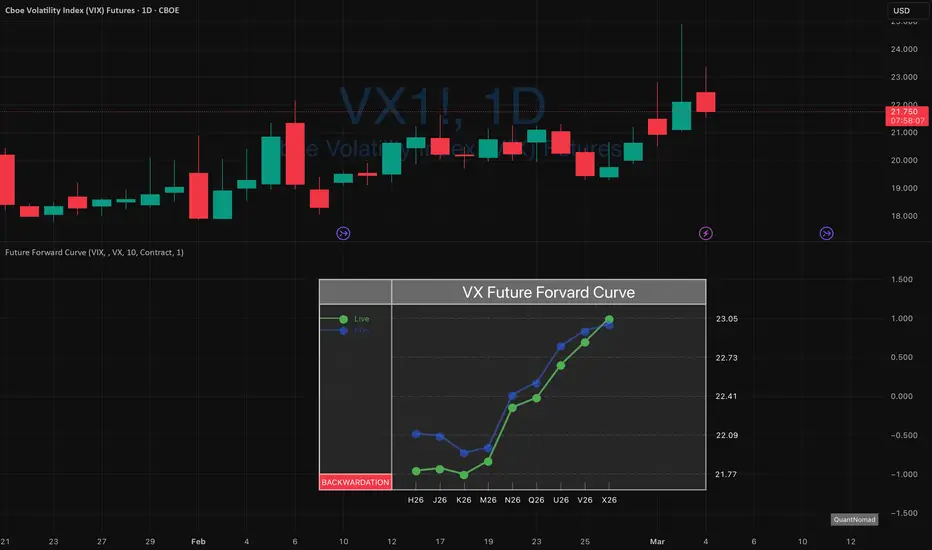
VX1! - Why complicate things? (Update to Aug 10 posted trade)Went short back in May and posted the original chart on Aug 10, 2026. This is the updated chart with contract rolls to Sept 26.
There's the stop as of now... sizing is KEY, but not for thee..... not here anyway :-)
When you start trading a proven system, you stop worry about the utter nonsense that prevents most traders from winning....
When stops need to be moved, I'll update here.
And yes all of my public posts are delayed for a reason. Ask why or think harder :-)
In-depth trading ideas
Cheap Means Two Things — VIX and Nat Gas Need Opposite Rulers1. The market is always right.
2. Every price is already determined.
3. Every view stays open to all probabilities, the way quantum mechanics does.
4. All evolution happens through repetition.
"Buy it when it gets cheap."
Almost everyone says this. I said it myself for years. Then one day I looked at the sentence again and realised it settles nothing at all.
Cheap compared to what?
Until you answer that, "buy it when it gets cheap" is an instruction with no content. So I took the same sent
VX1! - Why complicate things?We've been short for a while now. You see the stop as of now... sizing is KEY, but not for thee..... not here anyway :-)
When you start trading a proven system, you stop worry about the utter nonsense that prevents most traders from winning....
When stops need to be moved, I'll update here. Although dang, we should do that soon I'm thinking :-)
And yes all of my public posts are delayed for a reason. Suck it up, buttercup :-)
Long the Vix or Vx FuturesVix is bullish here... came to visit the CE of the recently formed Monthly + SB... also created a 1h + SB just above said CE.
Targets are different if you are short term, swing or position trading...
Ultimately we see the risk of a larger TF breakout approaching on vix, but for now "best targets" are the Weekly + SB CE above.
VIX Broke Compression — What Next After the Weekend?📝 Description
VIX just broke out of a rare compression regime (~0.6 curve range, <2% of cases since 2004).
That usually signals a shift from uncertainty → active risk pricing.
Now we hit the weekend pause:
No trading
Positioning locked
Risk can reprice sharply on Monday
🔍 What to Watch
Above 25–26 → continuation likely
Curve steepening (backwardation) → real stress
Spot leading futures → panic not fully priced
🎯 Scenarios
🟢 Stabilization → 22–25
🟡 Expansion → 28–32
🔴 S
VIX Curve Compression: Rare Flat Structure with Expansion RiskThe VIX futures curve is currently extremely flat, with curve compression at ~0.55 today (vs ~0.60 yesterday) — meaning only about a $0.55 difference between the lowest and highest futures.
What makes this interesting is that it’s not easy to visually spot on a chart, but in reality, this is an unusually compressed structure for the VIX forward curve.
Such conditions are very rare, occurring in <2% of cases (~90 days since 2004).
A flat curve reflects uncertainty across maturities, where the
VIX Futures Curve Normalizing After Volatility SpikeAfter the sharp spike in volatility, the VX forward curve is gradually returning to a more typical shape.
Back-end futures are already back in contango
Front-end backwardation compressing quickly as spot VIX declines
This kind of rapid normalization often suggests the market is pricing a temporary volatility event rather than a prolonged risk regime.
Disclaimer:
This analysis is for educational purposes only and reflects personal market observations. It does not constitute investment, f
$OIL $VIX $SPX $NDX - Insane Whipsaw!🎢 Absolute insanely volatile day in the markets thanks to Trump 🤡
🧴 OIL Futures spiked >30% then dumped the same
🌋 VIX Futures spiked to 30 then down >20%
VIX is still ~25 which is the critical level to watch for markets
Both OIL and VIX are trading above the 9DEMA so neither of these moves are over by any means
📈 In lieu of all this, SPX and NDX both dumped below their 200DMA
SPX got rejected at the 9EMA while NDX got rejected at the 20DMA for the Daily Close
🍿 Tomorrow is going to be a w
S&P 500 dip buying at 200-day SMA?A setup I monitor closely includes the S&P 500 and the VIX – the CBOE’s Volatility Index. It is straightforward, but it only materialises a few times a year.
As shown in the chart below, the S&P 500 is approaching a retest of the 200-day SMA at 6,582, which could serve as dynamic support. Assuming price continues to pull back and connect with the 200-day SMA while the VIX falls back below the upper Bollinger Band (set to 2 standard deviations), this could create a dip-buying opportunity, as se
VIX Term Structure StabilizingVIX curve back in okeish contango — structure looks normal again.
Front month not aggressively bid, no signs of stress positioning.
VVIX ticking up slightly, but still controlled — no panic in vol-of-vol.
As long as contango holds and VVIX stays contained, this looks like a stable volatility regime rather than a risk-off shift.
Watching for any flattening or backwardation as an early warning.
Disclaimer:
This analysis is for educational purposes only and reflects personal market observatio
VX1! USDO YOU KNOW WHATS BEHIND THIS OR OTHER IDEAS?? in bio..
Preferably suitable for scalping and accurate as long as you watch carefully the price action with the drawn areas.
With your likes and comments, you give me enough energy to provide the best analysis on an ongoing basis.
And if you needed any analysis that was not on the page, you can ask me with a comment or a personal message.
Enjoy Trading ;)
VX1! INDEXPreferably suitable for scalping and accurate as long as you watch carefully the price action with the drawn areas.
With your likes and comments, you give me enough energy to provide the best analysis on an ongoing basis.
And if you needed any analysis that was not on the page, you can ask me with a comment or a personal message.
Enjoy Trading ;)
Fib Analysis for VIX! FuturesAI Generated Thesis. (I'm Lazy)
# VIX Fibonacci Circle-Extension Analysis
## Core Methodology
**Fibonacci circles** (timing) + **Fibonacci extensions** (2.618, 3.618, 4.618) = High-probability reversal zones
**Key Pattern**: When VIX reaches extension levels while touching Fibonacci circle rings → **pullback before next target**
## Price Action Analysis by Level
### 2.618 Extension Level (~24-25 Area)
**Historical Behavior**:
- Strong initial rejection upon first touch
- Multiple tests with
VIX: A Silent SirenVIX pulled back from 41.50 to hold at 24.50 and now trades near 27. A breakout above 27 targets 34 and 36.60.
Market Message: The fear gauge is no longer receding after spikes—it's forming higher lows. Expecting more volatility is not paranoia; it's preparation.
Strategic Warning: A rising VIX during falling yields and equities reflects systemic fragility. Watch for liquidity events or credit stress.