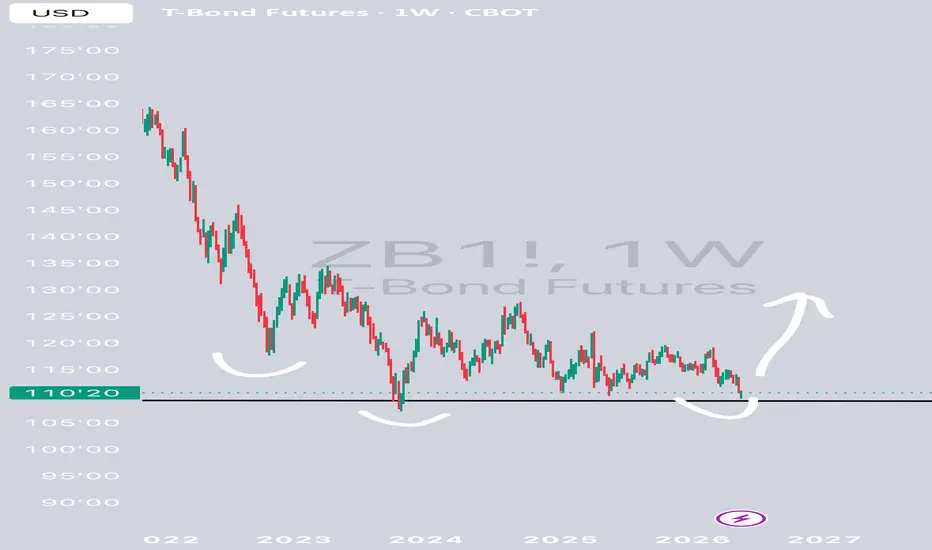
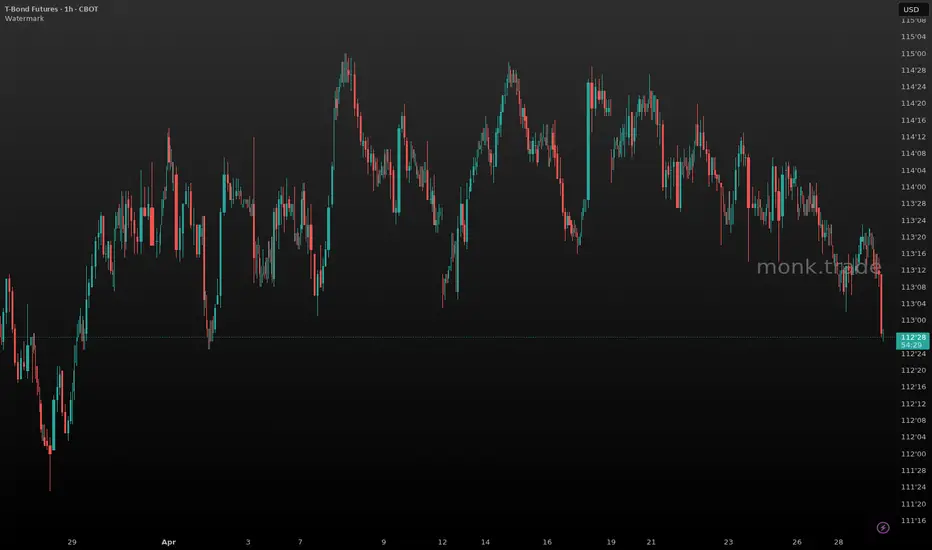
ZB Short — Long-end yields are ripping on sticky inflation, and Bond futures are staging a classic breakdown, pressing directly against support with a well-aligned bearish trend. The move is heavily corroborated by macro headlines emphasizing a historic surge in long-end yields driven by sticky inflation. This structural setup has the exact fundamental fuel requ
Compare with U.S. Treasury Bond Futures (Jun 2020)
ZB Short — $ZBM26 long-bond breakdown continues as yields push tSetup: The 4h chart shows a clear lower-highs, lower-lows structure since the April 7 peak near 114.75. Each rally has failed at a lower level — the most recent bounce to 114.00 on May 6-7 was rejected and price has since rolled over, now trading at 112.375 with the session low probing 112.34. The 1
ZB Short — ZB breaking below 112.50 on surging volume as duratioSetup: The 4h chart shows a clean sequence of lower highs from the April 8 peak near 115.00 down through 114.50, 114.00, and now 113.00, confirming a well-established downtrend. Price broke decisively through the 113.00 support shelf on April 29 with a large-range, high-volume candle and has since b
ZB Short — ZB breakdown accelerating — 30Y duration selling withSetup: The 4h chart shows a clear sequence of lower highs from the mid-April peak near 114.75 down through 114.50, 114.25, and now sub-113.50. The 1h bars confirm the structure: after consolidating in the 113.40–113.65 zone for most of Apr 28, ZB broke hard this morning — the Apr 29 07:00 bar printe
DXY 30/10y T-Notes and EUR USD are signalling significant moveThe 30-year and 10-year U.S. Treasury bonds are confirming a larger trend. The 30-year bond is trending down after testing the bottom of the triangle.
You understand that for crypto, the stock market, and commodities, this usually signals a reversal. And for the euro-dollar, of course, as well.
Th
ZB Futures: Long Bond at a Critical Inflection PointMacro Crosswinds and a Market at a Crossroads
The CME 30-Year U.S. Treasury Bond futures contract, ticker ZB, is one of the most closely watched instruments in global fixed income. Each contract carries a face value of $100,000 and trades nearly 24 hours a day, five days a week, with a minimum pri
See all ideas
A representation of what an asset is worth today and what the market thinks it will be worth in the future.
Displays a symbol's price movements over previous years to identify recurring trends.
Frequently asked questions
The nearest expiration date for U.S. Treasury Bond Futures (Jun 2020) is Jun 19, 2020.
Traders prefer to sell futures contracts when they've already made money on the investment, but still have plenty of time left before the expiration date. Thus, many consider it a good option to sell U.S. Treasury Bond Futures (Jun 2020) before Jun 19, 2020.