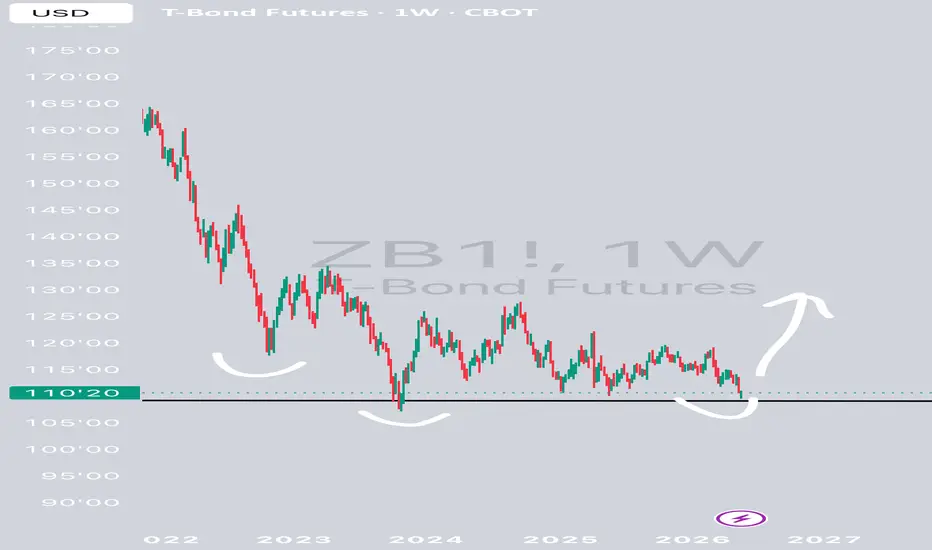
My bonds are meltingBonds have been falling like there's no tomorrow.
What's happening specifically? Even Trump seems to have accepted that inflation is stickier than glue. The new FED chairman seems to have no intention of lowering rates because with high inflation he just can't do it.
The algorithm points out 2 sets
Peers for comparison
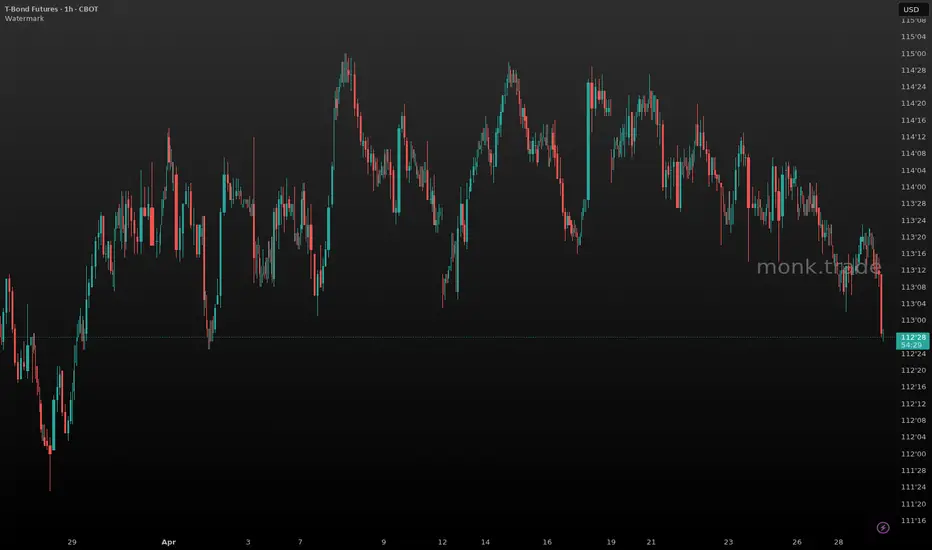
Willing to short bonds if I get the chanceBonds have been falling hard and, by the looks of it, they want to keep falling:
So I'm going to follow the trend. Nothing more, nothing less.
If I get a pullback, I'll look for a short at higher prices, in what would be called "resistance."
Both the 4-hour chart and this 20-minute chart are fr
ZB Short — Long bonds are choking on hot inflation and heavy aucThe long end of the curve is getting hammered, with 30-year yields surging past 5% on inflation and auction pressures. This macro reality strongly corroborates the technical short setup, offering a highly lucrative 3R descent into the next structural support zone.
📍 Entry: 110.25000
🛑 Stop: 110.593
ZB Short — Long-end yields are ripping on sticky inflation, and Bond futures are staging a classic breakdown, pressing directly against support with a well-aligned bearish trend. The move is heavily corroborated by macro headlines emphasizing a historic surge in long-end yields driven by sticky inflation. This structural setup has the exact fundamental fuel requ
ZB Short — $ZBM26 long-bond breakdown continues as yields push tSetup: The 4h chart shows a clear lower-highs, lower-lows structure since the April 7 peak near 114.75. Each rally has failed at a lower level — the most recent bounce to 114.00 on May 6-7 was rejected and price has since rolled over, now trading at 112.375 with the session low probing 112.34. The 1
ZB Short — ZB breaking below 112.50 on surging volume as duratioSetup: The 4h chart shows a clean sequence of lower highs from the April 8 peak near 115.00 down through 114.50, 114.00, and now 113.00, confirming a well-established downtrend. Price broke decisively through the 113.00 support shelf on April 29 with a large-range, high-volume candle and has since b
ZB Short — ZB breakdown accelerating — 30Y duration selling withSetup: The 4h chart shows a clear sequence of lower highs from the mid-April peak near 114.75 down through 114.50, 114.25, and now sub-113.50. The 1h bars confirm the structure: after consolidating in the 113.40–113.65 zone for most of Apr 28, ZB broke hard this morning — the Apr 29 07:00 bar printe
DXY 30/10y T-Notes and EUR USD are signalling significant moveThe 30-year and 10-year U.S. Treasury bonds are confirming a larger trend. The 30-year bond is trending down after testing the bottom of the triangle.
You understand that for crypto, the stock market, and commodities, this usually signals a reversal. And for the euro-dollar, of course, as well.
Th
See all ideas
A representation of what an asset is worth today and what the market thinks it will be worth in the future.
Displays a symbol's price movements over previous years to identify recurring trends.
Frequently asked questions
One way to gain exposure to ZBM2023 is through a broker that offers futures. Before trading, make sure you understand how the product works and the risks involved.
You can trade ZBM2023 directly from TradingView:
– Choose a broker: Explore our supported trading partners and pick one that fits your needs
– Compare options: View available brokers side by side to evaluate fees and features
– Connect your account: Open Supercharts, click "Trade", select your broker, and log in
– Start trading: Place orders directly from the chart
Tip: If you're new to trading, try paper trading first — it lets you practice strategies in real market conditions without risking funds.
You can trade ZBM2023 directly from TradingView:
– Choose a broker: Explore our supported trading partners and pick one that fits your needs
– Compare options: View available brokers side by side to evaluate fees and features
– Connect your account: Open Supercharts, click "Trade", select your broker, and log in
– Start trading: Place orders directly from the chart
Tip: If you're new to trading, try paper trading first — it lets you practice strategies in real market conditions without risking funds.
The nearest expiration date for ZBM2023 is Jun 21, 2023.
Futures contracts expire on predetermined dates. As expiration approaches, many traders roll positions into the next contract to maintain exposure to the market.
Key metrics to watch near expiration:
• Volume and liquidity: Trading activity often shifts to the next contract month
• Open interest: Falling open interest may signal positions being closed or rolled forward
• Forward curve: Differences between contract prices can help identify market structure, including contango and backwardation
Explore the ZBM2023 chart to monitor active contracts and contract-month activity.
Futures contracts expire on predetermined dates. As expiration approaches, many traders roll positions into the next contract to maintain exposure to the market.
Key metrics to watch near expiration:
• Volume and liquidity: Trading activity often shifts to the next contract month
• Open interest: Falling open interest may signal positions being closed or rolled forward
• Forward curve: Differences between contract prices can help identify market structure, including contango and backwardation
Explore the ZBM2023 chart to monitor active contracts and contract-month activity.