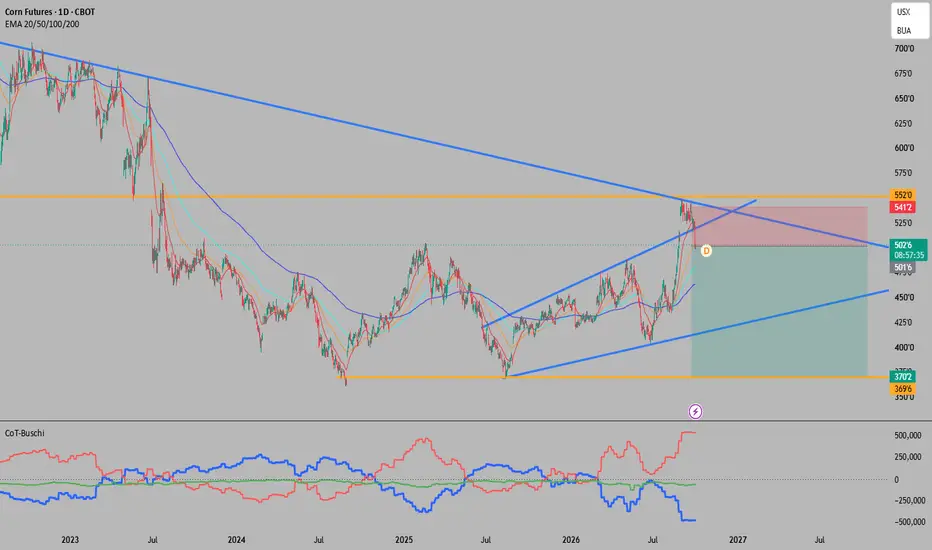
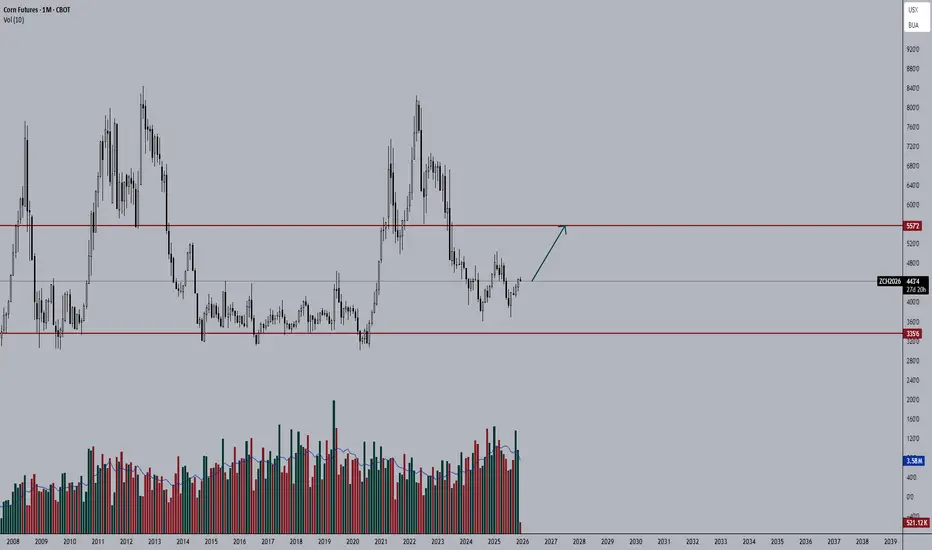
Corn Futures: Cup-and-Handle Retest at Key Support**Corn Futures: Cup-and-Handle Retest at Key Support**
The daily chart shows that the previously completed cup-and-handle formation successfully reached its measured target near **547’0**, representing an advance of approximately **17.85%** from the breakout area. Following the completion of this t
Peers for comparison
Contract highlights
Corn Futures (ZC) Test 475'0 After USDA Yield Shock: What Next?A Yield Surprise Meets a Crowded Corn Trade
As of the October 16, 2026 settlement, December corn (ZC) closed at 474'2, in the vicinity of 475'0. The main catalyst was USDA’s October 9 Crop Production and WASDE reports. USDA raised the 2026/27 U.S. corn yield by 2.7 bushels to 181.2 bushels per acr
Corn: Why Risk Managers Watch ATR, Not Just PriceRisk teams care about how far a market can move, not which way.
Average True Range (ATR) measures the typical daily move. On this daily corn chart, ATR has roughly doubled from around 6 to around 12 over the past few months. That means the same position now carries about double the risk it did earl
Corn: double top at 549, short below 525Corn rallied from the 456 August low to 549'6 in early September, about 20% in four weeks. The follow through never came. Price pulled back to the 525 area, rallied again into a lower high near 545 on September 22, and has now broken below the mid September swing low. That completes a double top on
Will Corn Crush The Six-Dollar Ceiling By 2027?The corn futures market approaches a critical inflection point. Some market watchers see a path to $6 per bushel by early 2027. Recent technical charts reveal a bullish pattern of higher lows. December futures touched a three-year high just under $5.50 in early September. On September 11, the USDA r
Commodities Are Outperforming AI StocksWhile many are still focusing on and hoping for AI stocks to resume their rally following the July meltdown, corn has gained 36% since June.
During this period, grains have already been outperforming AI stocks.
Many analysts will attribute the rise in commodities to supply, demand, and weather con
Corn Futures: Next Stop 630?Corn has rallied hard over the past couple of weeks, pushing to virtually 3-year highs on the weekly chart. Psychologically, it's tempting to assume a move like that is already "done" — but the chart says otherwise.
The setup: Beneath this rally sits a sizeable base, and measuring the apex of that
ZC1!China’s demand for agricultural commodities—especially soybeans and corn—is a direct function of the country’s “agricultural revolution,” characterized by a significant dietary shift toward animal-based foods. Per capita dairy consumption has skyrocketed from 3.1 kg in 1982 to 12.6 kg in 2025, a fac
The Confluence Principle in Smoothed Oscillator Desig● 🧠 The Conceptual Origin of Smoothed Momentum Trailing Systems
- The intellectual lineage of this framework traces back to a foundational problem in technical analysis: the raw oscillator, in its native form, is far too erratic to serve as a reliable directional arbiter. Classical momentum measur
See all ideas
A representation of what an asset is worth today and what the market thinks it will be worth in the future.
Displays a symbol's price movements over previous years to identify recurring trends.
Frequently asked questions
One way to gain exposure to ZCN2019 is through a broker that offers futures. Before trading, make sure you understand how the product works and the risks involved.
You can trade ZCN2019 directly from TradingView:
– Choose a broker: Explore our supported trading partners and pick one that fits your needs
– Compare options: View available brokers side by side to evaluate fees and features
– Connect your account: Open Supercharts, click "Trade", select your broker, and log in
– Start trading: Place orders directly from the chart
Tip: If you're new to trading, try paper trading first — it lets you practice strategies in real market conditions without risking funds.
You can trade ZCN2019 directly from TradingView:
– Choose a broker: Explore our supported trading partners and pick one that fits your needs
– Compare options: View available brokers side by side to evaluate fees and features
– Connect your account: Open Supercharts, click "Trade", select your broker, and log in
– Start trading: Place orders directly from the chart
Tip: If you're new to trading, try paper trading first — it lets you practice strategies in real market conditions without risking funds.
The nearest expiration date for ZCN2019 is Jul 12, 2019.
Futures contracts expire on predetermined dates. As expiration approaches, many traders roll positions into the next contract to maintain exposure to the market.
Key metrics to watch near expiration:
• Volume and liquidity: Trading activity often shifts to the next contract month
• Open interest: Falling open interest may signal positions being closed or rolled forward
• Forward curve: Differences between contract prices can help identify market structure, including contango and backwardation
Explore the ZCN2019 chart to monitor active contracts and contract-month activity.
Futures contracts expire on predetermined dates. As expiration approaches, many traders roll positions into the next contract to maintain exposure to the market.
Key metrics to watch near expiration:
• Volume and liquidity: Trading activity often shifts to the next contract month
• Open interest: Falling open interest may signal positions being closed or rolled forward
• Forward curve: Differences between contract prices can help identify market structure, including contango and backwardation
Explore the ZCN2019 chart to monitor active contracts and contract-month activity.